HAL Id: hal-01789789
https://hal.archives-ouvertes.fr/hal-01789789
Submitted on 11 May 2018
HAL is a multi-disciplinary open access
archive for the deposit and dissemination of
sci-entific research documents, whether they are
pub-lished or not. The documents may come from
teaching and research institutions in France or
abroad, or from public or private research centers.
L’archive ouverte pluridisciplinaire HAL, est
destinée au dépôt et à la diffusion de documents
scientifiques de niveau recherche, publiés ou non,
émanant des établissements d’enseignement et de
recherche français ou étrangers, des laboratoires
publics ou privés.
Modelling tree ring cellulose δ
O variations in two
temperature-sensitive tree species from North and
South America
Aliénor Lavergne, Fabio Gennaretti, Camille Risi, Valérie Daux, Etienne
Boucher, Martine Savard, Maud Naulier, Ricardo Villalba, Christian Begin,
Joel Guiot
To cite this version:
Aliénor Lavergne, Fabio Gennaretti, Camille Risi, Valérie Daux, Etienne Boucher, et al.. Modelling
tree ring cellulose δ
18O variations in two temperature-sensitive tree species from North and South
America. Climate of the Past, European Geosciences Union (EGU), 2017, 13 (11), pp.1515 - 1526.
�10.5194/cp-13-1515-2017�. �hal-01789789�
https://doi.org/10.5194/cp-13-1515-2017 © Author(s) 2017. This work is distributed under the Creative Commons Attribution 4.0 License.
Modelling tree ring cellulose
δ
18
O variations in two
temperature-sensitive tree species from North
and South America
Aliénor Lavergne1,b, Fabio Gennaretti1,a, Camille Risi2, Valérie Daux3, Etienne Boucher4, Martine M. Savard5, Maud Naulier6, Ricardo Villalba7, Christian Bégin5, and Joël Guiot1
1Aix Marseille Université, CNRS, IRD, Collège de France, CEREGE, ECCOREV, Aix-en-Provence, France 2Laboratoirede Météorologie Dynamique, IPSL, UPMC, CNRS, Paris, France
3Laboratoire des Sciences du Climat et de l’Environnement, CEA-CNRS-UVSQ, 91191 Gif-sur-Yvette, France 4Department of Geography and GEOTOP, Université du Québec à Montréal, Montréal, Canada
5Geological Survey of Canada, Natural Resources Canada, 490 rue de la Couronne, QC, G1K9A9, Canada
6Institut de Radioprotection et de Sureté Nucléaire (IRSN), PRP-ENV, SERIS/LRTE, Saint-Paul-lez-Durance, France 7Instituto Argentino de Nivología, Glaciología y Ciencias Ambientales, IANIGLA-CONICET, Mendoza, Argentina anow at: INRA Centre Grand Est – Nancy, UMR1137 Ecologie et Ecophysiologie Forestières, Champenoux, 54280, France bnow at: Imperial College London, Department of Life Sciences, Silwood Park Campus, Buckhurst Road, Ascot SL5 7PY, UK
Correspondence to:Aliénor Lavergne (a.lavergne@imperial.ac.uk) and Fabio Gennaretti (fabio.gennaretti@inra.fr) Received: 13 July 2017 – Discussion started: 24 July 2017
Revised: 4 October 2017 – Accepted: 9 October 2017 – Published: 10 November 2017
Abstract.Oxygen isotopes in tree rings (δ18OTR) are widely used to reconstruct past climates. However, the complex-ity of climatic and biological processes controlling isotopic fractionation is not yet fully understood. Here, we use the MAIDENiso model to decipher the variability in δ18OTRof two temperature-sensitive species of relevant palaeoclimato-logical interest (Picea mariana and Nothofagus pumilio) and growing at cold high latitudes in North and South America. In this first modelling study on δ18O
TRvalues in both north-eastern Canada (53.86◦N) and western Argentina (41.10◦S), we specifically aim at (1) evaluating the predictive skill of MAIDENiso to simulate δ18OTR values, (2) identifying the physical processes controlling δ18OTRby mechanistic mod-elling and (3) defining the origin of the temperature sig-nal recorded in the two species. Although the linear regres-sion models used here to predict daily δ18O of precipitation (δ18OP) may need to be improved in the future, the result-ing daily δ18OPvalues adequately reproduce observed (from weather stations) and simulated (by global circulation model) δ18OP series. The δ18OTRvalues of the two species are cor-rectly simulated using the δ18OPestimation as MAIDENiso input, although some offset in mean δ18OTR levels is
ob-served for the South American site. For both species, the variability in δ18OTRseries is primarily linked to the effect of temperature on isotopic enrichment of the leaf water. We show that MAIDENiso is a powerful tool for investigating isotopic fractionation processes but that the lack of a denser isotope-enabled monitoring network recording oxygen frac-tionation in the soil–vegetation–atmosphere compartments limits our capacity to decipher the processes at play. This study proves that the eco-physiological modelling of δ18O
TR values is necessary to interpret the recorded climate signal more reliably.
1 Introduction
Oxygen isotopes in tree rings (δ18OTR) are increasingly used as indicators of past climatic changes in temperate ar-eas (Cernusak and English, 2015; Hartl-Meier et al., 2014; Saurer et al., 2008). They have been widely used to recon-struct past atmospheric conditions such as air temperature (Naulier et al., 2015), drought (Labuhn et al., 2016), precip-itation amount (Rinne et al., 2013), isotopic composition of
precipitation (Danis et al., 2006), relative air humidity (Wer-nicke et al., 2015), cloud cover (Shi et al., 2012), and even atmospheric circulation patterns (Brienen et al., 2012). This diversity of climatic targets possibly reconstructed based on oxygen isotopes hints at the challenge of understanding the complexity of the climatic and biological processes that con-trol isotopic fractionation of oxygen in trees (Treydte et al., 2014). Uncertainties arise because different poorly measured factors influence δ18OTRvalues. Isotopic signals in tree rings cellulose are strongly influenced by isotopic signature of soil water taken up by the roots and by evaporative and phys-iological processes occurring at the leaf level and during downstream metabolism (Barbour et al., 2005; Gessler et al., 2014). Thus, a comprehensive approach that embraces exist-ing mechanistic understandexist-ing of the fractionation processes involved is required.
A few isotopic process-based models have been developed to investigate the mechanistic rules governing the δ18OTR variations (Guiot et al., 2014): the Péclet-modified Craig– Gordon model (Kahmen et al., 2011) and the Roden’s model (Roden et al., 2000) are able to estimate, at a daily time step, the δ18O values of soil and xylem waters as well as the isotopic fractionation occurring in the leaves due to evap-otranspiration. Versions of these models are integrated in more complete forest ecophysiological models simulating the ensemble of forest water and carbon fluxes: (1) MAIDEN (Modeling and Analysis In DENdroecology) (Gea-Izquierdo et al., 2015; Misson, 2004), which contains the isotopic module MAIDENiso (Danis et al., 2012), and (2) MUSICA (Ogée et al., 2003, 2009). Both account for important post-photosynthetic factors and are able to link photosynthesis and carbohydrate allocation to stem growth.
In this paper, we use the MAIDENiso model to decipher the δ18OTR variability in American temperature-sensitive species (Picea mariana in northeastern Canada and Nothofa-gus pumilioin western Argentina). The selected sites are of special interest for palaeoclimatology given that their δ18OTR chronologies carry strong temperature signals. A summer temperature reconstruction was already developed at the North American site (Gennaretti et al., 2017b; Naulier et al., 2015) and a calibration study conducted at the South Amer-ican one highlighted the strong potential of δ18OTR values to reflect variations in summer–autumn temperatures over a large region south of 38◦S (Lavergne et al., 2016). However, up to now, the climate-δ18OTR relationships were analysed using a black box approach based on linear models. Here, we specifically aim at (1) evaluating the predictive skill of MAIDENiso to simulate δ18OTR values, (2) identifying the physical processes controlling δ18OTRby mechanistic mod-elling and (3) defining the origin of the temperature signal recorded in the two species.
2 Data and methods
2.1 Sampling sites and tree ring data
Two high-latitude American native species were studied here: (1) Picea mariana (Mill. B.S.P.; black spruce), which is a conifer widely distributed over the American boreal forest (Viereck and Johnston, 1990), and (2) Nothofagus pumilio (Poepp. et Endl. Krasser; lenga), which is an angiosperm de-ciduous species dominating the high-elevation forests along the Patagonian Andes from 35 to 55◦S (Donoso, 1981; Schlatter, 1994). We selected two sites of P. mariana in the centre of the Québec–Labrador Peninsula in northeast-ern Canada (L01 and L20; from 53◦510N–72◦240W to 54◦330N–71◦140W; ∼ 480 m elevation; see Gennaretti et al., 2014, and Naulier et al., 2014, for details) and three sites of N. pumilio in northern Patagonia, western Argentina (NUB, ALM and CHA; from 41◦090S–71◦480W to 41◦150S–71◦ 170W; 1270–1610 m elevation; see Lavergne et al., 2016, 2017, for details). Climate in northeastern Canada is mostly continental and subarctic with short, mild and wet summers and long, cold and dry winter. Total annual precipitation av-erages 825 mm, with up to 46 % falling during the growing season in summer (June to September) (Naulier et al., 2014). In western Argentina, precipitation is largely concentrated from late autumn to early spring (May–November) followed by a drier and mild period during summer and early autumn (December–April) (López Bernal et al., 2012).
Four trees per site were collected for both species. The se-lection of the samples and analytical procedure for δ18OTR measurements were described in Lavergne et al. (2016) and Naulier et al. (2014). The developed δ18OTR chronologies covered the 1950–2005 and 1952–2011 periods at the north-eastern Canadian and western Argentinian sites, respectively. The chronologies that were built for each species were sig-nificantly correlated between stands (Fig. 1). This supported the construction of a combined isotope chronology for both the northeastern Canada and western Argentina sites.
2.2 Modelling oxygen isotopes in tree ring cellulose with MAIDENiso
MAIDENiso is a process-based model that can simulate in parallel phenological and meteorological controls on photo-synthetic activity and carbon allocation (Danis et al., 2012). It explicitly allocates carbohydrates to different carbon pools (leaves, stem, storage and roots) on a daily basis using phe-nological stage-dependent rules (see Gennaretti et al., 2017a, for details on the construction of the main MAIDEN model). It also simulates the fractionation of carbon and oxygen iso-topes during growth processes. In particular, it estimates, at a daily time step, δ18O values of soil water and xylem wa-ter, the isotopic fractionation occurring in the leaves due to evapotranspiration and the biochemical fractionation during cellulose formation. As input it uses daily maximum and
15 20 25 30 35 1950 1960 1970 1980 1990 2000 2010 δ 18O TR Nothofagus pumilio Picea mariana
Figure 1. Tree ring δ18O time series (‰) at the three sites in Argentina (NUB, ALM and CHA in dark grey) and two sites in Québec (L01 and L20 in dark grey; single trees in light grey). The bold black lines are the averaged values. The mean inter-site corre-lation coefficients are r = 0.60, p< 0.05 and r = 0.80, p< 0.01 in the South and North American sites, respectively.
minimum temperature (◦C), precipitation (cm day−1), atmo-spheric CO2concentration (ppm) and δ18O values of precip-itation (δ18OPin ‰).
In this study, the calculation of the daily δ18OTR in tree ring cellulose (‰) is based on the Danis et al. (2012) formu-lation of the Craig–Gordon model (Craig and Gordon, 1965): δ18OTR=(1 − fo) · [ε∗+εk·(1 − hair) + hair·δ18OV
+(1 − hair) · δ18OXW] +fo·δ18OXW+ε0. (1) This equation summarizes how δ18OTRis determined by the following:
i. The δ18O of the source (xylem) water (δ18OXW), which is computed by averaging the δ18OSWvalues of the dif-ferent soil layers weighted by the volume of water taken up by the roots in each layer. The isotopic effects of wa-ter mixing and soil evaporation on the δ18OSW values of the different soil layers are computed by a mass and isotopic balance (Danis et al., 2012). It is worth noting that fractionation occurs neither during water uptake by roots (Wershaw et al., 1966) nor during the transport of water from the roots to the leaves.
ii. The18O enrichment of the leaf water due to transpira-tion is described by (ε∗+εk·(1−hair)+hair·δ18OV+(1− hair) · δ18OXW) after Craig and Gordon (1965), where
a. ε∗is the equilibrium fractionation due to the change of phase from liquid water to vapour at the leaf tem-perature (fixed at 21.4◦C, the temperature thresh-old for maximum carbon assimilation, ε∗is 9.65 ‰, Helliker and Richter, 2008);
b. εkis the kinetic fractionation due to the diffusion of vapour into unsaturated air through the stomata and the leaf boundary layer;
c. hair is the relative humidity of the evaporating air mass estimated from daily air temperature (Tair;◦C; mean of the maximum and minimum air tempera-tures), and the dew point temperature (Tr;◦C) (Run-ning et al., 1987);
d. δ18OV is the atmospheric water vapour calculated assuming a precipitation–vapour isotopic equilib-rium (see below).
iii. The biochemical fractionations (ε0) due to oxygen ex-change between carbonyl groups (C = O) in the organic molecules and water (DeNiro and Epstein, 1979; Far-quhar et al., 1998).
iv. The dampening factor foreflecting the exchange of the oxygen atoms between sucrose and xylem water during cellulose synthesis in the xylem cells of tree rings. As previously evoked (i), δ18OXW of Eq. (1) depends on δ18OSWand thus on δ18OPvalues. However, long continuous time series of δ18OP are not available in the studied area. Here, we tested the impact of using two different methods for deriving δ18OPtime series.
First, a linear model was used to estimate the daily val-ues of δ18OPand subsequently δ18OV based on the primary drivers of their temporal variability (Dansgaard, 1964; Horita and Wesolowski, 1994), which are air temperature (Tair;◦C) and precipitation at the corresponding site (P ; mm): δ18OP=a · Tair+b · P + c, (2) δ18OV=δ18OP−εT∗air, (3)
with ε∗
Tair the fractionation due to the change of phase from
liquid water to vapour at the mean air temperature. The coef-ficients a and b were allowed to vary over a plausible range (or prior range) in the calibration process together with other MAIDENiso parameters, while coefficient c was fixed to a likely value (see Table 1 and Sect. 2.4). This estimated set of data is referred to in the following as the estimated δ18OP dataset.
Second, we run the model with the series of the daily δ18OPderived from two general circulation models (GCMs) with different spatial resolutions and enough available data at our site locations: (1) the Melbourne University model (MUGCM; Noone and Simmonds, 2002) forced by varying sea surface temperature (SST) from the HadISST dataset for the 1950–2003 period (2◦×2◦resolution; hereafter referred to as the MUGCM δ18OP dataset), and (2) the Laboratoire de Météorologie Dynamique Zoom model (LMDZ5A; Hour-din et al., 2013; Risi et al., 2010) with the horizontal winds guided by those of the National Centers for Environmental Protection 20th Century Reanalysis (NCEP20) for the 1950– 2008 period (Compo et al., 2011) (2.5◦×3.75◦ resolution; hereafter referred to as the LMDZ-NCEP20 δ18OPdataset).
The final δ18OTRtime series are the annual average of the δ18OTRdaily values (Eq. 1) weighted by the daily simulated
Table 1. Definition of sensitive parameters. The posterior medians and 90 % confidence intervals are also shown. Arg.: Argentina; Q.: Québec.
Parameter Definition Unit Parameter type
(prior range)
Values with 90 % posterior confidence intervals
fo Dampening factor NA Calibrated (0.3 to 0.5) 0.36 [0.31; 0.46] (Arg.)
0.41 [0.32; 0.48] (Q.) ε0 Biochemical frac-tionation ‰ Calibrated (24 to 30) 29.99 [29.93; 30] (Arg.) 26.81 [24.74; 28.04] (Q.) εk Kinetic fractiona-tion ‰ Calibrated (10 to 30) 28.86 [18.25; 29.96] (Arg.) 17.20 [11.16; 26.34] (Q.) a Temperature de-pendence of δ18OP NA Calibrated (0.2 to 0.5 for
Arg. and 0 to 0.38 for Q.)
0.50 [0.49; 0.50] (Arg.) 0.31 [0.25; 0.37] (Q.)
b Precipitation
de-pendence of δ18OP
NA Calibrated (−0.3 to 0 for
Arg. and −0.39 to 0 for Q.)
−0.009 [−0.15; 0] (Arg.)
−0.22 [−0.35; −0.14] (Q.)
c Intercept of δ18OP ‰ Fixed −10.0 (Arg.)
−11.9 (Q.)
stand gross primary production (GPP), assuming a propor-tional allocation of carbon to the trunk. For the northeastern Canadian sites, the GPP simulated by MAIDENiso was op-timized using observations from an eddy covariance station (see Gennaretti et al., 2017a). Unfortunately, such observa-tions were not available for N. pumilio, and therefore the parameterization obtained for the GPP of P. mariana was also used for the western Argentinian sites but constrain-ing the simulations with phenological observations extracted from the literature. For example, to respect the annual cycle of the leaf area index (LAI) for N. pumilio (Magnin et al., 2014; Rusch, 1993), in MAIDENiso we used a seasonal LAI annual cycle with a development of leaves (LAI increase) between October and November, a maximum LAI (set at 5 leaf area/ground area) from November to April, a decreasing LAI (leaf fall) between April and May, and finally a leaf-less period (null LAI) from June to September (Magnin et al., 2014; Rusch, 1993). Furthermore, based on the finding that δ18OTR annual time series were more correlated with climate variables of specific months of the growing season (Lavergne et al., 2016), we also computed δ18OTR annual values by weighting the δ18OTR daily values (Eq. 1) with synthetic GPP time series maximizing the correspondence between observations and simulations.
2.3 Meteorological and atmospheric CO2data
At the western Argentinian sites, we did not have long daily records of observed climate data. Therefore, daily minimum– maximum temperature and precipitation data were derived from the 20th Century Reanalysis V2c (2◦×2◦ resolution; Compo et al., 2011), which is one of the few reanalysis prod-ucts entirely covering the 20th century. The temperature daily time series of the reanalysis were corrected in order to respect
the monthly mean values detected at Bariloche, the near-est meteorological station from our sampling sites (∼ 48 km from the sites; 41◦120S–71◦120W; 840 m a.s.l.; Servicio Me-teorológico Nacional, Argentina). The resulting maximum and minimum temperature series, covering the 1952–2011 period, fit well with the daily local temperature data from La Almohadilla (ALM) site (41◦110S, 71◦470W; 1410 m a.s.l.; data measured by data loggers and provided by IANIGLA) available over the 2002–2012 period (r = 0.74, p< 0.001; Fig. S1 in the Supplement). For the northeastern Canadian sites, climate data were obtained from the gridded interpo-lated Canadian database of daily minimum–maximum tem-perature and precipitation covering the 1950–2005 studied period (0.08◦×0.08◦resolution; Hutchinson et al., 2009). In addition to these data we also used modelled daily data from the GCMs described above for both the western Argentinian and northeastern Canadian sites (see Table 2 with the input data used for each tested configuration).
Data on the atmospheric CO2concentration were derived from the Mauna Loa station over the 1958–2012 period (Keeling et al., 1976). For the years 1950–1957, we extrap-olated atmospheric CO2 data using the trend and seasonal cycle as displayed in the observations over the subsequent 10-year period (1958–1967).
2.4 Estimation of parameters influencing δ18OTR
We used a Bayesian method for the simultaneous calibra-tion of the various MAIDENiso parameters specific to the study species and site. A set of 50 plausible blocks of param-eters (posterior values) was selected according to the method described in Gennaretti et al. (2017a) using Markov chain Monte Carlo (MCMC) sampling (Table 1). The following prior plausible ranges were considered:
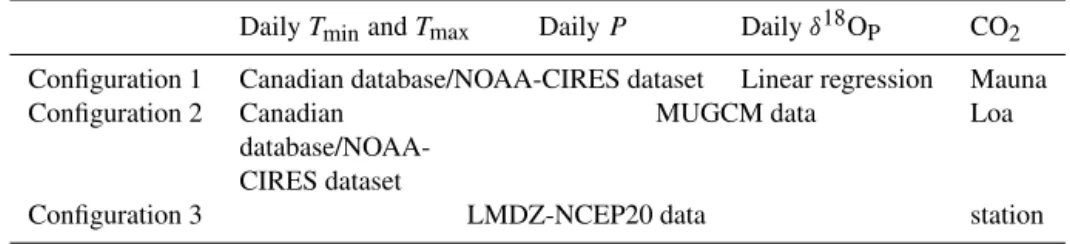
Table 2.Climate input data for all tested simulations.
Daily Tminand Tmax Daily P Daily δ18OP CO2
Configuration 1 Canadian database/NOAA-CIRES dataset Linear regression Mauna
Configuration 2 Canadian
database/NOAA-CIRES dataset
MUGCM data Loa
Configuration 3 LMDZ-NCEP20 data station
1. The prior ranges of the a and b coefficients in the equa-tion of the daily δ18OP(Eq. 2) were selected in order to get δ18OPvalues for each site consistent with the mea-sured monthly local values from the nearest stations of the Global Network of Isotopes in Precipitation (GNIP), and with the simulated daily values from the LMDZ-NCEP20 model and from the MUGCM model (see Ta-ble 1).
2. The range for the biochemical fractionation factor ε0 was chosen between 24 and 30 ‰ (+27 ± 3 ‰ after DeNiro and Epstein, 1981; Sternberg, 1989; Yakir and DeNiro, 1990).
3. The range for the kinetic fractionation εk, which has been set to 26.5 ‰ in Farquhar et al. (1989) but that can vary over larger ranges (Buhay et al., 1996), was taken between 10 and 30 ‰ here.
4. The range for the dampening factor fowas allowed to vary between 0.3 and 0.5 following Saurer et al. (1997). We tested the sensitivity of the MAIDENiso model to the calibrated parameters by modifying them within their respec-tive prior calibration range. To control the robustness of the calibrated parameters, we performed the calibration of these parameters over two equal length intervals (1950–1977 and 1978–2005 for P. mariana; 1952–1981 and 1982–2011 for N. pumilio) keeping the second half for independent valida-tion of the parameter estimates. Once the model was cali-brated for the two species, the MAIDENiso model’s perfor-mance to simulate P. mariana and N. pumilio δ18OTR inter-annual data was evaluated using the correlation coefficients (r) and the root mean square errors (RMSEs) between ob-served and simulated values. This is a standard approach to evaluate how well a mechanistic model is simulating δ18OTR variations (e.g., Danis et al., 2012; Lorrey et al., 2016).
2.5 Disentangling leaf-level fractionation processes and source water influences on δ18OTRsignature
To define the relative contributions to the δ18OTRsignature of the isotopic signal of the source water (xylem water) and of the fractionation processes due to transpiration taking place in the leaves, we designed two experimental simulations with MAIDENiso based on Eq. (1):
1. To quantify the influence of the variability in the iso-topic composition of the xylem water on δ18OTR, we compared the reference simulations to those where the relative humidity (hair) and the isotopic composition of atmospheric vapour (δ18OV) were assumed to be con-stant. The constant values for hair and δ18OVwere de-fined as the averages of the respective MAIDENiso outputs (hair=0.62 and 0.9, and δ18OV= −26.28 and −17.34 ‰, respectively, for northeastern Canada and western Argentina; the XW source experiment simula-tion hereafter),
2. To quantify the influence of the isotopic enrichment of the leaf water due to transpiration on δ18OTR, we compared the reference simulations to those where the δ18OXW series were assumed to be constant. The con-stant value for δ18OXWwas estimated as the average of the δ18OXW MAIDENiso outputs (δ18OXW= −13.81 and −7.03 ‰, respectively, for northeastern Canada and western Argentina; the leaf water enrichment-driven ex-periment simulation hereafter).
Comparison between the experimental and reference sim-ulations (i.e. using the optimal values of the parameters) was achieved through the calculation of the coefficient of deter-mination (R2).
3 Results
3.1 Estimated versus modelled and observed δ18OP
values
The modelled δ18OPseries from the GCMs are similar to the GNIP datasets, with mean values ranging from −12 to −8 ‰ over June–September in northeastern Canada (Fig. S2a) and from −7 to −3 ‰ over December–April at the western Ar-gentinian sites (Fig. S2b). In general, δ18OP series from LMDZ-NCEP20 model in western Argentina are slightly dis-placed toward higher values (+1 ‰) in comparison with the GNIP and MUGCM data. The estimated δ18OPvalues based on plausible values of coefficients a and b agree well with those of the models and observations in northeastern Canada. For the western Argentinian sites, they are 2–3 ‰ lower from April to October, i.e. late spring–early autumn (Fig. S2).
(a) 0.30 0.50 0.0 0.2 0.4 R (b) 18 24 30 0.0 0.2 0.4 Mean le vels a 0.30 0.50 −0.4 −0.2 0.0 R 18 24 30 −0.4 −0.2 0.0 Mean le vels b 0.30 0.50 0.30 0.40 0.50 R 18 24 30 0.30 0.40 0.50 Mean le vels fo 0.30 0.50 24 26 28 30 R 18 24 30 24 26 28 30 Mean le vels ε0 0.30 0.50 10 15 20 25 30 R 18 24 30 10 15 20 25 30 Mean le vels εk
Figure 2.Dependence of the correlation coefficients between
ob-served and simulated δ18OTRseries (a) and of the mean simulated
δ18OTRlevels (‰) (b) as a function of the range of calibrated
pa-rameters a, b, fo, ε0and εkfor the 50 simulations performed. The
tests sites from Québec are in black and the Argentinean ones are in red. The vertical lines are the values of a plausible block of param-eters retained in the MCMC optimization. The horizontal dashed lines are their respective 90 % confidence interval calculated with 50 simulations (see Table 1). The horizontal dot lines in (b) are the
mean values of the observed δ18OTR.
3.2 Sensitivity of the model to the calibrated parameters
Most of the calibrated parameters have an influence on the correlations between observed and simulated δ18OTRseries and/or on the mean levels of the simulated series (Fig. 2). The temperature and precipitation dependences of δ18O
P values (respectively a and b coefficients) have the strongest influ-ence on correlations. Increasing a and b values increase the mean δ18OTRlevels, more strongly in western Argentina than in northeastern Canada (Fig. 2). Changes in the dampening factor (fo) and in the biochemical fractionation (ε0) have al-most no effect on correlation, but their increase induces sig-nificant decrease of the mean levels of δ18OTRseries. Finally, increasing the kinetic fractionation (εk) leads to lower corre-lations and to higher mean levels of δ18OTR(Fig. 2).
19 21 23 δ 18O TR r = 0.56 ** 0 2 4 6 GPP 19 21 23 δ 18O TR r = 0.62 ** 0 2 4 6 GPP 28 30 32 δ 18O TR r = 0.48 ** 0 2 4 6 GPP 28 30 32 1950 1960 1970 1980 1990 2000 2010 δ 18O TR r = 0.52 ** Year 0 2 4 6 GPP 0 200 DOY (a) (b) (c) (d)
Figure 3.Comparison between observed (red or green) and
sim-ulated (grey) δ18OTRchronologies in Québec (a and b) and
Ar-gentina (c and d), respectively, using GPP (in g C m−2day−1)
sim-ulated by MAIDENiso for each day of the year (DOY) (a and c) or synthetized for maximizing correlations (b and d). The simulations
are based on estimated δ18OPseries. The 50 different simulations
inferred from the Markov chain Monte Carlo (MCMC) chains are in dark grey. The ±1 root mean square error (RMSE) range is repre-sented in light grey. The mean correlation coefficients are significant
at 99 % level (∗∗).
3.3 MAIDENiso performance in reproducing observed
δ18OTRseries
Split-period verifications of the calibrated relationships for P. marianaand N. pumilio when using estimated δ18OP series from Eq. (2) indicate that the calibration over either the first-half or the second-first-half periods provides similar posterior densities of the calibrated parameters than the ones obtained when calibrating over the whole periods (Fig. S3). One ex-ception is observed in the calibration of coefficient a in north-eastern Canada over the two half periods, where the posterior densities of a are different from the one obtained by calibrat-ing over the entire period. Over the entire periods, observed and simulated δ18OTR series are significantly correlated in northeastern Canada (r = 0.56, p< 0.01 and RMSE = 0.67; Fig. 3a) and in western Argentina (r = 0.48, p< 0.01 and RMSE = 0.63; Fig. 3c). The correlations between observed and simulated δ18OTRseries are slightly improved when we used synthetic daily GPP (r = 0.62 and r = 0.52, p< 0.01, respectively, for northeastern Canada and western Argentina; Fig. 3b and d). It is worth noting that the mean levels of the simulated δ18OTRseries for the Argentinian sites are lower than those of the observations (offset of around −2.5 ‰; Fig. S4). The series were therefore corrected to respect the mean values detected in the observations (Fig. 3c and d). In
0 20 40 60 80 100 0.0 0.2 0.4 0.6 0.8 1.0
Kernel density estimates
R Estimated_Quebec MUGCM_Quebec LMDZ-NCEP20_Quebec Estimated_Argentina MUGCM_Argentina LMDZ-NCEP20_Argentina
Figure 4.Density distributions of the coefficient of correlation (R)
between observed and simulated δ18OTRchronologies in Québec
and Argentina when the simulations are based on δ18OPseries
es-timated by the regression model or from the MUGCM and LMDZ-NCEP20 models.
contrast, the correlations between observation and simulation considerably decrease when we used modelled δ18OP from MUGCM models or LMDZ-NCEP20 reanalysis data. They only reach r = 0.13 (p> 0.05) to 0.23 (p< 0.05) in north-eastern Canada and r = 0.23 to 0.26 (p< 0.05) in western Argentina, respectively (Fig. 4).
3.4 Influence of source water and leaf water isotopic enrichment to the δ18OTRsignature
The relative contributions to the δ18OTR signature of the isotopic signal of the source (xylem) water and of the 18O enrichment of the leaf water due to transpiration were in-vestigated. In both regions, the leaf water enrichment ex-perimental simulations and the reference simulations have a higher correlation coefficient (R2centred on 0.9 and 0.95, re-spectively, for northeastern Canada and western Argentina; Fig. 5) than are the XW source simulations with the refer-ence simulations (R2centred on 0.65 and 0.8, respectively, for northeastern Canada and western Argentina). This sug-gests that, with the model, the variability in δ18OXW has a weaker influence on δ18OTR variations than the changes of the leaf water isotopic enrichment do. Notably, P. mariana in northeastern Canada appears to be more sensitive to both influences than N. pumilio in western Argentina (Fig. 5).
4 Discussion
4.1 Precipitation δ18OPvariations and estimation
Although the regression models used to predict daily δ18OP values are likely too simplistic, the resultant monthly av-eraged values adequately reproduce the distribution of the observed (from GNIP stations) and modelled (by GCMs)
0 5 10 15 0.0 0.2 0.4 0.6 0.8 1.0 XW_source Leaf_water_enrichment_driven Quebec Argentina R2
Kernel density estimates
Figure 5.Density distributions of the coefficients of determination
(R2) between the reference simulations and the (1) XW source
ex-periment simulation (δ18OV and hair set as constant, black) and
(2) leaf water enrichment-driven experiment simulation (δ18OXW
set as constant, green) in Québec (bold line) and Argentina (dashed line).
monthly δ18OPseries in northeastern Canada. In western Ar-gentina, the distribution of monthly δ18OPvalues is also well reproduced but the amplitude of variation in the predicted values is too high, leading to simulated values lower than the measured ones during the colder months. The tempo-ral δ18OPvariations are positively related to air temperature given the positive coefficient a. In agreement with the simple Rayleigh distillation model (Dansgaard, 1964), as air temper-ature decreases, the specific humidity at saturation decreases, and water vapour condenses. H182 O condenses preferentially, and the residual water vapour becomes more and more de-pleted as condensation proceeds. Consequently, in the trop-ics, the18O /16O ratio in the meteoric water has been ob-served to decrease with increasing amount of precipitation and/or relative humidity (Rozanski et al., 1993). In extra-tropical regions, δ18OPmay also correlate with precipitation amount (negative coefficient b), since both variables depend on the meteorological conditions.
The results of the linear regressions show comparatively lower influence of precipitation on δ18OP in western Ar-gentina than in northeastern Canada (Table 1). This suggests that the imprint of the precipitation amount on δ18OPin west-ern Argentina is low and that δ18OP variations are mainly controlled by seasonal changes in temperature, which is in agreement with previous work (Rozanski et al., 1995). How-ever, due to the strong west-to-east precipitation gradient in this region (orographic rain shadow), large δ18OP variations occur over short distances (Rozanski et al., 1995; Smith and Evans, 2007; Stern and Blisniuk, 2002). Therefore, the daily precipitation dataset extracted from the gridded reanalysis data, which has a low spatial resolution (> 200 km), may not represent the daily variations in precipitation at a local scale
faithfully. Therefore, the model may underestimate the con-tribution of precipitation on δ18OPvariability in this particu-lar area.
In contrast, in northeast Canada, both temperature and pre-cipitation amount equally control the δ18OP variations. The high amount of precipitation falling in summer (∼ 46 %) should have a strong effect and decrease the δ18OP values in the condensed water, while high temperatures counteract this effect by increasing this ratio. Before reaching northeast-ern Canada, the air masses pushed by the dominant westerly winds discharge most of their humidity over the land, lead-ing to a depleted δ18OPsignal at our sites (for the same rea-son, δ18OTRvalues at L20, which is located 110 km north-east of L01, are ∼ 1 ‰ lower). Moreover, the δ18OP signal in the Canadian sites is comparatively more depleted than in the Argentinian sites, because of their higher latitude. It is worth noting that the resolution of the gridded meteoro-logical dataset used for the Canadian sites is relatively high (∼ 10 km), which means that the local processes are likely well represented.
4.2 Relative performance in modelling δ18OTRvalues
The simulated δ18OTRseries based on daily δ18OPestimation from the regression models reproduce the observations bet-ter than the ones based on δ18OPvalues derived from GCMs (Fig. 4). This is in part due to the greater number of param-eters to optimize, as the calibration process can more easily find a solution that fits the observations better. This may how-ever reflect error compensations especially in western Ar-gentina where the estimated annual variability in δ18OPis too large. Conversely, in northeastern Canada, the annual varia-tions in δ18OP that are estimated, simulated by GCMs and observed are in good agreement (Fig. S2). Although isotope-enabled atmospheric global models can reproduce the mean annual precipitation isotopic values and seasonality for many areas (Risi et al., 2010), results at specific sites, especially in mountainous regions such as at our western Argentinian site, can be less accurate (Fig. S2; see the offset between GNIP stations and LMDZ-NCEP20). Ideally, daily δ18OP long-term records from meteorological stations in the study re-gion should be used as an input of MAIDENiso. Simulations from high-resolution regional circulation models, such as REMOiso, which has a 0.5◦×0.5◦(∼ 55 km) horizontal res-olution (Insel et al., 2013; Sturm et al., 2005, 2007), may pro-duce reliable local δ18OPvalues. Such a dataset has proven to be quite helpful with MAIDENiso in the Fontainebleau forest (France) (Danis et al., 2012). However, up to now, measured or REMOiso δ18OP datasets in our regions of study do not exist, which is the case for most regions of the world. More-over, early data (1970–1980s) from GNIP stations may have been compromised by pan evaporation and therefore isotopic enrichment. Therefore, we recommend that daily GNIP sta-tions are set up in various forested ecosystems, that an effort is accomplished to homogenize older GNIP time series, and
that high-resolution simulations of δ18OP are performed in wider regions.
The modelling of δ18OTRvalues based on the estimation of δ18OPis relatively more accurate for northeastern Canada than for western Argentina (Fig. 3). As the mean levels of the measured δ18OTRvalues are high at the western Argen-tinian sites (mean value of about 30 ‰ ), the Bayesian op-timization tends to increase the biochemical (ε0) and kinetic (εk) fractionations as well as the coefficient a, while reducing the dampening factor (fo) to reach more representative mean levels of the δ18OTRsimulation. But still, these levels are too low in comparison with the observations (about 2.5 ‰ lower; Fig. S4). When the posterior value of a calibrated parameter is limited to the upper bound of the prior range of plausible values, as it is the case at the western Argentinian sites for a, band ε0(Fig. S3), it means that either the prior range is too narrow, the model is inadequate, or some important process is not considered in the model. Here, the estimation of the prior ranges of both coefficients a and b were based on ob-served (GNIP stations) and simulated (GCMs) δ18OPvalues. Therefore, we expect their respective ranges to be consistent with local processes. When the prior range of a is extended to higher values in the optimization process, observed and simulated δ18OTRmean levels in western Argentina are bet-ter matching. However, in this case, the distribution of δ18OP values is shifted toward higher values, advocating for unreal-istic estimated δ18OPvariations.
One other possibility is that the prior range of ε0is too nar-row. In accordance with DeNiro and Epstein (1981), Stern-berg (1989) and Yakir and DeNiro (1990), the biochemi-cal fractionation ε0is assumed here to be lower than 30 ‰. However, a recent study has demonstrated that this parame-ter, nearly constant between 20 to 30◦C, increases at lower temperatures to values of 31 ‰ (Sternberg and Ellsworth, 2011). During the growing season, maximum temperatures can reach 20◦C in western Argentina and 30◦C in northeast-ern Canada, which suggests that the high mean δ18OTRlevels in N. pumilio may be due to biochemical fractionation higher than 30 ‰ due to temperature generally lower than 20◦C. However, when the prior range of ε0 is extended to 31 ‰ in the optimization process, the mean δ18OTR levels of N. pumilioare still too low in comparison with the observations. These results advocate for the existence of other processes, which can explain this offset in mean levels in Argentina. For example, higher soil water evaporation than modelled by MAIDENiso should lead to less negative δ18OSW (and therefore δ18OXW), which could explain the high mean lev-els of δ18OTRin Argentina. Caution should be exercised with such an interpretation since other species living in similar conditions as N. pumilio in western Argentina show com-paratively lower mean δ18OTRlevels than N. pumilio (i.e., Fitzroya cupressoides; see Lavergne et al., 2016). The on-going monitoring and evaluation of isotopic processes based on synchronous measurements of vapour, precipitation, soil water and xylem water will certainly help understanding the
high mean levels observed in Argentina, as well as increasing the representation of the involved processes in MAIDENiso. The better fit between observed and simulated δ18OTR val-ues obtained with specific forms of synthetic distributions of daily GPP for northeastern Canada and western Argentina (Fig. 3) suggests differential limiting factors in the two re-gions. The synthetic bimodal distribution of daily GPP with maxima in spring and autumn, as simulated in western Ar-gentina, is often observed in a diversity of ecosystems such as in the Mediterranean environments (Baldocchi et al., 2010; Gea-Izquierdo et al., 2015). After the activation of the pho-tosynthesis in early spring, increasing temperatures tend to be optimal for tree growth. However, in a modelling study, Lavergne et al. (2015) have shown that the influence of tem-perature on N. pumilio’s growth becomes negative once a temperature threshold (soil moisture) is exceeded. Therefore, we assume that after reaching a threshold of temperature and soil moisture summer conditions, tree growth is inhibited, leading to a decrease of primary productivity. However, when temperature starts to decline and soil water supply tends to increase with increasing precipitation events, tree growth in-creases again until the end of the growing season. In contrast, because precipitation is more abundant in summer (June to September) in northeastern Canada (Naulier et al., 2014), high summer temperatures should be always beneficial to tree growth if enough soil water is available. Therefore, in agreement with GPP-derived eddy covariance data from the Fluxnet network (see Gennaretti et al., 2017a), a better fit be-tween observations and simulations is observed when using a unimodal rather than a bimodal GPP distribution. Monitor-ing of tree physiology, environmental conditions and wood cell formation will provide a more detailed representation of the complex biological and ecological processes operating in Patagonia, allowing us to run the MAIDENiso model with better constraints.
4.3 What is the main origin of the temperature signal recorded in δ18OTR?
The investigation of the relative contributions of the isotopic composition of the source (xylem) water and of the 18O enrichment of the leaf water by transpiration on the simu-lated δ18OTR reveals that the variability in the former has a weaker influence on δ18OTR variations than that of the latter in North and South America. Therefore, the temper-ature signal recorded in δ18OTR series more likely reflects the effect of temperature on isotopic enrichment of the leaf water rather than on the isotopic composition of the source water. At the leaf level, air temperature has a strong effect on the relative humidity and therefore on the vapour pres-sure deficit (VPD), i.e. the difference between the saturation vapour pressure and the actual vapour pressure, which mod-ulates the transpiration (Barbour, 2007). Thus, the imprint of the ambient air temperature on the fractionation processes occurring during transpiration is preferentially recorded in
the tree rings of the two species. Furthermore, both the iso-topic signature of the xylem water and of the fractionation processes occurring at the evaporation sites of the leaves have comparatively higher influence on δ18OTR in P. mariana than in N. pumilio. This is probably due to the lower ampli-tude of the day-by-day variations in the relative humidity in western Argentina (SD = 5 %) versus in northeastern Canada (SD = 16 %), which translates into a weaker influence of hair variations and therefore of leaf-level isotopic fractionation processes on δ18OTR values in western Argentina than in northeastern Canada. These results highlight the potential of MAIDENiso model to better refine the origin of the climatic signal recorded in the oxygen isotopic signature in the tree rings of different species.
5 Conclusions
Here, by using MAIDENiso model, we have provided a mechanistic overview of the climatic and biological pro-cesses controlling oxygen isotopic fractionation in two North and South American temperature-sensitive tree species. First, we have shown that using regression-based rather than model-based δ18OP estimates as inputs increases the pre-dictive skills of our simulations, although this may be at the price of error compensations. Second, our study reveals that the variability in the isotopic composition of the source (xylem) water has a weaker influence on δ18OTRvariations than that of the18O enrichment of the leaf water by transpira-tion. Last, these findings suggest that the imprint of temper-ature recorded in δ18OTRof the two species is likely related to the effect of temperature on isotopic enrichment of the leaf water. The isotopic monitoring of water within the soil– vegetation–atmosphere compartments in future work will certainly provide the input and control data necessary to better constrain MAIDENiso. Our study demonstrates that the eco-physiological modelling of δ18OTRvalues is neces-sary and likely the only approach to accurately interpret the recorded climate signal. Based on the calibrations of MAID-ENiso presented here, the next step involves inverse mod-elling approaches to perform palaeoclimatic reconstructions in North and South America that are less biased by the com-plex and nonlinear interactions between climate, CO2 con-centrations and tree growth as recommended by Boucher et al. (2014).
Code and data availability. The code of the model can be found at https://doi.org/10.6084/m9.figshare.5446435.v1 (recent version
developed by Gennaretti et al., 2017). The daily δ18OP data
from the MUGCM model were extracted via the SWING project webpage (SWING project, http://paos.colorado.edu/~dcn/SWING/ database.php). The daily climatic data used for Québec were re-trieved from the webpage of the Natural Resources Canada prod-ucts (Natural Resources Canada, http://cfs.nrcan.gc.ca/projects/3/ 4), while those for Argentina were extracted from the Earth
Sys-tem Research Laboratory (ESRL) of the National Oceanic & Atmo-spheric Administration (ESRL-NOAA) webpage (ESRL-NOAA, 20th Century Reanalysis V2c, https://www.esrl.noaa.gov/psd/data/
gridded/data.20thC_ReanV2c.html). The atmospheric CO2
concen-tration data derived from the Mauna Loa station were extracted from the ESRL-NOAA webpage (ESRL-NOAA, Mauna Loa data, http://www.esrl.noaa.gov/gmd/ccgg/trends/).
The Supplement related to this article is available online at https://doi.org/10.5194/cp-13-1515-2017-supplement.
Competing interests. The authors declare that they have no con-flict of interest.
Acknowledgements. This study has been co-funded by the
research federation ECCOREV. Aliénor Lavergne has been sup-ported by a research associate/lecturer position at the Aix-Marseille University (France). Fabio Gennaretti has received funding from the European Union’s Horizon 2020 research and innovation program under the Marie Sklodowska-Curie grant agreement no. 656896. We acknowledge all data providers: the Instituto Argentino de Nivología, Glaciología y Ciencias Ambientales (IANIGLA, Argentina) for providing the daily temperature data from La Almohadilla site; the National Meteorological Service from Argentina for providing the monthly temperature data from Bariloche meteorological station (Argentina); the Department of Natural Resources Canada for providing the daily climatic data used for Québec; the US Department of Energy, Office of Science Biological and Environmental Research (BER) and the National Oceanic and Atmospheric Administration Climate Program Office for providing the daily climatic data used for Argentina; and the
SWING project for providing the daily δ18OPdata from MUGCM
model.
Edited by: Laurie Menviel
Reviewed by: two anonymous referees
References
Baldocchi, D. D., Ma, S., Rambal, S., Misson, L., Ourcival, J. M., Limousin, J. M., Pereira, J., and Papale, D.: On the differential advantages of evergreenness and deciduousness in mediterranean oak woodlands: A flux perspective, Ecol. Appl., 20, 1583–1597, https://doi.org/10.1890/08-2047.1, 2010.
Barbour, M. M.: Stable oxygen isotope composition of
plant tissue: a review, Funct. Plant Biol., 34, 83–94, https://doi.org/10.1071/FP06228, 2007.
Barbour, M. M., Cernusak, L. A., and Farquhar, G. D.: Factors af-fecting the oxygen isotope ratio of plant organic material, in: Sta-ble isotopes and biosphere-atmosphere interactions: Processes and Biological Controls, edited by: Flanagan, L. B., Ehleringer, J. R., and Pataki, D. E., Elsevier, Amsterdam, 9–28, 2005.
Boucher, É., Guiot, J., Hatté, C., Daux, V., Danis, P.-A., and Dussouillez, P.: An inverse modeling approach for tree-ring-based climate reconstructions under changing
atmo-spheric CO2 concentrations, Biogeosciences, 11, 3245–3258,
https://doi.org/10.5194/bg-11-3245-2014, 2014.
Brienen, R. J. W., Helle, G., Pons, T. L., Guyot, J.-L., and Gloor, M.: Oxygen isotopes in tree rings are a good proxy for Amazon precipitation and El Niño-Southern Oscillation variability, Proc. Natl. Acad. Sci. USA, 109, 16957–16962, https://doi.org/10.1073/pnas.1205977109, 2012.
Buhay, W. M., Edwards, T. W. D., and Aravena, R.: Evaluating kinetic fractionation factors used for reconstructions from ox-gen and hydroox-gen isotope ratios in plant water and cellulose, Geochem. Geophy. Geosy., 60, 2209–2218, 1996.
Cernusak, L. A. and English, N. B.: Beyond tree-ring
widths: stable isotopes sharpen the focus on climate re-sponses of temperate forest trees, Tree Physiol., 35, 1–3, https://doi.org/10.1093/treephys/tpu115, 2015.
Compo, G. P., Whitaker, J. S., Sardeshmukh, P. D., Matsui, N., Al-lan, R. J., Yin, X., Gleason, B. E., Vose, R. S., Rutledge, G., Bessemoulin, P., BroNnimann, S., Brunet, M., Crouthamel, R. I., Grant, A. N., Groisman, P. Y., Jones, P. D., Kruk, M. C., Kruger, A. C., Marshall, G. J., Maugeri, M., Mok, H. Y., Nordli, O., Ross, T. F., Trigo, R. M., Wang, X. L., Woodruff, S. D., and Worley, S. J.: The twentieth century reanalysis project, Q. J. Roy Meteor. Soc., 137, 1–28, https://doi.org/10.1002/qj.776, 2011.
Craig, H. and Gordon, L. I.: Deuterium and oxygen 18 variations in the ocean and the marine atmosphere, Spoleto, 1965.
Danis, P. A., Hatté, C., Misson, L. and Guiot, J.: MAIDENiso: a multiproxy biophysical model of tree-ring width and oxy-gen and carbon isotopes, Can. J. Forest Res., 42, 1697–1713, https://doi.org/10.1139/x2012-089, 2012.
Danis, P. A., Masson-Delmotte, V., Stievenard, M., Guillemin, M. T., Daux, V., Naveau, P., and von Grafenstein, U.:
Reconstruction of past precipitation δ18O using tree-ring
cellulose δ18O and δ13C: A calibration study near Lac
d’Annecy, France, Earth Planet. Sc. Lett., 243, 439–448, https://doi.org/10.1016/j.epsl.2006.01.023, 2006.
Dansgaard, W.: Stable isotopes in precipitation, Tellus A, 16, 436– 468, https://doi.org/10.3402/tellusa.v16i4.8993, 1964.
DeNiro, M. J. and Epstein, S.: Relationship between the oxygen isotope ratios of terrestrial plant cellulose, carbon dioside, and water, Science, 204, 51–53, 1979.
DeNiro, M. J. and Epstein, S.: Isotopic composition of cellulose from aquatic organisms, Geochim. Cosmochim. Ac., 45, 1885– 1894, https://doi.org/10.1016/0016-7037(81)90018-1, 1981. Donoso, C.: Tipos forestales de los bosques nativos de Chile.,
Doc-umento de Trabajo Nu. 38, Investigación y Desarrollo Forestal (CONAF, PNUD-FAO), FAO Chile, 1981.
ESRL-NOAA: 20th Century Reanalysis V2c, https://www.esrl. noaa.gov/psd/data/gridded/data.20thC_ReanV2c.html, last ac-cess: March 2017.
ESRL-NOAA: Mauna Loa data, http://www.esrl.noaa.gov/gmd/ ccgg/trends/, last access: March 2017.
Farquhar, G. D., Hubick, H. T., Condon, A. G., and Richards, R. A.: Carbon isotope fractionation and plant water-use efficiency, in: Stable isotopes in ecological research, 21–40, 1989.
Farquhar, G. D., Barbour, M. M., and Henry, B. K.: Interpretation of oxygen isotope composition of leaf material, in Stable isotopes:
integration of biological, ecological and geochemical processes, BIOS Scientific Publishers, Oxford, 27–61, 1998.
Gea-Izquierdo, G., Guibal, F., Joffre, R., Ourcival, J. M., Simioni, G., and Guiot, J.: Modelling the climatic drivers determining photosynthesis and carbon allocation in evergreen Mediterranean forests using multiproxy long time series, Biogeosciences, 12, 3695–3712, https://doi.org/10.5194/bg-12-3695-2015, 2015. Gennaretti, F., Arseneault, D., Nicault, A., Perreault, L.,
and Bégin, Y.: Volcano-induced regime shifts in
mil-lennial tree-ring chronologies from northeastern North
America, Proc. Natl. Acad. Sci. USA, 111, 10077–10082, https://doi.org/10.1073/pnas.1324220111, 2014.
Gennaretti, F., Gea-Izquierdo, G., Boucher, E., Berninger, F., Arse-neault, D., and Guiot, J.: Ecophysiological modeling of photo-synthesis and carbon allocation to the tree stem in the boreal for-est, Biogeosciences, 14, 4851–4866, https://doi.org/10.5194/bg-14-4851-2017, 2017a.
Gennaretti, F., Huard, D., Naulier, M., Savard, M., Bégin, C., Ar-seneault, D., and Guiot, J.: Bayesian multiproxy temperature reconstruction with black spruce ring widths and stable iso-topes from the northern Quebec taiga, Clim. Dynam., 1–13, https://doi.org/10.1007/s00382-017-3565-5, 2017b.
Gessler, A., Ferrio, J. P., Hommel, R., Treydte, K., Werner, R. A., and Monson, R. K.: Stable isotopes in tree rings: towards a mech-anistic understanding of isotope fractionation and mixing pro-cesses from the leaves to the wood, Tree Physiol., 1–23, 2014. Guiot, J., Boucher, E., and Gea-Izquierdo, G.: Process models and
model-data fusion in dendroecology, Front. Ecol. Evol., 2, 1–12, https://doi.org/10.3389/fevo.2014.00052, 2014.
Hartl-Meier, C., Zang, C., Büntgen, U. L. F., Esper, J. A. N., Rothe, A., Göttlein, A., Dirnböck, T., and Treydte, K.: Uniform climate sensitivity in tree-ring stable isotopes across species and sites in a mid-latitude temperate forest, Tree Physiol., 2003, 4–15, https://doi.org/10.1093/treephys/tpu096, 2014.
Helliker, B. R. and Richter, S. L.: Subtropical to boreal con-vergence of tree-leaf temperatures, Nature, 454, 511–514, https://doi.org/10.1038/nature07031, 2008.
Horita, J. and Wesolowski, D. J.: Liquid-vapor fractionation of oxy-gen and hydrooxy-gen isotopes of water from the freezing to the critical temperature, Geochim. Cosmochim. Ac., 58, 3425–3437, https://doi.org/10.1016/0016-7037(94)90096-5, 1994.
Hourdin, F., Grandpeix, J. Y., Rio, C., Bony, S., Jam, A., Cheruy, F., Rochetin, N., Fairhead, L., Idelkadi, A., Musat, I., Dufresne, J. L., Lahellec, A., Lefebvre, M. P., and Roehrig, R.: LMDZ5B: The atmospheric component of the IPSL climate model with re-visited parameterizations for clouds and convection, Clim. Dy-nam., 40, 2193–2222, https://doi.org/10.1007/s00382-012-1343-y, 2013.
Hutchinson, M. F., McKenney, D. W., Lawrence, K., Pedlar, J. H., Hopkinson, R. F., Milewska, E., and Papadopol, P.: Devel-opment and testing of Canada-wide interpolated spatial mod-els of daily minimum-maximum temperature and precipita-tion for 1961–2003, J. Appl. Meteorol. Clim., 48, 725–741, https://doi.org/10.1175/2008JAMC1979.1, 2009.
Insel, N., Poulsen, C. J., Sturm, C., and Ehlers, T. A.:
Climate controls on Andean precipitation δ18O
interan-nual variability, J. Geophys. Res.-Atmos., 118, 9721–9742, https://doi.org/10.1002/jgrd.50619, 2013.
Kahmen, A., Sachse, D., Arndt, S. K., Tu, K. P., Farrington,
H., Vitousek, P. M., and Dawson, T. E.: Cellulose δ18O is an
index of leaf-to-air vapor pressure difference (VPD) in trop-ical plants., Proc. Natl. Acad. Sci. USA, 108, 1981–1986, https://doi.org/10.1073/pnas.1018906108, 2011.
Keeling, C. D., Bacastow, R. B., Bainbridge, A. E., Ek-dahl Jr., C. A., Guenther, P. R., Waterman, L. S., and Chin, J. F. S.: Atmospheric carbon dioxide variations at Mauna Loa Observatory, Hawaii, Tellus A, 28, 538–551, https://doi.org/10.3402/tellusa.v28i6.11322, 1976.
Labuhn, I., Daux, V., Girardclos, O., Stievenard, M., Pierre, M., and Masson-Delmotte, V.: French summer droughts since 1326 CE: a
reconstruction based on tree ring cellulose δ18O, Clim. Past, 12,
1101–1117, https://doi.org/10.5194/cp-12-1101-2016, 2016. Lavergne, A., Daux, V., Villalba, R., and Barichivich, J.:
Tempo-ral changes in climatic limitation of growth at upper tree-line forests: Contrasted responses along the west-to-east humid-ity gradient in Northern Patagonia, Dendrochronologia, 36, 49– 59, 2015.
Lavergne, A., Daux, V., Villalba, R., Pierre, M., Stievenard, M.,
Srur, A. M., and Vimeux, F.: Are the δ18O of F. cupressoides
and N. pumilio promising proxies for climate reconstructions in northern Patagonia?, J. Geophys. Res.-Biogeo., 121, 767–776, https://doi.org/10.1002/2015JG003260, 2016.
Lavergne, A., Daux, V., Villalba, R., Pierre, M., Stievenard, M., and Srur, A. M.: Improvement of isotope-based climate reconstruc-tions in Patagonia through a better understanding of climate in-fluences on isotopic fractionation in tree rings, Earth Planet. Sc. Lett., 459, 372–380, https://doi.org/10.1016/j.epsl.2016.11.045, 2017
López Bernal, P., Defossé, G. E., Quinteros, C. P., and Bava, J. O.: Sustainable management of lenga (Nothofagus pumilio) forests through group selection system, in: Sustainable forest manage-ment – current research, edited by: Diez, J. J., 45–66, 2012. Lorrey, A. M., Brookman, T. H., Evans, M. N., Fauchereau,
N.C., Barbour, M., Macinnis-Ng, C. Criscitiello, A., Eischeid, G., Fowler, A. M., Horton, T. W., and Schrag, D. P.: Sta-ble oxygen isotope signatures of early season wood in New Zealand kauri (Agathis australis) tree rings: Prospects for palaeoclimate reconstruction, Dendrochronologia, 40, 50–63, https://doi.org/10.1016/j.dendro.2016.03.012, 2016.
Magnin, A., Puntieri, J., and Villalba, R.: Interannual variations in primary and secondary growth of Nothofagus pumilio and their relationships with climate, Trees, 28, 1463–1471, 2014. Misson, L.: MAIDEN: a model for analyzing ecosystem processes
in dendroecology, Can. J. For. Res., 34, 874–887, 2004. Natural Resources Canada: http://cfs.nrcan.gc.ca/projects/3/4, last
access: February 2017.
Naulier, M., Savard, M. M., Bégin, C., Marion, J., Arse-neault, D., and Bégin, Y.: Carbon and oxygen isotopes of lakeshore black spruce trees in northeastern Canada as prox-ies for climatic reconstruction, Chem. Geol., 374/375, 37–43, https://doi.org/10.1016/j.chemgeo.2014.02.031, 2014.
Naulier, M., Savard, M. M., Bégin, C., Gennaretti, F., Arseneault, D., Marion, J., Nicault, A., and Bégin, Y.: A millennial sum-mer temperature reconstruction for northeastern Canada using oxygen isotopes in subfossil trees, Clim. Past, 11, 1153–1164, https://doi.org/10.5194/cp-11-1153-2015, 2015.
Noone, D. and Simmonds, I.: Associations between δ18O of water and climate parameters in a simulation of atmospheric circulation for 1979–95, J. Clim., 15, 3150–3169, 2002.
Ogée, J., Brunet, Y., Loustau, D., Berbigier, P., and Delzon,
S.: MuSICA, a CO2, water and energy multilayer,
multi-leaf pine forest model: Evaluation from hourly to yearly time scales and sensitivity analysis, Glob. Change Biol., 9, 697–717, https://doi.org/10.1046/j.1365-2486.2003.00628.x, 2003. Ogée, J., Barbour, M. M., Wingate, L., Bert, D., Bosc, A.,
Stievenard, M., Lambrot, C., Pierre, M., Bariac, T., Loustau, D., and Dewar, R. C.: A single-substrate model to interpret intra-annual stable isotope signals in tree-ring cellulose, Plant, Cell Environ., 32, 1071–1090, https://doi.org/10.1111/j.1365-3040.2009.01989.x, 2009.
Rinne, K. T., Loader, N. J., Switsur, V. R., and
Water-house, J. S.: 400-year May-August precipitation
re-construction for Southern England using oxygen
iso-topes in tree rings, Quaternary Sci. Rev., 60, 13–25, https://doi.org/10.1016/j.quascirev.2012.10.048, 2013.
Risi, C., Bony, S., Vimeux, F., and Jouzel, J.: Water-stable isotopes in the LMDZ4 general circulation model: Model evaluation for present-day and past climates and applications to climatic inter-pretations of tropical isotopic records, J. Geophys. Res.-Atmos., 115, 1–27, https://doi.org/10.1029/2009JD013255, 2010. Roden, J. S., Lin, G., and Ehleringer, J. R.: A mechanistic
model for interpretation of hydrogen and oxygen isotope ratios in tree-ring cellulose, Geochim. Cosmochim. Ac., 64, 21–35, https://doi.org/10.1016/S0016-7037(99)00195-7, 2000. Rozanski, K. and Araguás-Araguás, L.: Spatial and temporal
vari-ability of stable isotope composition of precipitation over the South American continent, Bull. l’Institut Fr. d’eìtudes Andin., 24, 379–390, 1995.
Rozanski, K., Araguás-Araguás, L., and Gonfiantini, R.: Isotopic patterns in modern global precipitation, in: Climate change in continental isotopic records, edited by: Swart, P. K., Lohmann, K. C., McKenzie, J., and Savin, S., American Geophysical Union, 1993.
Running, S. W., Nemani, R. R., and Hungerford, R. D.: Ex-trapolation of synoptic meteorological data in mountain-ous terrain and its use for simulating forest evapotranspira-tion and photosynthesis, Can. J. Forest Res., 17, 472–483, https://doi.org/10.1139/x87-081, 1987.
Rusch, V. E.: Altitudinal variation in the phenology of Nothofagus pumilio in Argentina, Rev. Chil. Hist. Nat., 66, 131–141, 1993.
Saurer, M., Aellen, K., and Siegwolf, R. T. W.: Correlating δ13C
and δ18O in cellulose of trees, Plant Cell Environ., 20, 1543–
1550, 1997.
Saurer, M., Cherubini, P., Reynolds-Henne, C. E., Treydte, K. S., Anderson, W. T., and Siegwolf, R. T. W.: An investiga-tion of the common signal in tree ring stable isotope chronolo-gies at temperate sites, J. Geophys. Res.-Biogeo., 113, 1–11, https://doi.org/10.1029/2008JG000689, 2008.
Schlatter, J.: Requerimientos de sitio para la lenga, Nothofagus pumilio (Poepp. et Endl.) Krasser, Bosque, 15, 3–10, 1994.
Shi, C., Daux, V., Zhang, Q. B., Risi, C., Hou, S. G., Stievenard, M., Pierre, M., Li, Z., and Masson-Delmotte, V.: Reconstruction of
southeast Tibetan Plateau summer climate using tree ring δ18O:
Moisture variability over the past two centuries, Clim. Past, 8, 205–213, https://doi.org/10.5194/cp-8-205-2012, 2012. Smith, R. B. and Evans, J. P.: Orographic precipitation and water
vapor fractionation over the Southern Andes, J. Hydrometeorol., 8, 3–19, https://doi.org/10.1175/JHM555.1, 2007.
Stern, L. A. and Blisniuk, P. M.: Stable isotope
com-position of precipitation across the southern
Patago-nian Andes, J. Geophys. Res.-Atmos., 107, D234667,
https://doi.org/10.1029/2002JD002509, 2002.
Sternberg, L. D. S. L.: Oxygen and hydrogen isotope ratios in plant cellulose: Mechanisms and applications, in: Stable isotopes in ecological research, edited by: Rundel, P. W., Ehleringer J. R., and Nagy K. A., 124–141, 1989.
Sternberg, L. D. S. L. and Ellsworth, P. F. V.: Divergent biochem-ical fractionation, not convergent temperature, explains cellu-lose oxygen isotope enrichment across latitudes, PLoS One, 6, e28040, https://doi.org/10.1371/journal.pone.0028040, 2011.
Sturm, C., Vimeux, F., and Krinner, G.: Intraseasonal
variability in South America recorded in stable
wa-ter isotopes, J. Geophys. Res.-Atmos., 112, 2156–2202, https://doi.org/10.1029/2006JD008298, 2007.
Sturm, K., Hoffmann, G., Langmann, B., and Stichler, W.:
Simulation of δ18O in precipitation by the regional
circu-lation model REMOiso, Hydrol. Process., 19, 3425–3444, https://doi.org/10.1002/hyp.5979, 2005.
SWING project: http://paos.colorado.edu/~dcn/SWING/database. php, last access: June 2017.
Treydte, K., Boda, S., Graf Pannatier, E., Fonti, P., Frank, D., Ullrich, B., Saurer, M., Siegwolf, R. T. W., Battipaglia, G., Werner, W., and Gessler, A.: Seasonal transfer of oxygen iso-topes from precipitation and soil to the tree ring: Source wa-ter versus needle wawa-ter enrichment, New Phytol., 202, 772–783, https://doi.org/10.1111/nph.12741, 2014.
Viereck, L. A. and Johnston, W. F.: Picea mariana (Mill.) B. S. P., in: Silvics of North America: 1. Conifers; 2. Hardwoods, edited by: Burns, R. M. and Honkala, B. H., US, Department of Agriculture, Forest Service, Washington, DC, 443–464, 1990.
Wernicke, J., Grießinger, J., Hochreuther, P., and Braüning, A.: Variability of summer humidity during the past 800 years on
the eastern Tibetan Plateau inferred from δ18O of tree-ring
cel-lulose, Clim. Past, 11, 327–337, https://doi.org/10.5194/cp-11-327-2015, 2015.
Wershaw, R. L., Friedman, I., and Heller, S. J.: Hydrogen isotope fractionation in water passing through trees, in: Advances in Or-ganic Geochemistry, edited by: Hobson, F. and Speers, M., New York, Pergamon, 55–67, 1966.
Yakir, D. and DeNiro, M. J.: Oxygen and hydrogen isotope fraction-ation during cellulose metabolism in lemna gibba L., Plant Phys-iol., 93, 325–332, https://doi.org/10.1104/pp.93.1.325, 1990.