HAL Id: insu-01769146
https://hal-insu.archives-ouvertes.fr/insu-01769146
Submitted on 13 Nov 2020HAL is a multi-disciplinary open access archive for the deposit and dissemination of sci-entific research documents, whether they are pub-lished or not. The documents may come from teaching and research institutions in France or abroad, or from public or private research centers.
L’archive ouverte pluridisciplinaire HAL, est destinée au dépôt et à la diffusion de documents scientifiques de niveau recherche, publiés ou non, émanant des établissements d’enseignement et de recherche français ou étrangers, des laboratoires publics ou privés.
Optical properties of an industrial fire observed with a
ground based N 2 -Raman lidar over the Paris area
Xiaoxia Shang, Patrick Chazette, Julien Totems
To cite this version:
Xiaoxia Shang, Patrick Chazette, Julien Totems. Optical properties of an industrial fire observed with a ground based N 2 -Raman lidar over the Paris area. EPJ Web of Conferences, EDP Sciences, 2018, (The 28th International Laser Radar Conference (ILRC 28), Bucharest 2017, 176, pp.04006. �10.1051/epjconf/201817604006�. �insu-01769146�
OPTICAL
PROPERTIES
OF
AN
INDUSTRIAL
FIRE
OBSERVED
WITH
A
GROUND
BASED
N
2-RAMAN
LIDAR
OVER
THE
PARIS
AREA
Xiaoxia Shang1,2*, Patrick Chazette2, Julien Totems2
1IPSL/LATMOS, Paris, France, *xiaoxia.shang@gmail.com
2IPSL/LSCE, Gif sur Yvette, France
ABSTRACT
This paper presents the first, to our knowledge, lidar measurement of an industrial fire plume, which covered the north of the Paris area on 17th
April 2015. The fire started in a textile warehouse and rapidly spread by emitting large quantities of aerosols into the low troposphere. A ground based N2-Raman lidar performed continuous
measurements during this event. Vertical profiles of the aerosol extinction coefficient, depolarization and lidar ratio are derived. A Monte Carlo algorithm was used to assess the uncertainties on the optical parameters, and to evaluate lidar inversion methods.
1 INTRODUCTION
Domestic fires cause casualties and significant property damages. In France, one house fire occurs every 2 minutes, adding up to 263 000 domestic fires each year, causing about 100 deaths and 10 000 injuries (http://iaaifrance.fr/). These fires emit large amounts of gases and aerosols, which are detrimental to human health and degrade visibility. Domestic fires are one of the major sources of aerosols, contributing to both PM10 and
PM2.5.
Weather has a dominant role in fire propagation, especially wind force and direction. In return, the fire influences the dynamics and the chemistry of the atmosphere. Modelling tools are needed to predict regional aerosol emissions from fires and analyze policy options. However, the characterization of fire emissions remains incomplete, mainly due to the difficulties in obtaining smoke samples. Their non-predictability poses an obvious challenge to perform chemical and meteorological measurements.
Lidar is an efficient technique for the detection of various types of particles, such as ash, air pollution, dust, biomass burning aerosols [1][2][3]. Lidar derived parameters can be good constraints for a model [4]. In particular, Raman lidars are
becoming well-established tools that are used in the study of numerous areas of importance in the atmospheric sciences [5]. In this study, a ground based N2-Raman lidar system performed
continuous measurements during an exceptionally strong fire in the Paris area on 17th April 2015. The
optical properties of the smoke aerosols were
characterized using conventional and
regularization inversion methods.
Raman lidar data processing usually follows the conventional approach of retrieving profiles of aerosol extinction coefficient (AEC) and aerosol backscatter coefficient, as well as column-averaged values of extinction-to-backscatter ratio, which is also called lidar ratio (LR) [6]. Here, given the large vertical heterogeneity of the atmosphere, regularization methods were applied [7] to estimate a precise LR profile resolving the smoke plume.
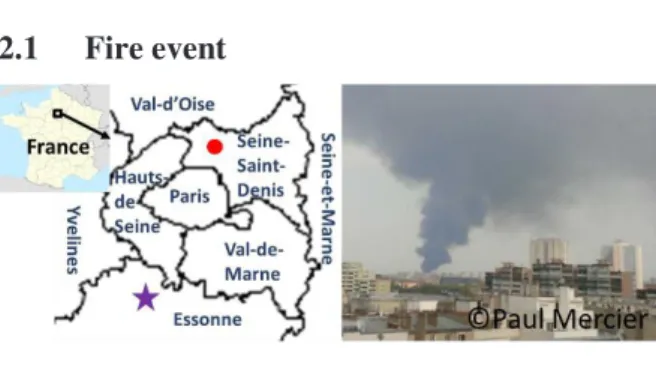
2 INSTRUMENTS AND METHODOLOGY 2.1 Fire event
Figure 1. Left: Locations of the textile warehouse on fire (red circle) and of lidar and sun-photometer instruments (purple pentagram). Right: Photo of the
smoke plume from far distance.
On 17th April 2015, a violent fire broke out around
2 pm local time (1200 UTC), in a textile warehouse of 12 000 m2 in La Courneuve, Seine-Saint-Denis,
France (48°55'52''N 2°23'52''E, Figure 1). Thick black smoke covered the north area of Paris as shown in Figure 1. With a wind speed of ~22 km/h, the smoke plume rapidly spread from the north to the south of Paris. There was no victim, but damages were assessed around 40 million euros.
Moreover, the traffic was severely disrupted on numerous highways and railways of the Paris area.
2.2 In situ and spaceborne observation
PM10 concentrations were observed by the
AIRPARIF air quality network at the traffic station “Route nationale 2” (http://www.airparif.asso.fr/), four kilometers downwind of the fire location. The average daytime value on 17th April was
~60 µg/m3, exceeding the information threshold,
but no outlying values were identified during the fire event. The fire mainly injected aerosols into the free troposphere by pyro-convection, just above the planetary boundary layer (PBL) situated close to 1 km above the mean sea level (amsl).
The aerosol optical depth (AOD) and the visible Angstrom exponent are derived from the AERONET sun-photometer station of Palaiseau (http://aeronet.gsfc.nasa.gov/, Figure 1). Elevated AOD values (from 0.6 to 1 at 355 nm) were observed on 17th April, representing the peak value
of the whole month (the monthly mean AOD is ~0.2 in cloud-free condition). The visible (440-675 nm) mean Angstrom exponent is found to be ~1.1, representative of carbonaceous particles. Note that the Angstrom exponent for Paris background aerosols is ~1.5.
The AOD values were also derived from the daily MODIS level 2 aerosol product (MYD04_L2), with a spatial resolution of 10 km×10 km. In the 0.4°×0.4° area around Paris, the AOD at 550 nm is 0.55 ±0.09 on 17th April, ~50% larger than the
expected one derived from the sun-photometer.
2.3 N2-Raman lidar
The N2-Raman lidar LAASURS (Lidar for
Automatic Atmospheric Surveys using Raman Scattering, [2]) was put into operation in Palaiseau (48°42’23"N 2°13’22"E, Figure 1), south of Paris, to sample the fire smoke plumes. The straight distance between the locations of the fire and lidar is ~28 km. LAASURS is composed of two reception channels: one dedicated to the measurement of the co- and cross-polarized signals at ~355 nm and one to the inelastic nitrogen Raman backscattered signal at ~387 nm. It enables the retrieval of aerosol optical properties and atmospheric structures with a final resolution of 15 m along the line of sight. A temporal averaging
of ~30 min was used in this study to increase the signal-to-noise ratio.
2.4 Lidar inversion methodology
Two inversion methods are applied to retrieve aerosol optical properties (LR, AEC, etc.). The cumulative AOD deduced directly from the N2
-Raman measurements is used as a constraint in the data processing [2].
Inversion of lidar profiles is first performed by applying a conventional approach (one-aerosol-layer approach) [6]. The LR is assumed as range-independent and is the backscatter-weighted mean lidar ratio of the aerosol column (hereafter MLR). The error sources are well known and are mainly due to the vertical heterogeneity of the aerosol layers. The MLR can be poorly representative of the actual LR profile, especially in presence of multiple scattering layers.
Regularization methods may be of advantage if the retrieved backscatter coefficient profile indicates pronounced heterogeneities with altitude. The core principle is to resolve the equation that the cumulative AOD can be expressed as the product of the aerosol backscatter coefficient and the LR. Several regularization methods are available, such as the Tikhonov regularization, which is hereafter applied [8].
3 RESULTS AND DISCUSSION
3.1 Optical characteristics observed by lidar
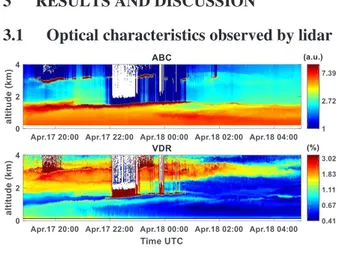
Figure 2. Temporal evaluations, form 1850 UTC on 17th April to 0500 UTC on 18th April 2015, of the
attenuated backscattering coefficient (ABC) (top panel), and volume depolarization ratio (VDR) (bottom
panel).
2
EPJ Web of Conferences 176, 04006 (2018) https://doi.org/10.1051/epjconf/201817604006
Moreover, the traffic was severely disrupted on numerous highways and railways of the Paris area.
2.2 In situ and spaceborne observation
PM10 concentrations were observed by the
AIRPARIF air quality network at the traffic station “Route nationale 2” (http://www.airparif.asso.fr/), four kilometers downwind of the fire location. The average daytime value on 17th April was
~60 µg/m3, exceeding the information threshold,
but no outlying values were identified during the fire event. The fire mainly injected aerosols into the free troposphere by pyro-convection, just above the planetary boundary layer (PBL) situated close to 1 km above the mean sea level (amsl).
The aerosol optical depth (AOD) and the visible Angstrom exponent are derived from the AERONET sun-photometer station of Palaiseau (http://aeronet.gsfc.nasa.gov/, Figure 1). Elevated AOD values (from 0.6 to 1 at 355 nm) were observed on 17th April, representing the peak value
of the whole month (the monthly mean AOD is ~0.2 in cloud-free condition). The visible (440-675 nm) mean Angstrom exponent is found to be ~1.1, representative of carbonaceous particles. Note that the Angstrom exponent for Paris background aerosols is ~1.5.
The AOD values were also derived from the daily MODIS level 2 aerosol product (MYD04_L2), with a spatial resolution of 10 km×10 km. In the 0.4°×0.4° area around Paris, the AOD at 550 nm is 0.55 ±0.09 on 17th April, ~50% larger than the
expected one derived from the sun-photometer.
2.3 N2-Raman lidar
The N2-Raman lidar LAASURS (Lidar for
Automatic Atmospheric Surveys using Raman Scattering, [2]) was put into operation in Palaiseau (48°42’23"N 2°13’22"E, Figure 1), south of Paris, to sample the fire smoke plumes. The straight distance between the locations of the fire and lidar is ~28 km. LAASURS is composed of two reception channels: one dedicated to the measurement of the co- and cross-polarized signals at ~355 nm and one to the inelastic nitrogen Raman backscattered signal at ~387 nm. It enables the retrieval of aerosol optical properties and atmospheric structures with a final resolution of 15 m along the line of sight. A temporal averaging
of ~30 min was used in this study to increase the signal-to-noise ratio.
2.4 Lidar inversion methodology
Two inversion methods are applied to retrieve aerosol optical properties (LR, AEC, etc.). The cumulative AOD deduced directly from the N2
-Raman measurements is used as a constraint in the data processing [2].
Inversion of lidar profiles is first performed by applying a conventional approach (one-aerosol-layer approach) [6]. The LR is assumed as range-independent and is the backscatter-weighted mean lidar ratio of the aerosol column (hereafter MLR). The error sources are well known and are mainly due to the vertical heterogeneity of the aerosol layers. The MLR can be poorly representative of the actual LR profile, especially in presence of multiple scattering layers.
Regularization methods may be of advantage if the retrieved backscatter coefficient profile indicates pronounced heterogeneities with altitude. The core principle is to resolve the equation that the cumulative AOD can be expressed as the product of the aerosol backscatter coefficient and the LR. Several regularization methods are available, such as the Tikhonov regularization, which is hereafter applied [8].
3 RESULTS AND DISCUSSION
3.1 Optical characteristics observed by lidar
Figure 2. Temporal evaluations, form 1850 UTC on 17th April to 0500 UTC on 18th April 2015, of the
attenuated backscattering coefficient (ABC) (top panel), and volume depolarization ratio (VDR) (bottom
panel).
Figure 3. Temporal evaluations, form 1850 UTC on 17th April to 0500 UTC on 18th April 2015, of the
aerosol extinction coefficient (AEC), and the particle depolarization ratio (PDR). White gapes indicate
cloudy cases which have been removed for lidar inversion. The PDR is only considered for AEC >
0.02 km-1.
The temporal evolutions of both the attenuated backscattering coefficient (ABC) and volume depolarization ratio (VDR) vertical profiles are presented in Figure 2. Three aerosol layers can be easily located in the low troposphere: i) the PBL, under 1.2 km, ii) a thin non-depolarizing layer close to 1.2 km amsl with a high ABC, and iii) a depolarizing layer between 1.8 and ~4 km amsl. Before the inversion of lidar profiles, the cloudy cases are removed [1]. The vertical profiles of the AEC and the particle depolarization ratio (PDR) are shown in Figure 3. Mean cloud-free vertical profiles are also given in Figure 4 (39 profiles). The standard deviations around the mean values are represented as colored areas.
The aerosol layer located close to 1.2 km amsl is associated with a strong AEC (~0.8 km-1) and a
small PDR (~1%). This is the smoke plume coming from the fire accident. The particles appear to be sphere-like. The upper depolarizing aerosol layer presents a PDR~10%, which is probably a mixing of pollution and dust aerosols. The smoke plume has LR ~100 sr, whereas the depolarizing layer has LR ~50 sr. In the PBL, the LR is close to 105 sr, as occasionally observed in the Paris area [2]. Note that the MLR for the same mean vertical profile is ~60 sr. Hence, we note a significant difference, which can lead to an underestimation (overestimation) of the smoke plume (polluted dust layer) AEC.
Figure 4. Left: Range-corrected lidar signal of elastic channel (black) and Raman channel (red). Dotted lines
indicate theoretical Rayleigh scattering signals. Center: Retrieved AEC (aerosol extinction coefficient)
with the used MLR (mean lidar ratio) values. Right: Volume depolarization ratio (VDR, black) and particle
depolarization ratio (PDR, red). Gray/Red shaded areas indicate the standard deviations around the mean values, for lidar measurements from 1850 to
2133 UTC on 17th April 2015.
In order to investigate the air mass origins of the polluted-dust layer, back-trajectory analysis in ensemble mode was performed using the NOAA HYSPLIT (HYbrid Single-Particle Lagrangian Integrated Trajectory model, available at http://ready.arl.noaa.gov). Part of the upper aerosol layer seems to originate from North Africa, and may be loaded with dust aerosols. Another strong contribution is found to be recirculated air masses from France, probably containing pollution particles.
3.2 LR: column value or profile
The above results are based on the Klett method, using MLR. Regularization methods can be of advantage for this study because of the pronounced vertical heterogeneities of the aerosol mixing. A Raman lidar simulator was developed for the sensitivity study of different inversion algorithms. It is an end-to-end simulator containing direct and inverse modules. Predetermined AEC and LR profiles are used as the input of the simulator, and compared with the estimated parameters to assess bias and standard deviations. Lidar system parameters are based on actual measurements. Several regularization methods were simulated under different predetermined atmosphere conditions. Results show that the Tikhonov regularization performs the best estimations, with acceptable uncertainty and a good capacity to
reproduce the vertical structure if the SNR is large enough.
As lidar measurements are performed during night-time, the SNR is suitable to use the Tikhonov method for Raman lidar data inversion. It is compared with the Klett inversion results. The comparison shows that LR can be considered as range-independent for most cases (~90%). An example is given in Figure 5 on the left, where the derived AECs using a column LR (in red, Klett method) or LR profile (in blue, Tikhonov method) are similar. However, for the example shown on the right of Figure 5, a difference up to ~50% on the AEC retrieval between 2 methods can be found. The cumulative AOD was better restored with the regularization method. We note however that the regularization algorithm is relatively time consuming.
Figure 5. Mean value (lines) and standard deviation (shaded areas) profiles of cumulative aerosol optical depth (AOD), aerosol extinction coefficient (AEC) and Lidar ratio (LR) for ~10 min average centered at 2045 (left) and 2150 (right) UTC of 17th April 2015. Black:
AOD derived from Raman channel signal; Red: inversion results using Klett method. Blue: inversion
results using Tikhonov method.
4 CONCLUSIONS
A ground based N2-Raman lidar sampled, for the
first time, fire smoke plumes during an exceptional industrial fire event in the Paris area on 17th April
2015. The optical properties of the fire aerosols were characterized using both conventional and regularization inversion methods. This thin smoke plume at 1.2 km has a strong AEC (~0.8 km-1) and
a small PDR (~1%), containing sphere-like, absorbent aerosols. The LR of the fire smoke plume was indeed derived as ~100 sr, using the Tikhonov regularization method. The comparison of optical property retrievals between the conventional and regularization inversion methods shows the advantage of a regularization inversion for the heterogeneous atmosphere conditions. The
Raman lidar system is proved to be a strong tool to sample the aerosol layers during extreme events, which argues for the existence of lidar networks dedicated to the monitoring of air quality in urbanized area.
ACKNOWLEDGEMENTS
This work was supported by the Commissariat à l'Energie Atomique et aux énergies alternatives (CEA).
References
[1] Chazette, P., Dabas, A., Sanak, J., Lardier, M., Royer, P., 2012: French airborne lidar measurements for Eyjafjallajökull ash plume survey, Atmos. Chem. Phys., 12, 7059-7072. [2] Royer, P., Chazette, P., Lardier, M., Sauvage,
L., 2011: Aerosol content survey by mini N2
-Raman lidar: Application to local and long-range transport aerosols, Atmos. Environ., 45, 7487-7495.
[3] Chazette, P., Sanak, J., Dulac, F., 2007: New Approach for Aerosol Profiling with a Lidar Onboard an Ultralight Aircraft: Application to the African Monsoon Multidisciplinary Analysis, Environ. Sci. Technol., 41, 8335-8341.
[4] Wang, Y., Sartelet, K. N., Bocquet, M., Chazette, P., 2014: Modelling and assimilation of lidar signals over Greater Paris during the MEGAPOLI summer campaign, Atmos. Chem. Phys., 14, 3511-3532.
[5] Whiteman, D.N., 2003: Examination of the traditional Raman lidar technique. I. Evaluating the temperature-dependent lidar equations, Appl. Opt., 42, 2571-2592.
[6] Klett, J.D., 1981: Stable analytical inversion solution for processing lidar returns, Appl. Opt., 20, 211-220.
[7] Shcherbakov, V., 2007: Regularized algorithm for Raman lidar data processing, Appl. Opt.,
46, 4879-4889.
[8] Tikhonov, A.E., and Arsenin, V.Y., 1977: Solutions of Ill-posed Problems, Wiley.
4
EPJ Web of Conferences 176, 04006 (2018) https://doi.org/10.1051/epjconf/201817604006