705
The Association Between the Body Mass Index and
4-Year All-Cause Mortality in Older Hospitalized Patients
Dina Zekry, François R. Herrmann, and Ulrich M. Vischer
†Department of Internal Medicine, Rehabilitation and Geriatrics, Geneva University Hospitals and University of Geneva, Thônex, Switzerland.
†The author died on March 19, 2012.
Address correspondence to François R. Herrmann, MD, MPH, Department of Internal Medicine, Rehabilitation and Geriatrics, Geneva University Hospitals, 3, chemin Pont-Bochet, 1226 Thônex, Switzerland. Email: [email protected]
Background. Association between body mass index (BMI) and long-term mortality is poorly studied in older hospi-talized populations.
Methods. The researchers prospectively studied the impact of the BMI, comorbidities, and malnutrition on long-term mortality in 444 patients (mean age 85.3 ± 6.7 years; 74.0% women) receiving geriatric inpatient care. All-cause mortality was determined using simple and multiple Cox proportional hazard models.
Results. Higher BMI was associated with a higher prevalence of diabetes, hypertension, and heart failure, but with a lower prevalence of malignancies. Four-year all-cause mortality was inversely associated with a BMI greater than or equal to 30 kg/m2 (hazard ratio = 0.59, p = .037) and positively associated with age, male gender, several individual comorbidities, and the global disease load determined by the Cumulative Illness Rating scale. The inverse association between a BMI greater than or equal to 30 and mortality remained significant after adjustment for age, gender, smok-ing, individual comorbidities (including heart failure and malignancies), Cumulative Illness Rating scale scores, and malnutrition parameters (hazard ratio = 0.52, p = .015). One-year mortality was associated with the Cumulative Illness Rating scale score but not with BMI categories. There were no survival differences between patients in low (<20.0) and intermediate (20.0–24.9 and 25.0–29.9) BMI categories.
Conclusions. A BMI greater than or equal to 30 is associated with better long-term survival in hospitalized older patients, even after extensive adjustment for comorbidities, malnutrition, and smoking. Conversely, a low BMI (<20–25) is not associated with excess mortality, likely due to the overriding impact of multiple comorbidities. The researchers’ observations have important implications for the mortality risk stratification in older high-risk patients.
Key Words: Mortality—Body mass index—Comorbidity—Aged 80 and over.
Received February 28, 2012; Accepted September 10, 2012 Decision Editor: Stephen Kritchevsky, PhD
T
HE association between obesity and cardiovascular and all-cause mortality is well established. However, there is still uncertainty about the effect of age and comorbidities on this association. Large collaborative studies using the body mass index (BMI) to define obesity have shown that the mortality risk associated with obesity markedly declines with age (1,2). Studies in older populations have shown a paradoxical, inverse association between the BMI and survival (3–5). This inverse association was essentially accounted for by high mortality in patients with a low BMI (<20.0 kg/m2), but there was no evidence of excessmortality in obese patients, commonly defined by a BMI higher than 30.0 kg/m2 (3). Similarly, an “obesity paradox”
has been reported in younger patients with chronic renal insufficiency, heart failure, or coronary heart disease (6,7). The underlying mechanisms remain incompletely understood. One possibility is that comorbidities and/ or malnutrition are associated with both mortality and
unintentional weight loss, thereby confusing the association between the BMI and mortality (8,9). Another possibility is that a high BMI is a protective factor against mortality from acute diseases or comorbidities, as a higher fat or lean body mass may somehow offer a greater metabolic or nutritional reserve (6).
Older patients in medical or geriatric care represent a population with a particularly high prevalence of comorbid-ities and functional disabilcomorbid-ities. The researchers have previ-ously observed in two prospective studies that the BMI is strongly associated with survival in such patients (10–12). One of these studies was initially conducted to determine the impact of cognitive disorders on adverse outcomes of hospitalization and mortality, relative to other risk factors and comorbidities; an extensive baseline characterization of comorbidities and long-term mortality data are therefore both available (13,14). In the present report, the research-ers used the data from this cohort to determine the relative
impact of the BMI, comorbidities, and related factors on 4-year all-cause mortality after a hospital admission.
Patients and Methods
The study was conducted in a 294-acute bed geriatric hospital where 22.7% patients were directly admitted from the community, 54.0% were referred from the emergency unit and 23.3% were transferred from other inpatient ser-vices. Patients and data collection have been described previously (13). Briefly, a representative sample of all patients aged more than 75 years, consecutively admit-ted between January 2004 and December 2005 were ran-domly selected, with a sampling fraction of 30% using a computer algorithm. The exclusion criteria were disorders interfering with psychometric assessment and terminal ill-ness. The local Ethics Committee approved the protocol, and patients, families, or legal representatives provided signed written informed consent. Demographic data for the patients studied did not significantly differ from those admitted during the recruitment period (13). Data collected are listed in Table 1.
Medical history was recorded on standardized forms; the following parameters were recorded in all patients:
1. Age, sex, marital status, living arrangements, and cur-rent smoking.
2. The BMI (kg/m2) was calculated from measured weight
and height at admission. To avoid bias associated with acute fluid retention diseases all patients were weighted again 1 week after admission, the lowest weight was taken as the reference one. In hospital, weight was measured on a large scale located at the floor level allowing weighting of a patient while sitting on his wheel chair. Weight and height were measured by research technicians to the nearest 0.1 kg and centimeter, respectively, on patients wearing a hospital gown or light clothing before breakfast. Both measurements were performed later during hospitalization in patients initially unable to stand. Thanks to the prospective design of the study, height was measured on every follow-up visit, by the same team.
3. Comorbidities were assessed with the CIRS by extensive review of the patient’s medical records for
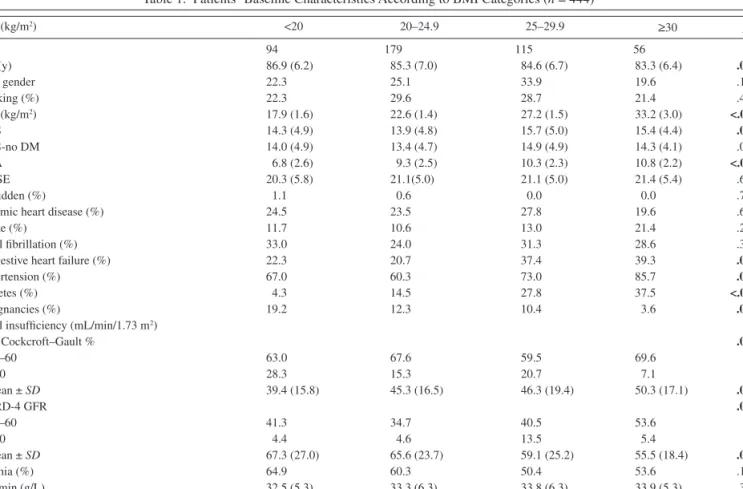
Table 1. Patients’ Baseline Characteristics According to BMI Categories (n = 444)
BMI (kg/m2) <20 20–24.9 25–29.9 ≥30 p n 94 179 115 56 Age (y) 86.9 (6.2) 85.3 (7.0) 84.6 (6.7) 83.3 (6.4) .011 Male gender 22.3 25.1 33.9 19.6 .132 Smoking (%) 22.3 29.6 28.7 21.4 .439 BMI (kg/m2) 17.9 (1.6) 22.6 (1.4) 27.2 (1.5) 33.2 (3.0) <.001 CIRS 14.3 (4.9) 13.9 (4.8) 15.7 (5.0) 15.4 (4.4) .010 CIRS-no DM 14.0 (4.9) 13.4 (4.7) 14.9 (4.9) 14.3 (4.1) .059 MNA 6.8 (2.6) 9.3 (2.5) 10.3 (2.3) 10.8 (2.2) <.001 MMSE 20.3 (5.8) 21.1(5.0) 21.1 (5.0) 21.4 (5.4) .603 Bedridden (%) 1.1 0.6 0.0 0.0 .791
Ischemic heart disease (%) 24.5 23.5 27.8 19.6 .681
Stroke (%) 11.7 10.6 13.0 21.4 .204
Atrial fibrillation (%) 33.0 24.0 31.3 28.6 .371
Congestive heart failure (%) 22.3 20.7 37.4 39.3 .002
Hypertension (%) 67.0 60.3 73.0 85.7 .002
Diabetes (%) 4.3 14.5 27.8 37.5 <.001
Malignancies (%) 19.2 12.3 10.4 3.6 .037
Renal insufficiency (mL/min/1.73 m2)
GFR Cockcroft–Gault % .018 30–60 63.0 67.6 59.5 69.6 <30 28.3 15.3 20.7 7.1 mean ± SD 39.4 (15.8) 45.3 (16.5) 46.3 (19.4) 50.3 (17.1) .002 MDRD-4 GFR .033 30–60 41.3 34.7 40.5 53.6 <30 4.4 4.6 13.5 5.4 mean ± SD 67.3 (27.0) 65.6 (23.7) 59.1 (25.2) 55.5 (18.4) .006 Anemia (%) 64.9 60.3 50.4 53.6 .146 Albumin (g/L) 32.5 (5.3) 33.3 (6.3) 33.8 (6.3) 33.9 (5.3) .387 CRP (mg/L) 42.1 (60.9) 33.9 (56.0) 34.2 (49.5) 29.2 (52.5) .522 Hemogobin (g/L) 122.7 (18.3) 123.9 (17.7) 124.4 (18.9) 126.6 (17.8) .645
Notes: Data are shown as mean ± SD or as percentage. Bold entries = statistically significant. BMI = body mass index; MNA = Mini Nutritional Assessment; MMSE = Mini-Mental State Examination; CIRS = Cumulative Illness Rating scale-Geriatrics; CIRS-no DM = CIRS modified score, without diabetes; CRP = C-reactive protein; GFR = glomerular filtration rates.
diagnoses established at or before enrolment in this study. This scale has previously been validated in the hospital, and shown to predict length of stay, institu-tionalization, intrahospital death, and long-term mor-tality (14). The CIRS incorporates medical conditions according to 14 categories (heart disease, hyperten-sion, hematopoietic, respiratory, eyes and ears, upper gastrointestinal, lower gastrointestinal, liver, kidneys, genitourinary, musculoskeletal, neurological, endo-crine-metabolic, psychiatric-dementia), rated on a scale from 0 to 4. The total score (CIRS score) is cal-culated as the sum of the 14 scores. As diabetes is con-sidered as a comorbidity in the endocrine-metabolic category, a modified score (CIRS-no DM) omitting this category was calculated. It is important to note that obesity was not included as a comorbidity item in this category, contrary to the instructions provided in the users’ manual (19).
4. Arterial hypertension was defined by a physician diag-nosis and/or ongoing treatment. The diabetes status was abstracted from the Charlson index, and verified by individual chart review (12). Ischemic heart disease was defined as myocardial infarction based on previous med-ical history and/or ongoing treatment and was confirmed by revision of individual hospital charts. Stroke was identified by history and physical examination, and con-firmed by cerebral imaging. The presence of atrial fibril-lation was determined by standard ECG at admission. Congestive heart failure was abstracted from the ICED score (15). The presence of malignancy was abstracted from the Charlson score, combining “solid tumor with metastasis,” “lymphoma,” and “leukemia” into a single parameter.
5. The short version of the MNA-SF was administered, considering the 2 weeks prior admission as the reference period (16,17). A score 12–14 indicates normal nutri-tional status, 8–11 “at risk of malnutrition,” and 0–7 malnutrition.
6. Hemoglobin, serum albumin, C-reactive protein, and creatinine were determined by standard techniques. The GFR was calculated using both the Cockcroft–Gault for-mula adjusted for body surface area and the 4-parameter Modification of Diet in Renal Disease formula, as previ-ously described (18).
The outcome of interest was death from any cause by December 31, 2009. Information was obtained through access to the population registry of the State of Geneva.
Statistical Methods
Comparison among the four BMI categories was per-formed using one-way analysis of variance or the Kruskal– Wallis nonparametric analysis of variance for continuous variables and the χ2 test for binary variables. Survival data
were analyzed using univariate and multiple Cox models
taking into account the time to the event. Kaplan–Meier survival curves were compared using the log-rank test. Results are presented as mean ± SD. Stata version 12 was used for all analysis and p < .05 was considered statistically significant.
Results
Patients’ Characteristics According to BMI Categories Of the 496 randomly selected patients, 52 were excluded (20 major behavioral problems, 9 unable to communicate, 8 terminally ill, 7 lived outside the state of Geneva, 5 with no family or legal representative), and 3 with incomplete data. Overall, 444 (90%) patients had full data and were included in this study (mean age 85.3 ± 6.7 years; 74.0% women). The mean BMI was 24.1 + 4.9 kg/m2. Thus, 94,
79, 115, and 56 patients had a BMI less than 20, 20–24.9, 25–29.9, and greater than or equal to 30 kg/m2, respectively.
The patients’ characteristics according to BMI categories are shown in Table 1. Patients with a higher BMI were significantly younger. They had a higher prevalence of diabetes, hypertension, and congestive heart failure, but the researchers observed no significant difference in the prevalence of other vascular comorbidities. The prevalence of chronic renal insufficiency was higher in obese patients when estimated by the 4-parameter Modification of Diet in Renal Disease formula and lower when estimated by the Cockcroft–Gault formula, likely reflecting biases introduced by age, gender, and body weight in the estimation of GFR by these formulas. The prevalence of malignancies was significantly lower in the higher BMI categories. Patients with a higher BMI had a higher global comorbidity load as judged from the CIRS score. This higher score was accounted for by the higher prevalence of diabetes, as there was no significant difference in CIRS-no DM scores, that is, after exclusion of the endocrine/ metabolic category. The differences in MNA scores across BMI categories were expected, as the BMI is a major item of this score. There were no significant differences in the gender ratio and the prevalence of smoking across BMI categories.
All-Cause Mortality According to BMI Categories
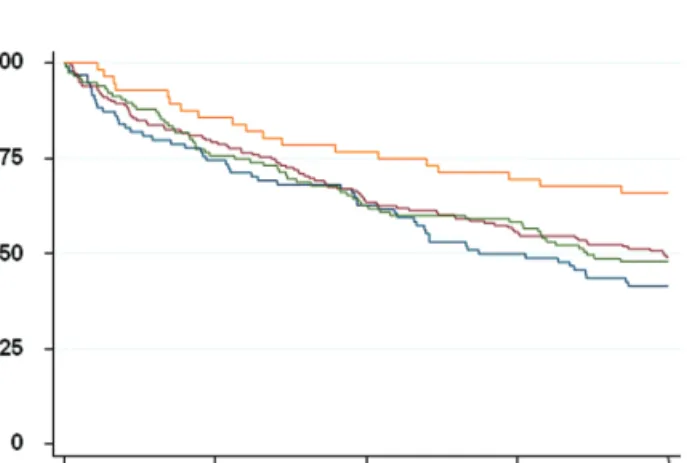
Of the 444 patients included, 23 (5.2%) had died during their hospital stay, 97 (22%) and 225 (51%) had died 1 and 4 years after discharge, respectively. Mortality according to BMI categories is shown in Figure 1. Survival in patients with a BMI greater than or equal to 30 kg/m2 was
signifi-cantly better than in lower BMI categories (<20 kg/m2,
20–24.9 kg/m2, and 25–29.9 kg/m2; p = .05 when comparing
all four categories and p = .013 when comparing patients with a BMI > 30 kg/m2 to the three lower categories
survival differences between patients from the three lower BMI categories. The analysis was repeated by BMI quar-tiles rather than by predetermined categories. Again, sur-vival was significantly better (p = .011) in patients in the highest quartile (BMI > 27.2 kg/m2), without any significant
differences in survival between the three lower quartiles (<20.6, 20.6–23.4, >23.4–27.2 kg/m2).
In simple Cox models, 4-year all-cause mortality was inversely associated with a BMI higher than 30 kg/m2. It
was also predicted by age, male gender, serum albumin, CIRS score, GFR, congestive heart failure, atrial fibrilla-tion, and malignancies, but not by MNA scores, other indi-vidual comorbidities and smoking (Table 2, model 0). In a multiple model adjusting for individual comorbidities, a BMI higher than 30 kg/m2 remained strongly, inversely
associated with mortality (model 1). The researchers next attempted to adjust for combined comorbidities and malnu-trition by generating a model including CIRS scores, MNA scores, and serum albumin (model 2). A BMI higher than 30 kg/m2 remained strongly associated with 4-year
mor-tality, along with CIRS scores, but not with MNA scores or serum albumin. Finally when individual comorbidities, CIRS scores, MNA scores, and serum albumin and smok-ing were all included in the model (model 3), a BMI higher than 30 kg/m2 remained strongly, inversely associated
with 4-year mortality. To exclude a gender selection bias, the analysis was repeated in women only. In the complete multiple model (model 3 as defined earlier, restricted to women), mortality was associated with a BMI higher than 30 kg/m2 (hazard ratio [HR] = 0.48, p = .02), as well as with
age (HR = 1.05, p = .005) and CIRS scores (HR = 1.07, p = .002). Interestingly, diabetes was associated with 4-year mortality both in simple (HR = 1.50, p = .048) and in mul-tiple models (HR = 1.58, p = .047), that is, with or without adjustment for BMI, malnutrition, and comorbidities. The Cox analysis was repeated using BMI quartiles, with very similar results. Four-year mortality was inversely associated
with a BMI in the highest quartile (>27.2 kg/m2; HR = 0.61,
p = .016), and positively associated with age (HR = 1.05, p = .001), male gender (HR = 1.65, p = .001), and CIRS scores (HR = 1.09, p < .0001).
One-year mortality was not associated with a BMI higher than 30 kg/m2. However, in a complete Cox model (model 3
as defined in Table 2) it was associated with age (HR = 1.05, p = .017), CIRS scores (HR = 1.15, p < .0001), and serum albumin (HR = 0.96, p = .042), but with none of the indi-vidual comorbidities.
Discussion
The main finding of this study is that 4-year all-cause mortality is strongly, inversely associated with obesity defined by a BMI higher than 30 kg/m2, or even with a
BMI higher than 27.2 kg/m2 in older patients admitted for
hospital care. This “obesity paradox” appears not to be explained by the negative impact of associated comorbidi-ties. Indeed, the prevalence of vascular comorbidities, dia-betes, and CIRS scores were comparable or even higher in obese patients. The prevalence of malignancies was inversely associated with BMI categories, but malignancies failed to account for the “protective” effect of a high BMI, likely due to their comparatively low overall prevalence. Further, the association of the BMI with survival persisted after adjustment for age, gender, comorbidities (whether assessed individually or by the CIRS score), malnutrition, and smoking, and thus could not be accounted for by these parameters. Finally, it is important to note that unlike CIRS scores, the BMI was not associated with 1-year mortality. The association of a high BMI with survival is observed over a longer time period than the association between CIRS scores and mortality.
Many studies have shown an inverse association between mortality and the BMI in older community-dwelling populations and in nursing home residents. However, most of these have actually shown an increased mortality in patients with a low BMI (typically <20 kg/m2),
with no or an only modest survival advantage associated with a high BMI (typically >27–30 kg/m2) (3,20–24).
Thinggaard and colleagues showed in a large cohort aged 70–95 years a trend to a decreasing association between mortality and high BMI with advancing age (25). In contrast to these previous studies, the researchers’ report focuses on older hospitalized patients with a very high prevalence of comorbidities and/or malnutrition, as evidenced by the high CIRS scores and the low MNA scores, and the high prevalence of vascular comorbidities, anemia, and hypoalbuminemia. The researchers observed no differences in survival among the three lower BMI categories. This result is actually in agreement with the previous observations on older inpatients from similar hospital services (10). In a nursing home study with a 1-year follow-up Kaiser and colleagues found the lowest
Figure 1. Kaplan–Meyer survival curves according to body mass index (kg/m2) categories (orange: >30; green: 25–29.9; red: 20–24.9; blue: >20).
Survival was significantly better in patients with a body mass index > 30 (log-rank test: p = .013).
Table 2.
Associations Between Selected P
arameters and
All-Cause Mortality
Analyzed by Simple (Model 0) and Multiple (Models 1 to 3
Adjusted for
All
V
ariables Listed in the
Table) Cox Re gression Models ( n = 444) Model 0 Model 1 Model 2 Model 3 HR 95% CI p HR 95% CI p HR 95% CI p HR 95% CI p Age (y) 1.07 [1.05–1.10] <.001 1.05 [1.02–1.08] <.001 1.06 [1.04–1.09] <.001 1.05 [1.02–1.07] .001 Male gender 1.78 [1.35–2.34] <.001 1.63 [1.20–2.20] .002 1.66 [1.24–2.24] <.001 1.59 [1.17–2.16] .003 Smoking 1.16 [0.87–1.55] .307 1.18 [0.87–1.61] .280 1.14 [0.84–1.55] .397 1.14 [0.84–1.56] .405 BMI (kg/m 2) <20 1.23 [0.88–1.71] .233 1.09 [0.77–1.55] .626 1.14 [0.79–1.63] .482 1.06 [0.73–1.53] .754 20–24.9 1.00 — 1.00 — 1.00 — 1.00 — 25–29.9 1.04 [0.75–1.44] .827 0.88 [0.63–1.23] .446 0.83 [0.59–1.17] .289 0.78 [0.55–1.10] .162 >30 0.59 [0.36–0.97] .037 0.55 [0.33–0.92] .023 0.57 [0.34–0.94] .028 0.52 [0.31–0.88] .015 Alb umin (g/L) 0.97 [0.94–0.99] .010 0.98 [0.96–1.01] .166 0.98 [0.95–1.00] .091
CIRS (score units)
1.11 [1.08–1.14] <.001 1.10 [1.07–1.13] <.001 1.08 [1.04–1.11] <.001 MN A cate gory: Malnourished 1.19 [0.82–1.71] .355 0.87 [0.57–1.33] .533 0.92 [0.60–1.41] .705 At risk 0.96 [0.69–1.32] .786 0.79 [0.57–1.11] .183 0.78 [0.55–1.10] .156 Diabetes 1.28 [0.93–1.76] .131 1.31 [0.94–1.84] .116 1.11 [0.79–1.57] .552 GFR (mL/min/1.73 m 2) 0.97 [0.97–0.98] <.001 0.99 [0.98–1.00] .027 0.99 [0.98–1.00] .134 Strok e 1.41 [0.98–2.02] .063 1.20 [0.83–1.74] .324 1.10 [0.76–1.60] .608
Ischemic heart disease
1.15 [0.85–1.54] .366 0.84 [0.61–1.15] .279 0.77 [0.56–1.06] .108 Atrial fibrillation 1.74 [1.32–2.28] <.001 1.30 [0.98–1.73] .069 1.15 [0.86–1.53] .36 Hypertension 0.94 [0.71–1.24] .641 0.98 [0.73–1.31] .869 0.87 [0.65–1.17] .359 Congesti ve heart f ailure 2.07 [1.57–2.71] <.001 1.95 [1.44–2.64] <.001 1.65 [1.21–2.25] .002 Malignancies 1.52 [1.05–2.19] .027 1.36 [0.92–2.01] .118 1.34 [0.91–1.98] .142 Notes: F or nonbinary v ariables,
the hazard ratio
(HR)
corresponds to
the change per unit.
Bold entries
=
statistically significant. BMI
= body mass inde x; MN A = Mini Nutritional Assessment; CIRS = Cumulati ve
mortality in the obese group (26). The absence of excess mortality in patients with a BMI less than 20 kg/m2 may be
due to the strong impact of comorbidities (not necessarily associated with weight loss) on mortality also in the higher BMI categories. In simple words, the impact of comorbidities overshadows the impact of low body weight or weight loss. However, this explanation does not account for the survival advantage of patients with a high BMI. An “obesity paradox,” defined by better survival in “obese” patients (BMI > 30 kg/m2) than in “normal” (20–24.9 kg/
m2) or even “overweight” (BMI 25–29.9 kg/m2) patients,
has been reported in congestive heart failure, coronary heart disease, or chronic renal insufficiency (6,27–30). The obesity paradox observed in the study strikingly resembles the one seen in younger patients with severe disease(s), and seems distinct from the association of a low BMI with mortality in community-dwelling older subjects.
The mechanisms underlying this obesity paradox remain incompletely understood. Smoking could be involved by favoring both weight loss and mortality, but the observa-tions were unaffected by adjustment for smoking. Because of better survival in women, the obesity paradox could be explained by a shift in the gender ratio across BMI categories. However, it was confirmed when the analysis was restricted to women. The negative impact of obesity in younger adults is in part mediated by dyslipidemia and hypertension. The association between obesity and these risk factors progressively weakens with age (31). This explanation may account for a weak or absent, but not for an inverse association between obesity and mortality. Another proposal is that the adipose tissue mass remains associated with mortality or cardiovascular disease, but is no longer appropriately reflected by the BMI (32). Yet, it is hard to imagine an inverse association between BMI and adipose tissue mass that would account for the obesity paradox. Unintentional weight loss has been associated with long-term mortality in numerous studies (8,33,34). The obesity paradox could thus be explained by the effect of disease-related weight loss on both the BMI and mortality. In the context of the study, the group with the highest BMI would be the one where significant weight loss is least likely to have occurred. Disease-related weight loss most probably accounts for the higher prevalence of malignancies in the lower BMI categories. However, many other comorbidi-ties such as diabetes, hypertension, and heart failure were more frequent in the higher BMI categories, and the overall prevalence of comorbidities was similar or even higher in the higher BMI categories. Thus, better survival in patients with a high BMI is not accounted for by a lower disease load. The distinct effect of weight loss and comorbidities is also indirectly supported by the observation that weight gain is associated with better survival in patients with car-diovascular disease (34). Indeed, this “mirror image” obser-vation can hardly be explained by recovery from disease. Finally, the researchers have to consider the possibility that
obesity is a protective factor against mortality from acute diseases or comorbidities in the short term, even though it is an atherogenic risk factor in the long term. A higher adipose tissue or muscle mass may constitute a “nutritional reserve” when facing disease and/or malnutrition (6).
The strengths of this study are the random patient selection procedure, the extensive characterization of comorbidities, and complete long-term mortality follow-up. The researchers’ study has several limitations: body composition is missing for this cohort. The protective effect of higher BMI level might not be explained by an increased amount of adipose tissue, but rather by a higher level of lean mass (24). Several comorbidities were assessed retrospectively by chart review, leading to possible patient misclassification with respect to individual comorbidities. For instance the diagnosis of heart failure was not confirmed by echocardiography. However, these inaccuracies are unlikely to affect the conclusions, as they would be expected to affect the assessment of all patients, irrespective of their BMI category. In addition, functional and cognitive assessments were not included in these analyses. A previous article on the same cohort, which analyzed the etiology and severity levels of cognitive status, showed that dementia was not predictive of short or long term mortality (35). The role of renal function impairment remains uncertain, as the estimations of the GFR based on serum creatinine are biased by age, gender, and body weight and height. In the analysis a higher BMI was associated with a lower GFR calculated by the 4-parameter Modification of Diet in Renal Disease formula, and a higher GFR calculated by the Cockcroft–Gault formula. The latter was used in the mortality analysis, to favor the hypothesis that comorbidities account for the obesity paradox.
Irrespective of the underlying mechanisms, the research-ers’ observations have several practical implications. The obesity paradox may not be limited to mortality. Indeed, recent studies have suggested that in high-risk older persons obesity is associated with a lower prevalence of functional disabilities (26). It follows that the screening for obesity (at least as defined by a BMI ≥ 30 kg/m2) in hospitals or in
nursing homes (36) is unlikely to identify high-risk popula-tions, whether in terms of survival or functional capacities. Similarly, the inclusion of obesity in comorbidity scales such as the CIRS is unlikely to contribute to their performance as prognostic tools (19). The absence of survival difference between patients from the three lower BMI categories also has important implications. The researchers have previously shown that malnutrition, as diagnosed by the MNA, fails to predict mortality in old hospitalized patients (11). The MNA and other malnutrition diagnostic tools include a low BMI as an essential criterion. The present data suggest that the ina-bility of these tools to predict survival is related to the lack of survival difference between the lower BMI categories. In older hospitalized patients, the high prevalence of comor-bidities may put all patients with a BMI less than 27–30 kg/ m2 at the same high risk of all-cause death.
Supplementary Material
Supplementary material can be found at: http://biomedgerontology. oxfordjournals.org/
Funding
This work supported by grants from the Swiss National Science Foundation (3200B0-102069 to D.Z. and 320030-134973/1 to F.R.H. and U.M.V.) and the Swiss Foundation for Ageing Research (AETAS).
Acknowledgments
We thank the teams of Mrs. O. Baumer, L. Humblot, and M. Cos for their assistance.
References
1. Whitlock G, Lewington S, Sherliker P, et al. Body-mass index and cause-specific mortality in 900 000 adults: collaborative analyses of 57 prospective studies. Lancet. 2009;373(9669):1083–1096. 2. Berrington de Gonzalez A, Hartge P, Cerhan JR, et al. Body-mass
index and mortality among 1.46 million white adults. N Engl J Med. 2010;363(23):2211–2219.
3. Kalmijn S, Curb JD, Rodriguez BL, Yano K, Abbott RD. The asso-ciation of body weight and anthropometry with mortality in elderly men: the Honolulu Heart Program. Int J Obes Relat Metab Disord. 1999;23(4):395–402.
4. Janssen I, Katzmarzyk PT, Ross R. Body mass index is inversely related to mortality in older people after adjustment for waist circum-ference. J Am Geriatr Soc. 2005;53(12):2112–2118.
5. Fried LP, Kronmal RA, Newman AB, et al. Risk factors for 5-year mortality in older adults. JAMA. 1998;279(8):585–592.
6. Kalantar-Zadeh K, Horwich TB, Oreopoulos A, et al. Risk fac-tor paradox in wasting diseases. Curr Opin Clin Nutr Metab Care. 2007;10(4):433–442.
7. Romero-Corral A, Montori VM, Somers VK, et al. Association of bodyweight with total mortality and with cardiovascular events in coronary artery disease: a systematic review of cohort studies. Lancet. 2006;368(9536):666–678.
8. Bamia C, Halkjaer J, Lagiou P, et al. Weight change in later life and risk of death amongst the elderly: the European Prospective Investigation into Cancer and Nutrition-Elderly Network on Ageing and Health study. J Intern Med. 2010;268(2):133–144.
9. Wedick NM, Barrett-Connor E, Knoke JD, Wingard DL. The relation-ship between weight loss and all-cause mortality in older men and women with and without diabetes mellitus: the Rancho Bernardo study. J Am Geriatr Soc. 2002;50(11):1810–1815.
10. Vischer UM, Safar ME, Safar H, et al. Cardiometabolic determinants of mortality in a geriatric population: is there a “reverse metabolic syndrome”? Diabet Med. 2009;35(2):108–114.
11. Vischer UM, Frangos E, Graf C, et al. The prognostic significance of malnutrition as assessed by the Mini Nutritional Assessment (MNA) in older hospitalized patients with a heavy disease burden. Clin Nutr. 2012;31(1):113–117.
12. Zekry D, Frangos E, Graf C, et al. Diabetes, comorbidities and increased long-term mortality in older patients admitted for geriatric inpatient care. Diabet Med. 2012;38(2):149–155.
13. Zekry D, Herrmann FR, Grandjean R, et al. Demented versus non-demented very old inpatients: the same comorbidities but poorer func-tional and nutrifunc-tional status. Age Ageing. 2008;37(1):83–89. 14. Zekry D, Valle BH, Michel JP, et al. Prospective comparison of six
co-morbidity indices as predictors of 5 years post hospital discharge survival in the elderly. Rejuvenation Res. 2010;13(6):675–682. 15. Zekry D, Loures Valle BH, Lardi C, et al. Geriatrics index of
comorbid-ity was the most accurate predictor of death in geriatric hospital among six comorbidity scores. J Clin Epidemiol. 2010;63(9):1036–1044. 16. Rubenstein LZ, Harker JO, Salva A, Guigoz Y, Vellas B. Screening
for undernutrition in geriatric practice: developing the short-form
mini-nutritional assessment (MNA-SF). J Gerontol A Biol Sci Med
Sci. 2001;56(6):M366–M372.
17. Kaiser MJ, Bauer JM, Ramsch C, et al. Validation of the Mini Nutritional Assessment short-form (MNA-SF): a practical tool for identification of nutritional status. J Nutr Health Aging. 2009;13(9):782–788. 18. Vischer UM, Giannelli SV, Weiss L, Perrenoud L, Frangos E,
Herrmann FR. The prevalence, characteristics and metabolic con-sequences of renal insufficiency in very old hospitalized diabetic patients. Diabetes Metab. 2011;37(2):131–138.
19. Salvi F, Miller MD, Grilli A, et al. A manual of guidelines to score the modified cumulative illness rating scale and its validation in acute hospitalized elderly patients. J Am Geriatr Soc. 2008;56(10): 1926–1931.
20. Grabowski DC, Ellis JE. High body mass index does not predict mor-tality in older people: analysis of the Longitudinal Study of Aging. J
Am Geriatr Soc. 2001;49(7):968–979.
21. Grabowski DC, Campbell CM, Ellis JE. Obesity and mortality in elderly nursing home residents. J Gerontol A Biol Sci Med Sci. 2005;60(9):1184–1189.
22. van Uffelen JG, Berecki-Gisolf J, Brown WJ, Dobson AJ. What is a healthy body mass index for women in their seventies? Results from the Australian longitudinal study on women’s health. J Gerontol
A Biol Sci Med Sci. 2010;65(8):847–853.
23. Nybo H, Petersen HC, Gaist D, et al. Predictors of mortality in 2,249 nonagenarians–the Danish 1905-Cohort Survey. J Am Geriatr Soc. 2003;51(10):1365–1373.
24. Volpato S, Romagnoni F, Soattin L, et al. Body mass index, body cell mass, and 4-year all-cause mortality risk in older nursing home resi-dents. J Am Geriatr Soc. 2004;52(6):886–891.
25. Thinggaard M, Jacobsen R, Jeune B, Martinussen T, Christensen K. Is the relationship between BMI and mortality increasingly U-shaped with advancing age? A 10-year follow-up of persons aged 70-95 years.
J Gerontol A Biol Sci Med Sci. 2010;65(5):526–531.
26. Kaiser R, Winning K, Uter W, et al. Functionality and mortality in obese nursing home residents: an example of ‘risk factor paradox’? J
Am Med Dir Assoc. 2010;11(6):428–435.
27. Oreopoulos A, Padwal R, Norris CM, Mullen JC, Pretorius V, Kalantar-Zadeh K. Effect of obesity on short- and long-term mortality postcoro-nary revascularization: a meta-analysis. Obesity. 2008;16(2):442–450. 28. McAuley PA, Myers JN, Abella JP, Tan SY, Froelicher VF. Exercise
capacity and body mass as predictors of mortality among male veter-ans with type 2 diabetes. Diabetes Care. 2007;30(6):1539–1543. 29. Curtis JP, Selter JG, Wang Y, et al. The obesity paradox: body mass
index and outcomes in patients with heart failure. Arch Intern Med. 2005;165(1):55–61.
30. Kapoor JR, Heidenreich PA. Obesity and survival in patients with heart failure and preserved systolic function: a U-shaped relationship.
Am Heart J. 2010;159(1):75–80.
31. Vyssoulis G, Karpanou E, Adamopoulos D, Tzamou V, Stefanadis C, Vischer UM. Effect of age on interdependence and hierarchy of cardiovascular risk factors in hypertensive patients. Am J Cardiol. 2011;108(2):240–245.
32. Agarwal R, Bills JE, Light RP. Diagnosing obesity by body mass index in chronic kidney disease: an explanation for the “obesity para-dox?”. Hypertension. 2010;56(5):893–900.
33. Ingram DD, Mussolino ME. Weight loss from maximum body weight and mortality: the Third National Health and Nutrition Examination Survey Linked Mortality File. Int J Obes. 2010;34(6):1044–1050. 34. Myers J, Lata K, Chowdhury S, McAuley P, Jain N, Froelicher V. The
obesity paradox and weight loss. Am J Med. 2011;124(10):924–930. 35. Zekry D, Herrmann FR, Graf CE, et al. Mild cognitive impairment,
degenerative and vascular dementia as predictors of intra-hospital, short- and long-term mortality in the oldest old. Aging Clin Exp Res. 2011;23(1):60–66.
36. Lapane KL, Resnik L. Obesity in nursing homes: an escalating prob-lem. J Am Geriatr Soc. 2005;53(8):1386–1391.