I
nfluenza is often seen as an unprob-lematic and self-limiting disease de-spite putting a high burden on patients as well as being of high socioeconomic rel-evance to societies [1]. It continues to be a considerable health problem in Eu-rope. Influenza is a major cause of mor-bidity and mortality affecting up to 25% of the population each year [2]. The costs of influenza in Germany in 1996 came to nearly € 2.5 billions. The bulk of the indirect costs is due to inability to work [1]. The typical case of influenza may be characterized by the abrupt on-set of fever, sore throat, nonproductive cough, myalgias, headache, and malaise. Symptoms usually last for 5–6 days. El-derly and other high-risk persons are especially vulnerable to the serious com-plications of influenza [2]. The estimated influenza incidence in Germany was 4 million cases in 1996 [1].Vaccination is an effective interven-tion reducing mortality and morbidity of influenza especially in elderly and patients with high risk conditions [3]. Vaccination can prevent about 50% of deaths from pneumococcal disease and 80% of deaths from influenza-related complications in the elderly [4]. In ad-dition to providing substantial health benefits, vaccination may also be asso-ciated with significant economic ben-efits, not only among the elderly but also among healthy working adults and even children. Healthy working adults traditionally have not been included among the priority groups targeted for annual influenza vaccination. Fewer than 25% of the persons aged between 18 and 64 years received an influenza vaccination during 1997. Nevertheless, the effect of influenza on this group is also substantial. Influenza vaccination of healthy working adults is, on average, cost-saving [2].
The German Standing Commis-sion on Immunization has recom-mended that the following groups re-ceive influenza vaccination: (1) persons who are ≥ 60 years of age, (2) people
Influenza Vaccination Coverage Rates in Germany
A Population-Based Cross-Sectional Analysis of the Seasons
2002/2003 and 2003/2004
Daniela Müller1, Peter Wutzler2, Thomas D. Szucs1
1 Institute for Social and Preventive Medicine, University of Zurich, Switzerland, 2 Institute for Virology and Antiviral Therapy, University Hospital Jena, Germany.
Received: 30. 8. 2004. Revision accepted: 30. 9. 2004.
ABSTRACT
Background und Purpose: Influenza continues to be a considerable health problem in Europe. Vaccination is the only preventive measure, reducing mor-tality and morbidity of influenza in all age groups. The objectives of this survey were to assess the level of influenza vaccination coverage in the 2002/2003 season compared with the 2003/2004 season in Germany, to understand the driving forces and barriers to vaccination, and to determine vaccination inten-tions for the following winter.
Methods: The authors conducted a random-sampling, telephone-based household survey among noninstitutionalized individuals representative of the population aged ≥ 14. The surveys for 2002/2003 and 2003/2004 used the same questionnaire and were subsequently pooled. Four target groups were deter-mined for analysis: (1) persons aged ≥ 60; (2) people working in the medical field; (3) persons suffering from chronic illness; and (4) a group composed of persons aged ≥ 60 or working in the medical field or suffering from a chronic illness.
Results: The overall sample consisted of 4,011 people. The influenza vacci-nation coverage rate in Germany increased from 22.3% in 2002/2003 to 25.1% in 2003/2004. This increase is not significant. The most frequent reasons for being vaccinated given by vaccinees were: influenza considered to be a serious illness, which people wanted to avoid (90.1%), having received advice from the family doctor or nurse to be vaccinated (71.3%), and not wanting to infect fam-ily and friends (70.4%). Reasons for not being vaccinated mentioned by people who have never been vaccinated were: thinking about it, however, not being vaccinated in the end (47.7%), not expecting to catch influenza (43.6%), and not having received a recommendation from the family doctor to be vaccinated (36.6%). Options encouraging influenza vaccination are: recommendation by the family doctor or nurse (66.6%), more available information on the vaccine regarding efficacy and tolerance (54.2%), and more information available about the disease (52.4%).
Conclusion: The vaccination coverage in the 2003/2004 season increased in comparison to the 2002/2003 season, although not significantly. The family doctor is the most important source of encouragement for people to be vacci-nated against influenza. It seems that the public would be more likely to be vaccinated if they had more information on the efficacy and tolerance of the vaccine, as well as the disease. It is therefore suggested that family doctors be better informed on influenza vaccine and the disease itself, so that they can ac-tively inform their patients on these topics.
Key Words: Influenza · Vaccination · Coverage · Germany · Health care · Elderly Med Klin 2005;100:6–13. DOI 10.1007/s00063-005-1113-2
with a higher health risk condition (chronic lung, heart, liver and kidney eases, diabetes and other metabolic dis-eases, immunodeficiency, HIV infection as well as persons living in institutions), (3) people with an increased professional risk of influenza infection (health care professionals, persons who have exten-sive contacts with the general public as well as people at risk of infecting unvac-cinated persons with a higher health risk). Vaccinations are administered free of charge [5]. Van Essen et al. showed that in the year 2000 in Germany 186 doses of influenza vaccine were distrib-uted per 1,000 population [6].
In general, population-based studies of influenza vaccination coverage for a country do not exist. A Canadian study found 13.8% influenza vaccination coverage in fall and winter 1990–1991 [7]. Most studies on influenza vaccina-tion coverage investigate specific groups such as the elderly [8–17], patients from general practices [18, 19], or hospital-ized patients [20].
The primary aim of this study was to identify the level of influenza vacci-nation coverage in the 2002/2003 and 2003/2004 seasons in Germany. We also wanted to know whether coverage was associated with demographic pa-rameters.
The second objective was to un-derstand the determinants for being vaccinated or not and to obtain the population’s opinion on influenza and vaccination.
A further objective was to exam-ine the options which encourage peo-ple to be vaccinated and to find out their vaccination intentions for the following winter.
Methods
This study is a population-based survey performed during two influenza sea-sons, 2002/2003 and 2003/2004, in Germany. The questionnaire was cir-culated via telephone omnibus among noninstitutionalized individuals repre-sentative of the population, between December and January.
The questions were identical in both seasons. The list of possible an-swers with respect to determining driv-ing forces and barriers to vaccination, as well as encouragements to be vacci-nated, is inserted in Table 1.
For each respondent, the following parameters were collected in the survey: gender, age, size of household, house-hold income, educational level, and whether participants work in a medical field or suffer from a chronic illness
(such as heart or lung disease, diabetes, or others). As well as studying each pa-rameter separately, we also defined four target groups based on the recommen-dations in Germany at the time of the survey. The target groups were:
ZUSAMMENFASSUNG
Influenza-Durchimpfungsraten in Deutschland. Eine bevökerungsbezo-gene Querschnittsuntersuchung der Jahre 2002/2003 und 2003/2004
Hintergrund und Ziel: Die Influenza ist ein bedeutendes Gesundheitspro-blem in Europa. Die Impfung ist die einzige präventive Maßnahme, welche die Morbidität und Mortalität der Influenza in allen Alterskategorien zu reduzieren vermag. Ziele der vorliegenden Untersuchung waren, die Durchimpfungsraten in der Saison 2003/2004 zu erheben und mit der Saison 2002/2003 in Deutsch-land zu vergleichen, die Beweg- and Ablehnungsgründe der Impfung zu verste-hen sowie die Absicht zu erfassen, im nächsten Jahr geimpft zu werden.
Methodik: Die Autoren führten eine zufallsgesteuerte Telefonbefragung in Haushalten durch. Zielgruppen waren nichtinstitutionelle Personen, repräsen-tativ für die Alterskategorien ≥ 14 Jahre. Die Untersuchungen der beiden Sai-sons waren identisch und konnten gepoolt werden. Vier spezifische Zielgrup-pen wurden für diese Untersuchung definiert: 1. Personen ≥ 60 Jahre, 2. Perso-nen, die in medizinischen Einrichtungen arbeiten, 3. Personen mit chronischen Erkrankungen sowie 4. Personen, die zu einer oder mehreren der Gruppen 1–3 gehören.
Ergebnisse: Die Stichprobe umfasste 4 011 Personen. Die Durchimpfungs-rate in Deutschland nahm von 22,3% in der Saison 2002/2003 auf 25,1% in der Saison 2003/2004 zu. Diese Zunahme ist statistisch nicht signifikant. Die häu-figsten Gründe für eine Impfung waren: 1. Influenza ist eine schwerwiegende Erkrankung, welche vermieden werden sollte (90,1%), 2. die Empfehlung des Arztes oder einer Krankenschwester, sich impfen zu lassen (71,3%), und 3. die Verwandten und Freunde nicht anstecken zu wollen (70,4%). Die Gründe für eine Ablehnung der Impfung bei Personen, die noch nie geimpft wurden, wa-ren: 1. Man denkt daran, aber schlussendlich lässt man sich nicht impfen (47,7%), 2. man erwartet keine Ansteckung (43,6%), 3. man erhielt keine Empfehlung seitens des Arztes oder einer Krankenschwester (36,6%). Die wichtigsten Op-tionen zur Veranlassung einer Grippeimpfung sind: 1. Empfehlungen durch den Arzt oder die Krankenschwester (66,6%), 2. mehr Informationen hinsichtlich der Wirksamkeit und Verträglichkeit der Impfung (54,2%) und 3. mehr Infor-mationen über die Erkrankung (52,4%).
Schlussfolgerung: Der Durchimpfungsgrad nahm in der Saison 2003/2004 im Vergleich zur 2002/2003 zu, obschon nicht signifikant. Der Hausarzt scheint der wichtigste Ansprechpartner zu sein, der die Bevölkerung zu einer vermehr-ten Grippeimpfung motivieren kann. Es scheint, dass die Bevölkerung mehr Informationen hinsichtlich der Wirksamkeit und Verträglichkeit der Impfung sowie über die Influenza benötigt, um sich impfen zu lassen. Deshalb wird Grundversorgern empfohlen, sich weiterhin ausführlich über die Erkrankung und die Impfung zu informieren und entsprechend ihre Zielgruppen vermehrt zu informieren.
Schlüsselwörter: Influenza · Impfung · Durchimpfungsraten · Deutschland · Gesundheitsversorgung
Med Klin 2005;100:6–13. DOI 10.1007/s00063-005-1113-2
•
all individuals ≥ 60 years of age,
•
all individuals who suffer from a chronic illness,
•
all individuals who work in the med-ical field,
•
all individuals aged ≥ 60 or who suf-fer from a chronic illness or who work in the medical field.
The data were pooled and weighted for age and gender. The statistical
evalua-tion has been performed with the statistic program SPSS (Statistical Pack-age for the Social Sciences). Bivariate associations of categorical variables were analyzed using χ2-tests. In case of one continuous variable, a t-test or Mann-Whitney test was used, depend-ing on the kind of distribution ob-served. In all cases, p = 0.05 was used as the level of statistical significance.
Where applicable, odds ratios were cal-culated from 2 × 2 tables, including 95% confidence intervals.
Results
Demographic Data
The overall sample consisted of 4,011 persons. An overview of the sample is given in Table 2. The samples are repre-sentative of the country’s adult popula-tion.
Vaccination Rate
The vaccination rate for 2002/2003 was 22.3% and 25.1% for 2003/2004 (Figure 1). The influenza vaccination rate increased by 2.8%. This increase is not significant (p = 0.054).
For the subsequent winter (2004/2005) 44% of respondents in-tend to be vaccinated against influenza.
Vaccination Coverage in Target Groups
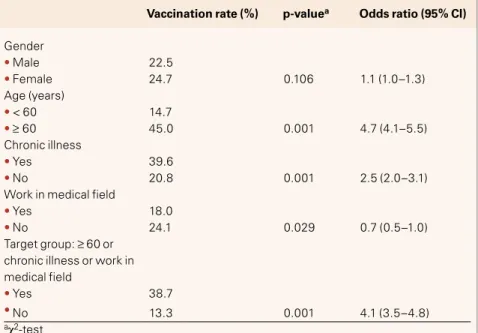
Pooling both influenza seasons to-gether, the vaccination coverage rate for the group aged ≥ 60 was 45.0%, significantly different from the popu-lation < 60, where the vaccination coverage rate reached 14.7% (p = 0.001; Table 3).
The group suffering from chronic illness recorded a significantly higher vaccination coverage rate than the group not suffering from chronic ill-ness (39.6% and 20.8%; respectively; p = 0.001).
Working in the medical field does not seem to be a driving force for vac-cination, as the vaccination coverage rate in this population (18.0%) is lower than the coverage rate in the non-med-ical-professional group (24.1%). The difference between the two groups is significant (p = 0.029). Concerning the people who are ≥ 60 or suffer from chronic illness or work in the medical field, the vaccination rate is 38.7%. This is significantly higher than the people not included in that group (13.3%; p = 0.001).
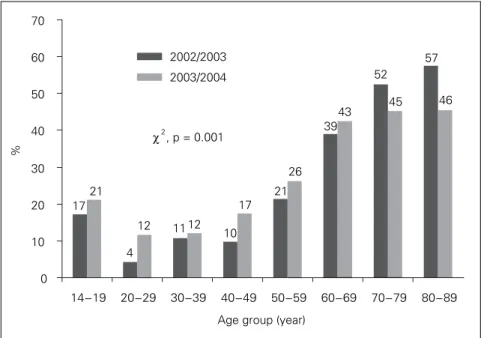
The vaccination coverage rate is not associated with gender, but with age. People ≥ 60 have an odds ratio of 4.7 for being vaccinated versus those < 60. The influence of age is also clear-ly apparent in Figure 2: the older the Why did you get vaccinated this winter?
• Because it’s free: the Social Security pays for it
• So that I do not pass the flu bug to my family and friends
• Because the flu is a serious illness and I did not want to get it
• The doctor at work offered to do it for me
• My family doctor/nurse advised me to do it
• My pharmacist advised me to do it
• Because of my age
• Because I am not in very good health
• To prevent the flu from interrupting my professional activities
• Because it is required/indicated for my job
• Because I got the flu last year
• Other reasons
• Don’t know/no answer
Why do you not get vaccinated against the flu? • I don’t think I am very likely to catch the flu
• I thought about it, but I didn’t end up getting vaccinated
• My family doctor has never recommended it to me
• My doctor at work has never recommended it to me
• My pharmacist has never recommended it to me
• It is not a serious enough illness
• I do not think the vaccine is effective enough
• I do not like injections/needles
• I have never considered it before
• There is a new treatment which helps cure the flu
• I am too young to be vaccinated
• I am against vaccinations
• It is too complicated to get vaccinated
• It is too expensive, it is not reimbursed
• Other reasons
• Don’t know/no answer
Which of the following options would encourage you to be vaccinated against the flu?
• If I could be vaccinated at work
• If my doctor/nurse recommended it to me
• If my pharmacist recommended it to me
• If there were other ways of administering the vaccine (orally, injection without a needle, etc.)
• If it were cheaper
• If I had more information on the vaccine regarding efficacy and tolerance
• If I knew more about the disease
• I would not change my mind, I would never be vaccinated
• Other
• Don’t know/no answer
people, the higher the vaccination cov-erage rate. Comparing the evolution of vaccination coverage rate between 2003/2004 and 2002/2003 for age
groups, it is striking that all age groups < 70 increased vaccination coverage rate while there was a decrease for the groups aged ≥ 70.
People suffering from chronic ill-ness have an odds ratio for vaccination of 2.5 over people with no chronic health problems. Medical professionals have less probability of being vaccinat-ed than people not working in the medical field: the odds ratio for vacci-nation equals 0.7.
Demographics and Vaccination Rates
The education level, the size of house-hold and the househouse-hold income have a significant influence on vaccination coverage (Table 4). People with a low income (< 1,000 € per month) have a higher vaccination coverage rate (31.7%) than those with an income ≥ 3,000 € per month (17.9%). Our sur-vey also demonstrates that small house-holds (one to two members) have less influenza vaccine uptake than larger households (three or more). People with a high school examination have a lower vaccination rate than people who went to primary school without fur-ther professional training (15.4% vs. 33.5%). In our survey, the respondents with low social grade (low educational level, low income) seemed to be better vaccinated than people with high social grade.
Questions about the Vaccination
For those who have been vaccinated during the last season, the most fre-quently stated reasons for being vacci-nated were the fact that influenza is con-sidered to be a serious illness, which people want to avoid (90.1%), advice from the family doctor or nurse (71.3%), and not wanting to pass flu to family and friends (70.4%; Table 5).
For those who have never been vaccinated, reasons against vaccination were the fact that people think about it, but do not end up being vaccinated (47.7%), not expecting to catch influ-enza (43.6%), and the fact that the fam-ily doctor has never recommended it (36.6%; Table 6).
More than 50% of the respondents agreed with the following opinions about the vaccine:
•
You can catch the flu even if you are vaccinated against it.
•
If you catch the flu after having had the vaccine, the infection is less se-vere.
Table 2. Overview of samples.
Total 1,999 2,012 4,011
Mean age (years) 46.9 46.8 46.8
Age ≥ 60 years 29.6% 29.6% 29.6%
Male 47.8% 47.8% 47.8%
Work in medical field 6.4% 6.4% 6.4%
Chronic illness Not available 23.3% 23.3%
Target group: ≥ 60 or chronic illness 35.4% 46.2% 40.8% or work in medical field
2002/2003 2003/2004 Total
Table 3. Vaccination coverage in target groups. CI: confidence interval.
Gender • Male 22.5 • Female 24.7 0.106 1.1 (1.0–1.3) Age (years) • < 60 14.7 • ≥ 60 45.0 0.001 4.7 (4.1–5.5) Chronic illness • Yes 39.6 • No 20.8 0.001 2.5 (2.0–3.1)
Work in medical field
• Yes 18.0
• No 24.1 0.029 0.7 (0.5–1.0)
Target group: ≥ 60 or chronic illness or work in medical field
• Yes 38.7
• No 13.3 0.001 4.1 (3.5–4.8)
aχ2-test
Vaccination rate (%) p-valuea Odds ratio (95% CI) No, never
No, but in the past Yes, not first time
Yes, first time
% 60 50 40 30 20 10 0 2002/2003 2003/2004 χ2, p = 0.054 3 52 52 23 22 25 20
•
The side effects associated with the vaccine (fever, headache, etc.) are ac-ceptable.
•
It is important to get the influenza vaccine each year.
More than 50% of the participants did not agree to the following opinions: the vaccine is not useful if you are in good health, and if you have the vac-cine, you will not catch influenza (Ta-ble 7).
Options which encourage vacci-nation against influenza are: recom-mendation by the family doctor (66.6%), more information about the vaccine regarding efficacy and toler-ance (54.2%) and about the disease (52.4%; Table 8).
DISCUSSION
This survey has been performed inter-nationally (France, United Kingdom, Italy, Spain, Germany) for two consecu-tive seasons, 2002/2003 and 2003/2004. We believe a telephone survey is an ap-propriate method in establishing influ-enza vaccination coverage rates in dif-ferent groups in the population. It can be started at short notice, it is an easy way to reach a large number of subjects rapidly, does not extend over more than a few weeks and can be repeated over several influenza seasons.
Several limitations of the present evaluation are acknowledged. The most important potential reason of selection bias despite correct sampling is nonre-sponse. Comparisons of face-to-face, mailed and telephone surveys address-ing health-related issues showed small differences between modes of adminis-tration and small nonresponse effects with respect to prevalence estimates [21, 22]. Nonresponse in telephone surveys was found to be less con-tent-oriented than in mailed surveys [23]. Also, bias due to different sociode-mographic characteristics of persons inaccessible by telephone affected re-ports of illness and related use of ser-vices only marginally, if the general population was addressed and if tele-phone coverage was at least 90% [21, 24]. Persons living in institutions could not be included, which would be criti-cal in the study of a disease affecting the higher ages differentially or directly causing institutionalization. The fact for not having asked the chronic illness
question in season 2002/2003 may have impacted chronic illness figures. However, it is hypothesized that the
impact is minimal as the responses would have been similar for both sea-sons. One bias could emerge from
17 4 11 10 21 39 52 57 21 12 12 17 26 43 45 46 0 10 20 30 40 50 60 70 14−19 20−29 30−39 40−49 50−59 60−69 70−79 80−89 Age group (year)
%
2002/2003 2003/2004
χ2
, p = 0.001
Figure 2. Profile of vaccinated population by age groups. Table 4. Demographics and vaccination rates.
Size of household (members)
• 1 10.5
• 2 13.1
• 3 26.6
• 4 32.4
• 5 20.2 0.001
Educational level of respondent
• Elementary, primary school 33.5 without further professional training
• Elementary, primary school 25.8 with further professional training
• Intermediate, high school 23.6 without high school examination
• High school examination; 15.4 qualification for the technical college
• Higher education (university, 28.2
academy, technical college)
• Still go to school 25.4 0.003
Household income per month
• < 1,000 € 31.7 • 1,000 up to < 1,500 € 27.5 • 1,500 up to < 2,000 € 28.9 • 2,000 up to < 2,500 € 20.5 • 2,500 up to < 3,000 € 21.0 •≥ 3000 € 17.9 0.001 aχ2-test
over- or underreporting of chronic ill-ness.
We estimate, for Europe, that ap-proximately 22% and 23% of the popu-lation studied > 15 years of age had received influenza vaccination for the 2002/2003 and 2003/2004 influenza seasons, respectively [25]. This percent-age corresponds approximately to the 20% maximum estimate for the
immu-nization rate for the entire population calculated from the number of vaccine doses sold for the 2002–2004 immuni-zation period, assuming all doses sold were given (90 million doses for the 2002–2004 influenza vaccination peri-od in Europe; data provided by the suppliers) [26].
Vaccination coverage in Germany increased during the 2003/2004 season
relative to the 2002/2003 season (25.1% vs. 22.3%), but the increase is not statis-tically significant. One of the major ex-planations of this increase can be seen in the increased efforts from the Ger-man health authorities to inform their people on the dangers of influenza.
People who were previously vacci-nated picked up vaccination again while first-time users increased in par-Table 5. Questions asked to the population who has been vaccinated: “Why did you get vaccinated this winter?” The most frequently stated reasons (%).
Because influenza is a serious illness and I did not want to get it 90.1a 86.9a 88.9a 92.3a
My family doctor/nurse advised me to do it 71.3a 48.1 76.3a 76.3a
So that I do not pass the influenza bug to my family and friends 70.4a 53.4a 70.8a 66.8a
Because of my age 40.3 27.4 39.8 56.9
Because it’s free: the Social Security pays for it 34.5 45.8 29.3 27.7
Because I am not in very good health 29.2 23.2 48.0 35.8
To prevent influenza from interrupting my professional activities 26.5 40.2 17.8 9.6
Because it is required/indicated for my job 19.0 68.1a 14.8 6.6
The doctor at work offered to do it for me 14.9 34.4 8.4 10.2
amain three reasons stated amongst the different groups
All Medical staff Chronic illness ≥ 60 years
Table 6. Questions asked to the population who has never been vaccinated: “Why do you not get vaccinated against influenza?” The most frequently stated reasons (%).
I thought about it, but I didn’t end up getting vaccinated 47.7a 42.0a 49.9a 48.1a
I don’t think I am very likely to catch the flu 43.6a 43.9a 36.0a 45.7a
My family doctor has never recommended it to me 36.6a 43.3a 27.8 29.3
It is not a serious enough illness 36.2 38.7 31.9a 29.5
My pharmacist has never recommended it to me 34.9 37.4 25.4 15.7
I have never considered it before 30.8 27.4 28.6 31.9a
I do not like injections/needles 30.5 22.0 29.0 25.1
I do not think the vaccine is effective enough 27.7 31.0 29.1 26.1
My doctor at work has never recommended it to me 21.2 36.1 14.4 9.9
amain three reasons stated amongst the different groups
All Medical staff Chronic illness ≥ 60 years
Table 7. Opinions about influenza vaccine (%).
You can catch influenza even if you are vaccinated against it 33.9 44.8 13.8 5.7 1.8 If you catch influenza after having had the vaccine, the infection is 27.6 41.3 17.7 9.3 4.1 less severe
The side effects associated with the vaccine (fever, headache, etc.) 24.3 37.6 21.5 10.6 6.0 are acceptable
If you have the vaccine, you won’t catch influenza 8.5 25.7 36.8 27.2 1.8 The influenza vaccine is not useful if you are in good health 17.6 26.4 29.2 25.5 1.3 It is important to get the flu vaccine each year 25.9 28.3 29.4 15.4 1.0
Totally Quite Don’t really Don’t Don’t agree agree agree agree at all know
allel (Figure 1). To be noted is that the increase is situated in all but two age groups (70–79 and 80–89). This means that the uptake of influenza vaccination was more pronounced in the age popu-lation not recommended for vaccina-tion (people < 60) than in the age-pop-ulation recommended for vaccination (people ≥ 60). Regarding the surveyed populations across Europe, the German population ≥ 14 has the highest vacci-nation coverage rate in Europe. This is due to a higher than average uptake in the adult working population when compared with other European coun-tries. By contrast, the population ≥ 60 has the lowest vaccination coverage in Europe [25].
For the subsequent winter (2004/ 2005) 44% of the individuals surveyed intend to be vaccinated against influ-enza. This is higher than the current overall population coverage rate, im-plying that more people intend to be vaccinated during the winter 2004/2005 than were vaccinated dur-ing winter 2003/3004.
The most important predisposing factors affecting vaccination rate are age (being old) and suffering from chronic illness. These two groups of people are also the two main target groups mentioned in the German rec-ommendations. This demonstrates that the German doctors identify the peo-ple which need vaccination. Kamal et al. also showed that comorbidities in-fluence vaccination rate [4]. Other fac-tors influencing vaccination are size of household, household income, and ed-ucational level.
The assumption that health care workers have a higher vaccination rate
than non-health care workers is not the case in Germany. The health care pro-fessionals’ vaccination rate is low (18%). Rehmet et al. showed this tendency as well (7% of health care workers in 1999 were immunized) [5]. This is opposite to the fact that the health care profes-sionals are at increased risk of influenza infection and could potentially trans-mit the disease to fragile patients in hospitals.
The survey demonstrated that there are some clear reasons driving vaccina-tion for people who had an influenza vaccine. The three most important mentioned were: influenza being con-sidered a serious illness, family doctor or nurse actively recommending it, and not wanting to pass flu to family and friends. The three main reasons for not being vaccinated noted by those who have never been vaccinated were: thinking about it but not being vacci-nated in the end, not expecting to catch influenza, and not being recommended to have a vaccination by the family doctor or nurse.
Both those being vaccinated and those who have never been vaccinated note the doctor or nurse as people playing a key role in public vaccination behavior. In the vaccinated group, health care professionals were able to stimulate their patients toward vaccina-tion by active recommendavaccina-tion where-as in the nonvaccinated group, omitting to recommend vaccination had a nega-tive effect on uptake. This clearly indi-cates the key role of health care work-ers in vaccination uptake.
The family doctor is the most im-portant person to encourage people to be vaccinated against influenza; this was
also confirmed by Kamal et al. [4], Kro-neman et al. [3], and Rehmet et al. [5]. Rehmet et al. demonstrated that hav-ing a family doctor increased the vac-cination rate and that family physicians performed 93% of the vaccinations. This indicates that active recommenda-tion from the family doctor could re-ally impact vaccine uptake. This is con-firmed by the surveyed people them-selves, who state that an active recom-mendation by their doctor would indeed encourage them to be vacci-nated (Table 8).
Further referring to Table 8 shows that the patients would like more in-formation on influenza as a disease and on influenza vaccines, so as to be vac-cinated. We therefore suggest that fam-ily doctors be better informed about the influenza vaccine and the disease itself, so that they can actively inform their patients about these topics and recommend vaccination accordingly. This could lead to an increase in vac-cine uptake.
In May 2003, through the World Health Assembly, the WHO passed a resolution on prevention and control of influenza pandemics and annual epi-demics. The resolution urges member states where national influenza recom-mendations for people at risk (elderly and persons with underlying diseases) exist, to attain a vaccination coverage rate in the elderly of 50% in 2006 and 75% in 2010 (Resolution of the World Health Assembly WHA 56.19, Preven-tion and control of influenza pandem-ics and annual epidempandem-ics, 56th WHA, 10th plenary meeting, May 28, 2003).
In the context of this paper, we compared this objective with the situa-Table 8. Questions about the vaccination. Options encouraging to be vaccinated against influenza (%).
If my family doctor/nurse recommended it to me 66.6a 55.0a 70.4a 71.9a
If I had more information on the vaccine regarding efficacy and tolerance 54.2a 44.0a 54.1a 49.0a
If I knew more about the disease 52.4a 39.6 50.8a 48.4a
If it were cheaper or reimbursed 42.0 36.6 44.7 36.5
If I could be vaccinated at work 39.8 48.3a 36.7 28.1
If there were other ways of administering the vaccine 39.3 29.3 40.0 40.2 (orally, injection without a needle, etc.)
If my pharmacist recommended it to me 29.8 24.4 35.5 36.2
amain three reasons stated amongst the different groups
All Medical Chronic ≥ 60
tion in Germany, considering that the elderly population was the population recommended for vaccination (i.e., those aged ≥ 60). When referring to Figure 2, the current situation in Ger-many is far from matching this objec-tive. Only the ≥ 70 years of age match the 50% for 2006 (and only during 2002/2003). The 60–69 are well under that objective. The situation is worse for 2003/2004, where no elderly group matches the 50% objective. In Europe, Germany is the country with the low-est vaccination coverage rate of the el-derly population [26]. A lot of efforts to increase vaccination coverage rate will therefore be necessary to match this objective. A stronger implementation of the current recommendations is needed: doctors should be made aware of their importance in this process. To improve the situation, doctors need to be educated on influenza and influenza vaccine benefits in order to be vacci-nated themselves first. Then, they need to be informed on the fact that they should actively recommend the vac-cine, as well as inform their patients on influenza and influenza vaccine. Active recommendation to the target groups in the recommendations could really impact vaccine uptake in these at-risk groups. They should also be made aware of the fact that patients are in demand for information on the diseases and vaccines. In general, more education on disease and influenza vaccine benefits should be made available.
These results are consistent with other studies showing the importance of physicians or health care personnel in motivating people for influenza vac-cination [3, 7, 11, 12].
Efforts must be made at all national and international levels to increase the coverage according to the WHO ob-jectives. Further research should be performed to provide consistent com-parison between different countries and seasons over time.
Acknowledgment
This study was made possible by an un-restricted research grant from Aven-tis-Pasteur MSD, Lyon, France.
References
1. Szucs TD, Behrens M, Volmer T. Costs of influenza in Germany 1996 – a cost-of-illness study. Med Klin 2001;96:63–70.
2. Nichol KL. Cost-benefit analysis of a strategy to vaccinate healthy working adults against influenza. Arch Intern Med 2001;161:749–59.
3. Kroneman M, Paget WJ, van Essen GA. Influenza vaccination in Europe: an inventory of strategies to reach target populations and optimise vaccination uptake. Eurosurveillance 2003;8:6.
4. Kamal KM, Madhavan SS, Amonkar MM. Determi-nants of adult influenza and pneumonia immuniza-tion rates. J Am Pharm Assoc 2003;43:403–11. 5. Rehmet S, Ammon A, Pfaff G, et al. Cross-sectional
study on influenza vaccination, Germany, 1999–2000. Emerg Infect Dis:in progress.
6. Van Essen GA, Palache AM, Forleo E, et al. Influenza vaccination in 2000: recommendations and vaccine use in 50 developed and rapidly developed countries. Emerg Infect Dis 2002 Dec;8(12):1442-7. Vaccine 2003;21:1780–5.
7. Duclos P, Hatcher J. Epidemiology of influenza vaccina-tion in Canada. Can J Public Health 1993;84:311–5. 8. Calder L. Influenza vaccination coverage in old
people’s homes in central Auckland. N Z Med J 1994;107:202.
9. Evans MR. Monitoring influenza immunisation uptake in nursing homes. Commun Dis Rep CDR Rev 1996;6:R170–2.
10. Ganguly R, Webster TB. Influenza vaccination in the elderly. J Investig Allergol Clin Immunol 1995;5:73–7.
11. Robert Koch-Institut. Influenza-Impfung bei medi-zinischem Personal. Epidemiol Bull 2001;44;335–6. 12. Honkanen PO, Keistinen T, Kivela SL. Factors asso-ciated with influenza vaccination coverage among the elderly: role of health care personnel. Public Health 1996;110:163–8.
13. Mulet Pons MJ, Sarrion Ferre MT, Barea Montoro A, et al. Evaluation of the completion of influenza vac-cination. Aten Primaria 1995;16:423–7.
14. Nicholson KG, Wiselka MJ, May A. Influenza vacci-nation of the elderly: perceptions and policies of general practitioners and outcome of the 1985–86 immunization programme in Trent, UK. Vaccine 1987;5:302–6.
15. Pregliasco F, Sodano L, Mensi C, et al. Influenza vac-cination among the elderly in Italy. Bull World Health Organ 1999;77:127–31.
16. Stehr-Green PA, Sprauer MA, Williams WW, et al. Predictors of vaccination behavior among persons ages 65 years and older. Am J Public Health 1990;80:1127–9.
17. Centers for Disease Control and Prevention. Influen-za and pneumococcal vaccination coverage levels among persons aged > 65 years – United States, 1973–1993. JAMA 1995;274:530–1.
18. Booth LV, Coppin R, Dunleavey J, et al. Implemen-tation of influenza immunisation policy in general practice: 1997 to 1998. Commun Dis Public Health 2000;3:39–42.
19. Hak E, Hermens RP, van Essen GA, et al. Popula-tion-based prevention of influenza in Dutch general practice. Br J Gen Pract 1997;47:363–6.
20. Centers for Disease Control and Prevention. Missed opportunities for pneumococcal and influenza vac-cination of Medicare pneumonia inpatients – 12 western states, 1995. MMWR Morb Mortal Wkly Rep 1997;46:919–23.
21. Marcus AC, Crane LA. Telephone surveys in public health research. Med Care 1986;24:97–112. 22. O’Toole BI, Battistutta D, Long A, et al. A comparison
of costs and data quality of three health survey methods: mail, telephone and personal home inter-view. Am J Epidemiol 1986;124:317–28.
23. Fowler FJ Jr, Gallagher PM, Stringfellow VL, et al. Using telephone interviews to reduce nonresponse bias to mail surveys of health plan members. Med Care 2002;40:190–200.
24. Ford ES. Characteristics of survey participants with and without a telephone: findings from the third Na-tional Health and Nutrition Examination Survey. J Clin Epidemiol 1998;51:55–60.
25. Szucs T, Verwee B, Müller D. Influenza vaccination coverage rates in Europe – A population-based cross-sectional analysis of the seasons 2002/3 2003/4: in progress.
26. European Vaccine Manufactures. Newsletter, Spring 2004 (www.evm-vaccines.org).
Address for Correspondence
Thomas D. Szucs, MD, MBA, MPH Institute for Social
and Preventive Medicine University of Zurich 8006 Zürich Switzerland