Research Paper
The Atypical Kinase RIOK1 Promotes Tumor Growth and
Invasive Behavior
Florian Weinberg
a,b,c, Nadine Reischmann
a,b,d, Lisa Fauth
e,#, Sanaz Taromi
f,#, Justin Mastroianni
b,f,#,
Martin Köhler
a,b,d, Sebastian Halbach
a,b,d, Andrea C. Becker
g,h, Niantao Deng
i,j, Tatjana Schmitz
a,
Franziska Maria Uhl
a,b,f, Nicola Herbener
e, Bianca Riedel
e, Fabian Beier
e, Alexander Swarbrick
i,j,
Silke Lassmann
c,e,k, Jörn Dengjel
c,g,h,l, Robert Zeiser
c,f, Tilman Brummer
a,b,c,k,⁎
a
Institute of Molecular Medicine and Cell Research (IMMZ), Faculty of Medicine, Albert-Ludwigs-University (ALU), Freiburg, Germany
b
Faculty of Biology, ALU, Freiburg, Germany
c
BIOSS Centre for Biological Signalling Studies, BIOSS, ALU, Germany
dSpemann Graduate School of Biology and Medicine (SGBM), ALU, Freiburg, Germany eInstitute for Surgical Pathology, Medical Center and Faculty of Medicine, ALU, Germany f
Department of Hematology and Oncology, University Medical Center, ALU, Freiburg, Germany
g
Freiburg Institute for Advanced Studies (FRIAS), ALU, Freiburg, Germany
h
Department of Dermatology, University Medical Center - ALU, Freiburg, Germany
i
Garvan Institute of Medical Research, Darlinghurst, New South Wales, Australia
j
St Vincent's Clinical School, Faculty of Medicine, UNSW, Sydney, Australia
kGerman Cancer Consortium (DKTK, Freiburg) and German Cancer Research Center (DKFZ), Heidelberg, Germany l
Department of Biology, University of Fribourg, Fribourg, Switzerland
a b s t r a c t
a r t i c l e i n f o
Article history: Received 24 August 2016
Received in revised form 7 April 2017 Accepted 7 April 2017
Available online 12 April 2017
Despite being overexpressed in different tumor entities, RIO kinases are hardly characterized in mammalian cells. We investigated the role of these atypical kinases in different cancer cells. Using isogenic colon-, breast- and lung cancer cell lines, we demonstrate that knockdown of RIOK1, but not of RIOK2 or RIOK3, strongly impairs prolif-eration and invasiveness in conventional and 3D culture systems. Interestingly, these effects were mainly ob-served in RAS mutant cancer cells. In contrast, growth of RAS wildtype Caco-2 and Bcr-Abl-driven K562 cells is not affected by RIOK1 knockdown, suggesting a specific requirement for RIOK1 in the context of oncogenic RAS signaling. Furthermore, we show that RIOK1 activates NF-κB signaling and promotes cell cycle progression. Using proteomics, we identified the pro-invasive proteins Metadherin and Stathmin1 to be regulated by RIOK1. Additionally, we demonstrate that RIOK1 promotes lung colonization in vivo and that RIOK1 is overexpressed in different subtypes of human lung- and breast cancer. Altogether, our data suggest RIOK1 as a potential therapeu-tic target, especially in RAS-driven cancers.
© 2017 The Authors. Published by Elsevier B.V. This is an open access article under the CC BY-NC-ND license (http://creativecommons.org/licenses/by-nc-nd/4.0/). Keywords:
Atypical kinase RIOK1 RAS
Three-dimensional (3D) tissue culture Xenografts
Bioluminescence imaging
1. Introduction
Kinases represent ideal targets for rational combination therapies due to their well-established druggability (Davis et al., 2011; Manning
et al., 2002). Many tumors, however, still express undruggable
oncoproteins and therefore the design of rational combination therapies that target several of their effector pathways or create a synthetic lethal condition in oncoprotein expressing cells has become a major topic in oncology (Horn et al., 2016).
Indeed, mutations in the three hitherto undruggable RAS proteins (K-Ras, N-(K-Ras, H-Ras) represent major drivers in cancer, leading to chronic activation of the PI3K-AKT and RAF-MEK-ERK pathways (Cox et al., 2014; Eser et al., 2013; Hayes et al., 2016; Rajalingam et al., 2007). There-fore, thefield has focused on efficient targeting of the kinases in the RAS effector pathways, in particular the MEK-ERK kinases and the PI3K-PDK axis (Eser et al., 2013; Hayes et al., 2016). Other effectors such as the JAK-STAT and NF-κB signaling pathways are also chronically activated in RAS mutant cells (Nicolae et al., 2016; Yang et al., 2015). Rational drug com-binations that exploit cancer specific vulnerabilities while avoiding toxic side-effects, however, will require an in-depth knowledge about the complexities of these pathways, in particular their intricate regulation by protein complex formation, feedback- and robustness phenomena (Fritsche-Guenther et al., 2011; Samatar & Poulikakos, 2014). A major step in this direction is therefore the identification of novel druggable
⁎ Corresponding author at: Institute of Molecular Medicine and Cell Research, Stefan-Meier Str. 17, 79104 Freiburg, Germany.
E-mail address:tilman.brummer@zbsa.de(T. Brummer).
#
These authors contributed equally.
http://dx.doi.org/10.1016/j.ebiom.2017.04.015
2352-3964/© 2017 The Authors. Published by Elsevier B.V. This is an open access article under the CC BY-NC-ND license (http://creativecommons.org/licenses/by-nc-nd/4.0/).
Contents lists available atScienceDirect
EBioMedicine
proteins such as kinases that could be further developed as additional targetable nodes in oncoprotein networks, for example by creating syn-thetic lethal constellations (Downward, 2015). Surprisingly, the majority of to date investigated kinases representsb10% of the kinome and has al-ready been known prior to the human genome project (Edwards et al., 2011). Thus, there is a long tail of under-researched and ill-defined ki-nases that might represent promising drug targets, either on their own or in combinatorial settings.
Previously, we have reported an RNA interference screen for kinases modulating aberrant signaling by the G13E mutant of the LET-60 RAS orthologue in Caenorhabditis elegans (Weinberg et al., 2014). This muta-tion affects the evolumuta-tionary conserved glycine residue that is frequently mutated in the RAS proteins in human tumors (Cox et al., 2014). In this screen, knockdown of RIOK1, a member of the RIO protein kinase fam-ily, led to a strong suppression of the well-characterized RASG13Edriven
multi-vulva phenotype.
RIO kinases represent a family of ancient atypical protein kinases found in all kingdoms of life. Compared to typical eukaryotic protein ki-nases, they lack substrate recognition sites and conserved activation loop motifs, although they hydrolyze ATP in vitro (Angermayr & Bandlow, 2002; Laronde-Leblanc et al., 2005; LaRonde-LeBlanc & Wlodawer, 2005a, b). The Saccharomyces cerevisiae orthologues, Rio1 and Rio2, were originally identified and characterized as essential genes for cell cycle progression and ribosomal biogenesis (Angermayr & Bandlow, 2002; LaRonde-LeBlanc & Wlodawer, 2005b; Vanrobays et al., 2003). Their abundance and kinase activity are critical for maturation of the 40S small ribosomal subunit (Ferreira-Cerca et al., 2014; Ferreira-Cerca et al., 2012). RIO proteins deficient for ATP-binding or for catalytic activ-ity impair ribosomal biogenesis and delay cell cycle exit (Baumas et al., 2012; Ferreira-Cerca et al., 2014; LaRonde-LeBlanc & Wlodawer, 2005a; Widmann et al., 2012). Several studies also confirmed these functions in mammalian cells for RIOK1, RIOK2 and, for the metazoan specific third member of the family, RIOK3 (Baumas et al., 2012; Widmann et al., 2012; Zemp et al., 2009). However, only a few substrates for RIO ki-nases have been identified so far (Iacovella et al., 2015; Takashima et al., 2015) and besides their involvement in ribosomal biogenesis, additional and potentially isoform-specific functions remain to be characterized.
Importantly, RIO kinases are overexpressed in various cancer types, although the functional significance remains unknown. RIOK1 overex-pression has been observed in colorectal cancer (Line et al., 2002) and in non-small cell lung cancer (NSCLC). In the latter, RIOK1 was co-overexpressed with the growth promoting proteins MAPJD (Myc-associated protein with JmjC domain) and PRMT5 (protein arginine methyl transferase 5) (Guderian et al., 2011; Suzuki et al., 2007). RIOK2 is overexpressed in glioblastoma (Read et al., 2013) and NSCLC
(Liu et al., 2016). RIOK3 has been associated with remodeling of
the cytoskeleton in hypoxia-driven metastases of breast cancer cells (Singleton et al., 2015). Together with our identification of RIOK1 as an enhancer of oncogenic RAS signaling in C. elegans (Weinberg et al., 2014), the aberrant expression of human RIO kinases in cancer, in par-ticular in carcinoma entities with high frequencies of RAS mutations, suggests a conserved role of RIO kinases in the RAS signaling network. Therefore, we characterized the role of these ill-defined atypical kinases in various mammalian tumor cell lines by functional and proteomic ap-proaches. We show that loss of RIOK1 expression specifically impairs the phenotype of RAS-transformed colon-, lung- and breast cancer cells. 2. Material and Methods
2.1. Tissue Culture and Generation of Inducible Knockdown Cell Lines The following cell lines were used in this study: NCI-H1299, MDA-MB-231, HEK293T, Plat-E, Caco-2, RKO, SW480, HCT116, K562 and MCF-10A. NCI-H1299, MDA-MB-231, SW480, RKO, HCT116, Caco-2, HEK293T and Plat-E cell lines were cultivated in DMEM with 10% FCS. K562 cells were cultivated in RPMI with 10% FCS. MCF-10A cells were
cultivated as described previously (Herr et al., 2011). NCI-H1299 cells were provided by the BIOSS toolbox, the central repository of the Centre for Biological Signalling Studies, University of Freiburg. RKO cells were a kind gift of Prof. Nils Blüthgen, Berlin (Fritsche-Guenther et al., 2011). The source of all other cell lines has been described elsewhere (Fritsche-Guenther et al., 2011; Herr et al., 2015; Herr et al., 2011; Leh-mann et al., 2016; Wöhrle et al., 2013). Knockdown cell lines were gener-ated by lentiviral infection using the pTRIPZ system (Dharmacon). Constructs used in this study: non-silencing: #RHS4743; shRIOK1_1: #RHS4696-200770120, shRIOK1_2: #RHS4696-200769994, shRIOK1_3: #RHS4696-200769020, shRIOK1_4: #RHS4696-200773349; shRIOK2: # RHS4696-201898580; shRIOK3: # RHS4430-200288078. Cell lines were established according to the instructions of the manufacturer and select-ed with puromycin (AppliChem). Cells were maintainselect-ed in respective medium with puromycin. For experiments, cells were induced in medi-um containing 0,5–1 μg/ml doxycycline (Sigma-Aldrich) without puro-mycin. For all experiments knockdown was induced 3–4 days in advance. Non-induced and non-silencing cells served as controls; induced non-silencing cells served as reference for quantifications.
2.2. Generation of cDNA Expression Vectors
The following cDNA expression vectors were used in this study: pBabe luciferase, pMIBerry RIOK1myc WT, pMIBerry RIOK1myc D324A, pMIBerry RIOK1myc D324N, pMIBerry RIOK1HA WT, pMIBerry RIOK3HA WT, pCMV e.V., pCMVFLAG-IKK (WT, KD, CA). RIOK1 cDNA with C-terminal myc-or HA-tag was amplified with Phusion polymerase (Ther-mo Scientific) from pDONR223 RIOK1 (Addgene) and cloned in pMIBerry (Röring et al., 2012) using the XhoI restriction site. D324 was mutated by side-directed-mutagenesis using respective primers and Pfu ultra plolymerase (Agilent Technologies). RIOK3 cDNA with C-terminal HA-tag was amplified from pDONR223 RIOK3 (Addgene) with Phusion poly-merase and cloned in pMIBerry using XhoI and BamHI. The pCMV IKK con-structs were obtained from Addgene (Mercurio et al., 1997). The empty pCMV control vector (e.V.) was generated from pCMV FLAG-IKK WT by restriction digest with HindIII and ClaI, excising FLAG-IKK, followed by a blunt ligation with T4. All constructs were verified by sequencing.
The following oligonucleotides were used in this study (in 5′ to 3′ direction):
RIOK1 XhoI fwd: TTCTCGAGGGCACCATGGACTACCGGCGGCTTCT CATG.
RIOK1 myc XhoI rev: TTCTCGAGGGGTTACAGGTCCTCCTCTGAGATCAG CTTCTGCTCTTTGCCTTTTTTCGTCTTGGCTGTCTTCTCCTTTCTTTTTTTCAC RIOK1 HA XhoI rev: CCTCCTCGAGGGGTTAAGCGTAGTCTGGGACGTCG TATGGGTATTTGCCTTTTTTCGTCTTGGCTGTCTTCTCCTTTCTTTTTTTCA CATGTTT
RIOK3 XhoI fwd: TTGGCCTCGAGGGCACCATGGATCTGGTAGGAGTG GCATCGCC
RIOK3 HA BamHI rev: CCCGGGGGATCCGTTGGATTAAGCGTAGTCTG GGACGTCGTATGGGTATTCATCATATAGTAGTGGTGGGTCTCCATCA TCTTTCAAAAATGAAGCAGC
RIOK1 D324A fwd: GCCAGACTTGTCCATGCAGCTCTCAGTGAATTTA ACATG.
RIOK1 D324A rev: CATGTTAAATTCACTGAGAGCTGCATGGACAAGTCT GGC
RIOK1 D324N fwd: CAGGATGCCAGACTTGTCCATGCAAATCTCAGTG AATTTAACATGCTG
RIOK1 D324N rev: CAGCATGTTAAATTCACTGAGATTTGCATGGACA AGTCTGGCATCCTG
2.3. Antibodies and Western Blot Analysis
Cell lysis, SDS-PAGE and Western blot were performed as described in (Herr et al., 2015). Blotted proteins were visualized and quantified
using a Fusion Solo (Peqlab) chemo-luminescence imager and the in-cluded software.
Antibodies (with RRID, if available) used in this study were: 14-3-3 (H8) (Santa Cruz AB_626618); 9E10 myc (generated in-house from the 9E10 hybridoma cell line (Evan & Hancock, 1985)), HA 3F10 (Roche Applied Science AB_390919), AKT (Cell Signaling AB_329827); phospho-AKT(S473) (Cell Signaling AB_2315049); Aurora A (Cell Signaling 12,100); Aurora B (BD AB_398396); Cyclin A2 (Cell Sig-naling AB_2071958), Cyclin B1 (Cell SigSig-naling 12,231); Cyclin D1 (Cell Signaling AB_10839128), Cyclin E2 (Cell Signaling AB_2071197); CDK1 (Cell Signaling AB_2074795), phospho-CDK1 (Y15) (Cell Signal-ing AB_331460); FLAG (M2) (Sigma-Aldrich AB_439685), pIκBα S32 (Cell Signaling AB_561111), IκBα (Cell Signaling AB_331623); MTDH (Invitrogen AB_2533475); Lamin B (D9V6H) (Cell Signaling 13,435); P65 (Cell Signaling AB_10859369); phospho-P65 (Ser536) (Cell Signaling AB_331284); RIOK1 (abcam AB_2042809); RIOK2 (abcam AB_2042810); RIOK3 (SUDD (RS-31)) (Santa CruzAB_2178113); Stathmin1 (Cell Signaling 3352); phospho-Stathmin1 (S38) (Cell Sig-naling AB_10544408); Tubulin (B5-1-2) (Santa Cruz AB_628410). Sec-ondaryα-mouse HRP, α-rabbit HRP and α-goat HRP antibodies were purchased from Santa Cruz. Bay 11–7082 was purchased from SelleckChem.
Western Blots were developed with the PeqlabTM Fusion Solo and densitometrically analyzed with the Fusion software (ver. 16.08). Quan-tification for Western Blots is shown in Table S4.
2.4. Co-immunoprecipitation Studies
For co-immunoprecipitation studies, Plat-E cells (Morita et al., 2000) were transfected with 8μg expression vectors, lysed 48 h later and the immunoprecipitation against the myc-tag was carried out as described previously (Röring et al., 2012).
2.5. 3D Matrix Growth and Microscopy
Five thousand cells were seeded, grown in 2% Matrigel® (BD Biosci-ence), cultivated andfixed as described previously (Herr et al., 2011). E-Cadherin staining (BD Bioscience AB_397580), F-Actin staining (Phalloidin Alexa 488 (Cell Signaling 8878)) and DAPI ProLong® Gold (LifeTechnologie P36931) were applied according to manufacturer's protocol.
Livingfluorescent cells, cultured conventionally or in 3D matrix, were imaged with the ZEISS AxioObserver Z1 widefield microscope with a 10 × A-Plan 0.25 air objective connected to an AxioCamMRm camera. Forfixed cells and immuno-fluorescent stainings, the ZEISS AxioObserver Z1 plus ApoTome2 was used. Images were taken with a 10× A-Plan 0.25 air objective or a 40× PlanNeoFluar 1.3 oil objective, re-spectively. For IHC images the ZEISS Axioskop2 with a 10 × PlanNeoFluor 0.17 air objective was used.
2.6. Mass Spectrometry Analysis of SILAC Labeled NCI-H1299 Cells 2.6.1. Cell Culture and Stable Isotope Labeling
Cells were subcultured and passaged in SILAC-DMEM (Thermo Fish-er Scientific, Langenselbold, Germany) supplemented with 10% dialyzed FBS (Gibco, Invitrogen), 1%L-glutamine (PAN Biotech), 42 mg/lL -arginine (Sigma-Aldrich), 73 mg/l L-lysine (Sigma-Aldrich) and 82 mg/l proline (Sigma-Aldrich). According to the experimental setup cells were cultured and fully labeled for two weeks in the same way but through incorporation ofL-arginine-13C6-15 N4 andL -lysine-13C615N2 (Arg10 Lys8; Cambridge Isotope Laboratories).
2.6.2. MS Sample Preparation
Samples were lysed in SDS-PAGE loading buffer, reduced with 1 mM DTT (Sigma-Aldrich) for 5 min at 95 °C and alkylated using 5.5 mM iodoacetamide (Sigma-Aldrich) for 30 min at 25 °C in the dark. Protein
mixtures were separated by SDS-PAGE using 4–12% Bis-Tris mini gradi-ent gels (NuPAGE, Life Technologies). The gel lanes were cut into 10 equal slices, which were in-gel digested with trypsin (Promega, Mann-heim, Germany) (Shevchenko et al., 2006) and the resulting peptide mixtures were processed on STAGE tips as described (Rappsilber et al., 2007).
2.6.3. MS
Mass spectrometric measurements were performed on LTQ Orbitrap XL mass spectrometer (Thermo Fisher Scientific, Bremen, Germany) coupled to an Agilent 1200 nanoflow-HPLC (Agilent Technologies GmbH, Waldbronn, Germany) essentially as described in (Sprenger et al., 2013). HPLC-column tips (fused silica) with 75μm inner diameter (New Objective, Woburn, MA, USA) were self-packed with Reprosil-Pur 120 ODS-3 (Dr. Maisch, Ammerbuch, Germany) to a length of 20 cm. Samples were applied directly onto the column without pre-column. A gradient of A [0.5% acetic acid (high purity, LGC Promochem, Wesel, Germany) in water] and B [0.5% acetic acid in 80% ACN (LC-MS grade, Wako, Germany) in water] with increasing organic proportion was used for peptide separation (loading of sample with 2% B; separation ramp: from 10% to 30% B within 80 min). The flow rate was 250 nl/min and for sample application 500 nl/min. The mass spectrom-eter was operated in the data-dependent mode and switched automat-ically between MS (max. of 1 × 10⁶ ions) and MS/MS. Each MS scan was followed by a maximum offive MS/MS scans in the linear ion trap using normalized collision energy of 35% and a target value of 5000. Parent ions with a charge state from z = 1 and unassigned charge states were excluded for fragmentation. The mass range for MS was m/z = 370 to 2000. The resolution was set to 60,000. Mass-spectrometric pa-rameters were as follows: spray voltage 2.3 kV; no sheath and auxiliary gasflow; ion-transfer tube temperature 125 °C.
2.6.4. Identification of Proteins and Protein Ratio Assignment Using MaxQuant
The MS raw datafiles were uploaded into the MaxQuant software version 1.3.05 (Cox & Mann, 2008), which performs peak detection, SILAC-pair detection, generates peak lists of mass error corrected pep-tides and data base searches. A full length uniprot database (based on uniprot human version July 2012) was employed together with reverse annotations of all sequences. Carbamidomethylcysteine was set asfixed modification, methionine oxidation and protein amino-terminal acety-lation were set as variable modifications. Double SILAC was chosen as quantitation mode. Three miss cleavages were allowed, enzyme speci-ficity was trypsin/P + DP, and the MS/MS tolerance was set to 0.5 Da. The average mass precision of identified peptides was in general b1 ppm after recalibration. Peptide lists were further used by MaxQuant to identify and relatively quantify proteins using the following parame-ters: peptide, and protein false discovery rates (FDR) were set to 0.01, maximum peptide posterior error probability (PEP) was set to 0.1, min-imum peptide length was set to 7, minmin-imum number of peptides for identification and quantitation of proteins was set to two of which one must be unique, and identified proteins have been re-quantified. The “match-between-run” option (2 min) was used.
2.6.5. Data Analysis
Data were loaded into the freely available Perseus software and log2 transformed (Cox et al., 2011). Significance B (permutation based FDR≤ 0.05) was used to identify significantly up-and down regulated proteins between control and knockdown cells. To address the biologi-cal implications of identified proteins they were analyzed by STRING (Franceschini et al., 2013) for interactions (default parameters) and resulting networks were visualized by cytoscape (http://www. cytoscape.org/).
2.7. Colony Formation Assay
Five hundred cells were seeded in 6 well plates and grown for up to 13 days. Cell colonies werefixed and stained with Giemsa (Carl-Roth). Plates were imaged and cell density per well was determined by pixel density measurement using Photoshop CS2.
2.8. Luciferase Reporter Assay
Cells were seeded in low density (2–4 × 10⁴) in 24 well plates,
allowed to attach and transfected with 10 ng pRL CMV Renilla (kindly provided by Andreas Hecht, IMMZ Freiburg) and 500 ng 2xHIVκBLuc Firefly (Minguet et al., 2005). In the case of IKK2 co-transfection, 1μg pCMV empty vector or FLAG-IKK (WT/KD/CA) was used. After 48 h cells were lysed in luciferase lysis buffer and luciferase activity was de-termined as described in (Rönsch et al., 2015).
2.9. MTT Cell Viability Test
One to three thousand cells were seeded in 96-Well plates and grown for up to four days. For MTT measurement, medium was ex-changed to MTT solution (medium with 0.45 mg/ml Thiazolyl Blue Tet-razolium Bromide (Sigma-Aldrich)). After incubation at 37 °C for 2 h, medium was aspirated and formed crystals were dissolved in 150μl DMSO. Absorption at 590 nm was measured with a plate reader (Tecan plate reader). MTT activity was determined each day beginning with day 0 and normalized to day 0 or normalized to NS dox.
2.10. Caspase 3 Cell Death Assay
For caspase 3 assay, cells were lysed as described previously (Herr et al., 2015) and a total amount of 20μg protein was mixed with 90 μl of assay buffer (100 mM HEPES pH 7.4, 10 mM DTT, 60μM Ac-DEVD-AMC). Fluorescence was measured at 460 nm every 2 min for 60 min at 37 °C. Slopes of caspase activities were calculated and compared. 2.11. Mouse Maintenance, Handling and Xenografts
Rag2−/−;γc−/−mice on a BALB/C background were purchased from
the local stock of the animal facility at Freiburg University Medical Cen-ter and housed in the specific pathogen-free barrier facility of the Uni-versity Medical Center Freiburg in accordance with the institutional guidelines and approved by the local animal ethics committee (G-13/ 116). For xenograft experiments NCI-H1299 non-silencing or shRIOK1 pBabe luciferase cells were either injected on day 0 subcutaneously into theflanks (5 × 10⁵) or intravenously into the tail vain (1 × 10⁵)
of Rag2−/−,γc−/− mice, between 6 and 12 weeks of age. For Xeno-graft experiments, tumor growth was monitored by palpation and reg-ular BLI and knockdown was initiated by application of doxycycline via the drinking water (2 mg/ml) after palpable tumors formed. For metas-tasis formation assays, pre-induced cells (-4d) were injected into the tail vein and cells were followed by regular BLI. Mice were sacrificed after reaching the biological endpoint and xenografts and lungs were isolated andfixed in 4% paraformaldehyde. 2 μm sections were de-paraffinized and stained with hematoxylin and eosin or RIOK1. 2.12. Histological and Immunohistochemical Analyses of Xenograft and Hu-man Tissue Specimens
Xenografts (N = 15) and lung metastases (N = 54) were formalin fixed and paraffin embedded (FFPE). Serial tissue slices of 2 μm thick-ness were prepared and stained for Hematoxylin and Eosin (H&E) and RIOK1 (AB_2042809; 1:1500). After one night at 56 °C incubation a heat-induced antigen retrieval was performed at 97–99 °C for a period of 40 min in pH 6.1 using Dako antigen retrieval buffer S1699. Primary antibody was incubated at room temperature for 30 min by using
EnVision™ FLEX Kit K8012 (Dako, Autostainer Plus). All slides were counterstained with hematoxylin, dehydrated in ascending alcohol con-centrations and covered.
2.12.1. Tissue Specimens
FFPE tissue specimens from primary non-small cell lung cancers (N = 30) were re-classified according to the actual WHO Classification of Tumors of the Lung, Pleura, Thymus and Heart (Travis et al., 2015) as follows: adenocarcinoma (AC) (N = 15) and squamous cell carcinoma (SCC) (N = 15), (see also Table S3). Staining for RIOK1 was performed as described above.
FFPE tissue specimens from primary breast carcinomas (N = 22) and matched normal breast tissue (N = 22) were re-classified according to the actual WHO Classification of Tumors of the Breast (Lakhani et al., 2012) as follows: no special type (NST) (N = 14), invasive lobular (N = 3), mucinous (N = 2), tubular (N = 2) and medullary (N = 1). Addi-tionally, hormone receptor status and Her2neu status were– based on stained slides from routine diagnostics - re-classified according to the actual guidelines (Lakhani et al., 2012) (see also Table S3). A tissue mi-croarray (TMA) consisting of these 22 primary breast carcinomas and their matched normal breast tissue was stained for RIOK1 as described above. Ethical approval was obtained from the local institutional ethics committee (University of Freiburg, Ethik-Kommission, ID #234/13). 2.13. Statistical analysis
Quantitative data are presented as mean ± SEM. Multiple group and pair-wise comparisons were performed by Mann-Whitney (two-tailed), Student t-test (two-(two-tailed), paired t-test, two way ANOVA or Chi-square test, respectively, using GraphPad Prism 6. A p-value of ≤0.05 was considered as statistically significant.
3. Results
3.1. Knockdown of RIOK1 in Cancer Cells Inhibits Proliferation and Impairs Growth in 3D Cell Culture
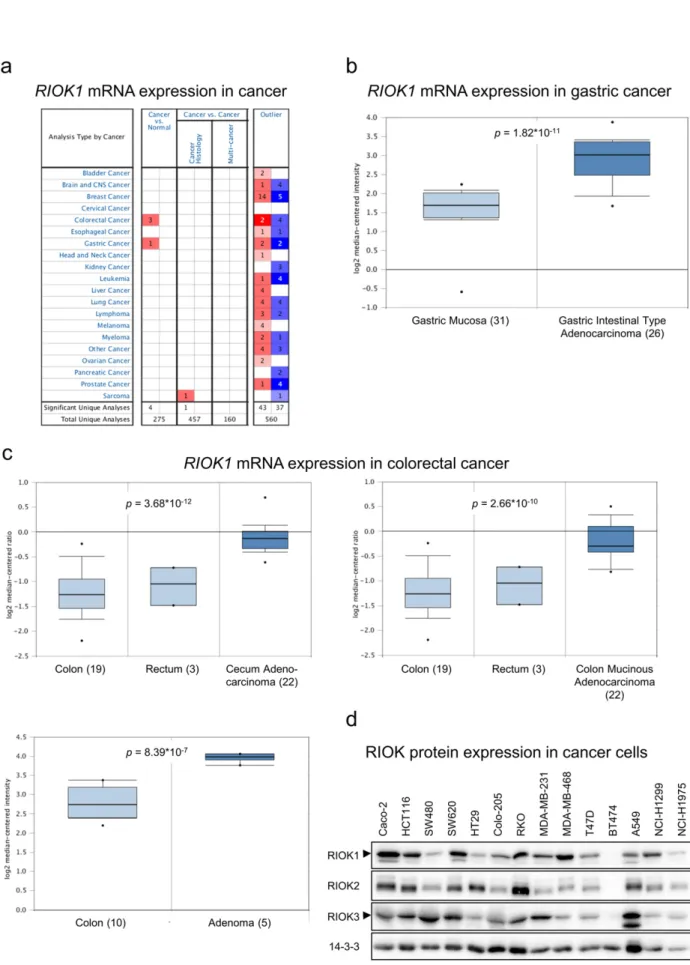
The expression of RIOK1 is hardly characterized at the mRNA and protein level in cancer. Therefore, wefirst analyzed RIOK1 mRNA ex-pression in normal and cancer tissue in silico using the Oncomine mRNA database (Fig. 1a). In line with previously published data on 22 primary tumors (Line et al., 2002), our analysis showed that RIOK1 mRNA levels are, compared to healthy tissue, elevated in gastric adeno-carcinoma (Fig. 1b), cecal adenocarcinoma, colorectal adenoma and co-lorectal adenocarcinoma (Fig. 1c). Next, we evaluated the expression of all three RIO kinase members at the protein level in tumor cell lines de-rived from colon-, breast- and non-small cell lung cancer (Fig. 1d). We observed that the three RIO paralogues are expressed to various de-grees. Based on our previous study showing a genetic collaboration be-tween RIOK1 and oncogenic RasG13Ein C. elegans (Weinberg et al., 2014), we chose cancer cell lines with high RIO kinase expression and gain-of-function mutations in NRAS (NCI-H1299 (non-small cell lung cancer)) or KRAS (MDA-MB-231 (breast cancer), SW480 and HCT116 (colon cancer)) for knockdown studies to delineate the isoform-specific contributions to their transformed phenotypes. All cell lines were transduced with lentiviral vectors allowing the doxycycline (dox) inducible expression of the redfluorescent protein tRFP along with the expression of either shRNAs targeting RIOK1-3 or a non-silencing (NS) control shRNA. For RIOK1, several shRNAs were tested in NCI-H1299 and MDA-MB-231 cells resulting in different knockdown efficacies (Fig. S1a and Table S4). Unless stated otherwise, the most ef-fective shRNA for RIOK1 (shRIOK1_3) was chosen for the following ex-periments. First, we analyzed the lung- and breast cancer cell lines NCI-H1299 and MDA-MB-231, respectively. After establishing stable induc-ible knockdown cell lines (Fig. 2a), we investigated colony formation ca-pacity after depletion of the individual RIOK isoforms. We observed
Fig. 1. RIOK1 is overexpressed in colorectal and gastric cancer. (a) Oncomine™ based mRNA expression analysis for human RIOK1 in different cancer entities comparing normal versus cancer tissue samples. (b and c) Oncomine™ based detailed mRNA expression analyses for gastric (b) and colorectal (c) cancer demonstrating overexpression of RIOK1 in cancer versus normal tissue. Significance was calculated comparing mRNA expression in normal tissue (light blue) versus cancerous tissue (dark blue). (d) RIO kinase protein expression analysis of different cancer cell lines using the indicated antibodies. 14-3-3 serves as loading control. Arrows indicate specific bands for RIOK1 and RIOK3.
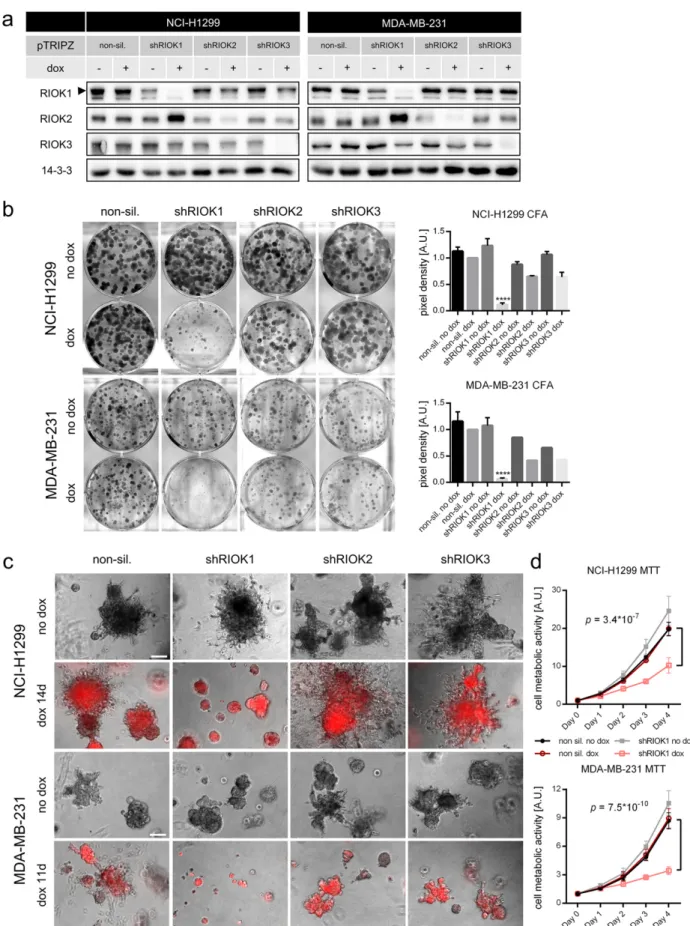
Fig. 2. Knockdown of RIOK1 in RAS-transformed lung- and breast cancer cell lines inhibits proliferation, invasiveness and metabolism. (a) Representative Western blot analysis confirming RIOK1, RIOK2 and RIOK3 knockdown for NCI-H1299 (N = 4) and MDA-MB-231 cells (N = 2). (b) Colony formation assays of NCI-H1299 and MDA-MB-231 cells. Formed colonies were stained after 10 days and cell density was determined. Representative pictures are shown. Data is represented as mean ± SEM with *** for pb 0.001 and **** for p b 0.0001 by ordinary two-way ANOVA (Dunnett (H1299) and Tukey (MDA-MB-231)) compared to non-sil. dox. NCI-H1299 N = 6 for NS and shRIOK1, N = 2 for shRIOK2 and 3. MDA-MB-231 N = 4 for NS and shRIOK1, N = 1 for shRIOK2 and 3. (c) NCI-H1299 and MDA-MB-231 cells were seeded in 2% Matrigel and grown for up to 14 days. Scale bars: 200μm. (d) MTT assay sequentially measured for 4 days for NCI-H1299 and MDA-MB-231 cells. Data is represented as mean ± SEM by multiple t-test; N = 3, each. (See also Fig. S1).
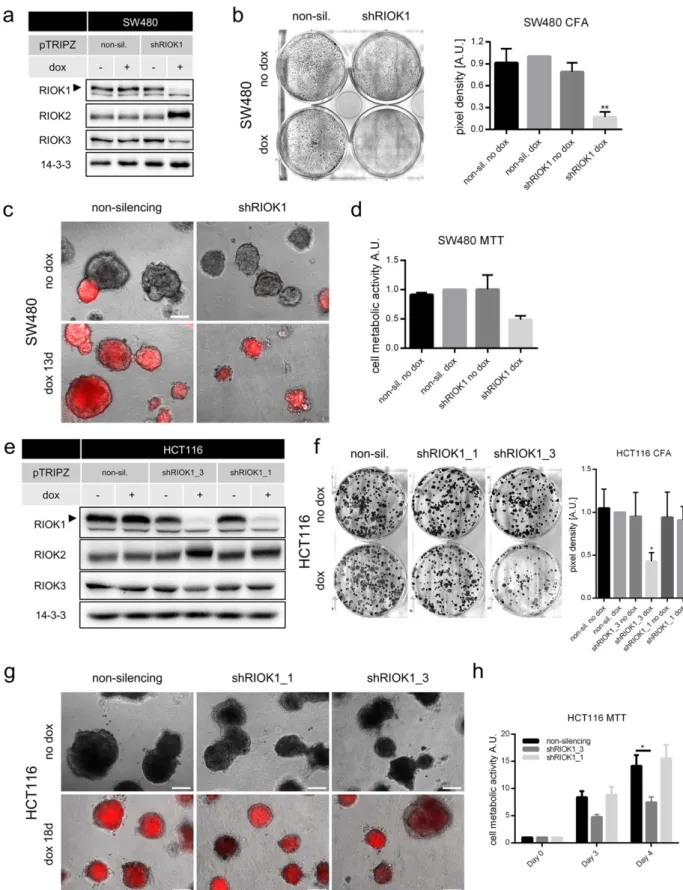
Fig. 3. Knockdown of RIOK1 in RAS-transformed colon cancer cell lines inhibits proliferation and metabolism. (a) Representative RIOK1 knockdown Western blot analysis for SW480 cells (N = 3). (b) Colony formation assays of SW480 cells. Formed colonies were stained after 7 days and cell density was determined. Representative pictures are shown. Data is represented as mean ± SEM with ** for pb 0.01 by ordinary two-way ANOVA (Tukey) compared to non-sil. dox. N = 3. (c) SW480 cells were seeded in 2% Matrigel and grown for 13 days. Scale bar: 200μm. (d) MTT assay measured on day 3 for SW480 cells. Data is represented as mean ± SEM; N = 2. (e) RIOK1 knockdown Western blot analysis for HCT116 cells (N = 1). (f) Colony formation assays of HCT116 cells. Formed colonies were stained after 10 days and cell density was determined. Representative pictures are shown. Data is represented as mean ± SEM with * for pb 0.05 by ordinary two-way ANOVA (Dunnett) compared to non-sil. dox; N = 4. (g) HCT116 cells were seeded in 2% Matrigel and grown for 18 days. Scale bars: 200μm. (h) MTT assay measured on indicated timepoints and normalized to day 0 for HCT116 cells. Data is represented as mean ± SEM with * for p b 0.05 by two-way ANOVA (Tukey); N = 3.
fewer and smaller colonies in both analyzed cell lines compared to the NS control or to the isogenic non-induced controls after RIOK1 depriva-tion (Fig. 2b). Interestingly, knockdown of RIOK2 or RIOK3 did not yield as remarkable growth arrests (Fig. 2b), despite equally strong reduction
in RIOK2 and RIOK3 expression (Fig. 2a). This demonstrates that loss of RIOK1 cannot be compensated by the other paralogs.
As the growth behavior of carcinoma cells can strongly differ be-tween conventional tissue culture and 3D matrix growth (Debnath
et al., 2003; Herr et al., 2011), we assessed the effects of RIOK depletion in three-dimensional (3D) matrices. Again, reduced growth was only observed upon RIOK1 deprivation (Fig. 2c). RIOK1 depleted spheres displayed rounder shapes, lessfilopodia-like structures and protrusions. Next, we investigated the metabolic activity of NCI-H1299 and MDA-MB-231 cells upon loss of RIOK1 by sequential MTT measure-ments over four days (Fig. 2d). From day three onwards, RIOK1 deficient cells displayed a significantly reduced metabolic activity compared to the NS control cells or non-induced cells. Importantly, the ability to re-duce proliferation in conventional and 3D matrix culture as well as the metabolic activity of NCI-H1299 and MDA-MB231 cells correlated with the knockdown efficacies of the distinct RIOK1 shRNAs (Fig. S1b– d). As we observed only an insignificant increase in caspase-3 activity upon RIOK1 knockdown (Fig. S1e), we exclude cell death as main driver for the observed phenotypes.
Next, we analyzed the cellular response of the K-Ras-driven colorec-tal cancer cell lines HCT116 and SW480 upon RIOK1 depletion (Fig. 3). After having established inducible shRIOK1 and control cell lines for SW480 cells (Fig. 3a), we analyzed their proliferation capacity in 2D and 3D culture after RIOK1 depletion. As shown inFig. 3b, SW480 cells formed fewer colonies in conventional culture and were impaired in 3D matrix growth (Fig. 3c), although the growth arrest appeared not as profound as observed in MDA-MB-231 or NCI-H1299 cells. Metabolic activity was also impaired upon RIOK1 knockdown (Fig. 3d). Similar re-sults were obtained for HCT116 cells (Fig. 3e). Again, cell growth ap-peared more strongly impaired in conventional culture (Fig. 3f) as compared to 3D matrix growth (Fig. 3g). Accordingly, cell metabolic ac-tivity was again reduced upon RIOK1 depletion (Fig. 3h). Similar to MDA-MB-231 and NCI-H1299 cells, knockdown with shRIOK1 knock-down construct #3 led to stronger growth arrest, which again correlat-ed with the knockdown efficacy (Figs. S1 and 3e–h). It should be noted that, while our study was in progress,Marjon et al. (2016)also observed impaired proliferation of HCT116 cells in 2D culture upon RIOK1 knock-down with shRNA constructs unrelated to ours in terms of target se-quence and vector design.
The severe effect of RIOK1 depletion could reflect a strong necessity for this atypical kinase in fundamental cellular processes rather than a specific requirement in RAS-mediated transformation. Therefore, we analyzed the influence of RIO kinase knockdown on well-differentiated adenocarcinoma cell line Caco-2, the BRAFV600Eand
PI3KCAH1047R-driven colorectal cancer cell line RKO and the Bcr-Abl
driven leukemia cell line K562 (Fig. S2). Knockdown of RIOK1 in Caco-2 cells (Fig. SCaco-2a) did neither affect colony formation (Fig. SCaco-2b) nor growth in three-dimensional matrix (Fig. S2c) and metabolic activity (Fig. S2d). Likewise, knockdown of RIOK1 did not inhibit 3D growth of RKO cells (Fig. S2e and f) and did not alter cell viability of the Bcr-Abl-driven K562 leukemia cell line (Fig. S2g and h). This indicates that RIOK1 depletion is not always cytostatic.
So far, we have observed exclusively strong effects of RIOK1 deple-tion in established cancer cell lines carrying an endogenous RAS muta-tion. Therefore, we were interested to investigate the effects of RIOK1 depletion in an isogenic system in which oncogenic RAS was not expressed a priori, but was acutely introduced only a few passages be-fore RIOK1 depletion. To this end, we turned to the non-tumorigenic human mammary epithelial cell line MCF-10A, which lacks mutations in RAS (or its effectors) and has been spontaneously immortalized by MYC amplification and loss of p16INK4and p14ARF(Debnath et al., 2003). In 3D culture, these cells form so-called acini in a well-defined morphogenetic process that integrates multiple biological processes in
a coordinated spatio-temporal fashion. Potent oncogenes such as RAS mutants perturb acinar morphogenesis by multiple processes (Herr et al., 2011; Li et al., 2010). Therefore, we infected MCF-10A cells with pMIG retroviral expression vectors encoding GFP, either singly or in combination with KRASG12V(Fig. 4a). As shown inFig. 4b and c,
overex-pression of KRASG12Vin MCF-10A cells induced growth arrest in
con-ventional cell culture. Knockdown of RIOK1 reduced the growth of empty vector and KRASG12Vexpressing cells, whereas the NS construct
had no influence on colony growth. Importantly, this growth arrest upon RIOK1 loss was stronger in KRASG12Vexpressing cells. Related to
thisfinding, cell metabolic activity of RIOK1 deficient cells was reduced in empty vector and KRASG12Vexpressing cells on day 3 and 4 after seeding, too (Fig. 4d). When cultured in 3D matrix, MCF-10A KRASG12V
high expressing cells formed colonies with invasive protrusions (Figs. 4e and S3a, black arrows). A similar invasive 3D phenotype has been described for oncogenic H-Ras (Li et al., 2010). In contrast to con-ventional growth, knockdown of RIOK1 did neither impair the growth nor the overall structure of the formed acini in empty vector expressing cells (Figs. 4e 1st and 3rd panel, S3a). Importantly and in line with our results in NCI-H1299 and MDA-MB-231 cells (Fig. 2c), RIOK1 deficiency prevented the formation of invasive protrusions in KRASG12Vexpressing
MCF-10A cells (Figs. 4e and S3a, white arrows). Likewise, the typical loss of contact inhibition induced by oncogenic RAS was partially reverted by the loss of RIOK1 expression (Fig. 4e, 2nd and 4th panel). We further analyzed MCF-10A acini by E-Cadherin staining (Fig. S3b and S3c), a marker often used to assess the acinar structure of MCF-10A cells (Herr et al., 2011). Knockdown of neither RIOK1, 2 nor 3 did alter E-Cadherin expression or MCF-10A acini formation compared to non-silencing expressing spheres (Fig. S3c).
In summary, our data demonstrates that RIOK1 knockdown reverts the strong 2D and 3D growth and invasion phenotypes of four distinct RAS-driven carcinoma cell lines derived from three tumor entities as well as of MCF-10A cells transformed by KRASG12V. This suggests that
the growth and invasion promoting function of RIOK1 is of particular relevance for RAS mutant cells.
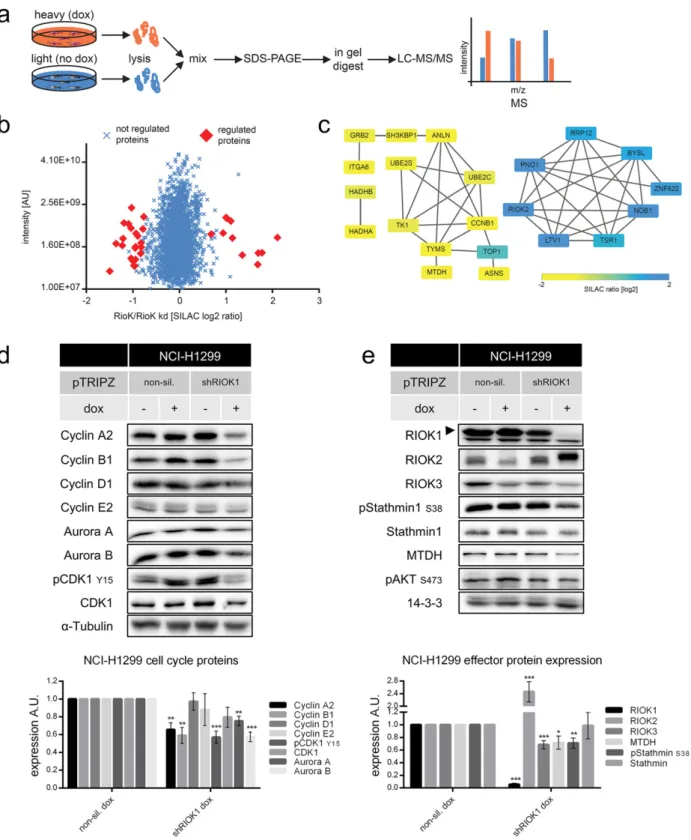
3.2. A Mass-spectrometric Approach Identifies Effector Proteins of RIOK1 Besides its important role in ribosomal biogenesis and as substrate recruiting protein of the PRMT5 complex (Guderian et al., 2011), no cancer-related molecular functions are known for mammalian RIOK1. Therefore, we used a SILAC-based mass-spectrometric (MS) approach (Fig. 5a and Table S1) and an antibody array (Table S2) to gain more in-sights into the protein network controlled by RIOK1 in NCI-H1299. To this end, the proteome of RIOK1-expressing cells was compared to that of RIOK1 depleted cells. We quantified N2800 proteins and identi-fied significant changes based on SILAC ratio distributions (Fig. 5b; sig-nificance B, permutation based FDR b 0.05) (Cox & Mann, 2008). Significantly deregulated proteins were linked to known interactions using STRING DB and respective protein networks were generated (Fig. 5c) (Franceschini et al., 2013). Upon RIOK1 knockdown, several known pre-40S ribosomal subunit proteins were upregulated (Turowski et al., 1997; Zemp & Kutay, 2007), including RIOK2 (Fig. 5b and c). Down-regulated proteins were associated with cell cycle (Cyclin B1, Anillin, TYMS, UBE2S) or metabolic activity (G0S2, SCD-1, ASNS). In-terestingly, the oncogene product Metadherin (MTDH), which pro-motes AKT- and NF-κB signaling and metastasis formation (Emdad et al., 2006; Haug et al., 2015; Khuda et al., 2009; Lee et al., 2008; Sarkar et al., 2008), was reduced in expression. Analysis of proteins
Fig. 4. KRAS-induced transformation of epithelial MCF-10A can be partially prevented by knockdown of RIOK1. (a) RIOK1 knockdown Western blot analysis for MCF-10A KRAS cells (N = 1). (b and c) Colony formation assays of MCF-10A KRAS cells. Formed colonies were stained after 14 days and cell density was determined. Representative pictures are shown. Data is represented as mean ± SEM with **** for pb 0.0001, *** for p b 0.001, ** for p b 0.01 and * for p b 0.05 by ordinary two-way ANOVA (Tukey); N = 3. (d) MTT assay measured on indicated timepoints for MCF-10A KRAS cells. Data is represented as mean ± SEM with *** for pb 0.001, ** for p b 0.01 and * for p b 0.05 by two-way ANOVA (Tukey); N = 3. (e) MCF-10A KRAS cells were seeded in 2% Matrigel and grown for 28 days. Scale bars: 200μm. Black arrows indicate invasive protrusion formed in the GFP/KRASG12V
transformed cells. Note that these are lost upon RIOK1 knockdown (white arrows) (See also Fig. S3).
with altered posttranslational modified status upon RIOK1 knockdown showed an increased phosphorylation of Stathmin1 (S25/38) and La-related protein1 (LARP1; S774). Stathmin1 promotes tumor growth and metastases by microtubule-dependent and independent mecha-nisms and is required for invasive growth in 3D neuroblastoma models
(Fife et al., 2016). LARP1 contributes to cell cycle initiation and progres-sion (Burrows et al., 2010). In conclusion, we show that depletion of RIOK1 affects the expression and phosphorylation status of several pro-teins involved in ribosomal biogenesis, cell cycle progression, metabolic activity, NF-κB signaling and metastases.
Fig. 5. SILAC-based mass-spectrometric approach and validation of RIOK1 effector proteins. (a) NCI-H1299 shRIOK1 cells were labeled by SILAC and induced or left untreated 6 days prior to lysis. Lysates were mixed and analyzed by LC-MS/MS. (b) SILAC-based fold-changes of up- and down-regulated proteins upon RIOK1 knockdown are shown. Red rhombuses indicate significantly changed proteins upon knockdown (significance B, permutation based FDR b 0.05). (c) Protein-protein interaction network for significantly regulated proteins upon Riok1 depletion. (d) Representative Western blot analysis and quantifications of NCI-H1299 cells for cell cycle proteins and (e) RIOK1 effector proteins N = 4; *** for p b 0.001; ** for pb 0.01 and * for p b 0.05; unpaired two-tailed t-test (mean ± SEM). (See also Figs. S4 and S5).
3.3. RIOK1 Knockdown Blocks Cell Cycle Progression and Impairs Cell Viability
To validate the MS data, we analyzed the abundance of the identified RIOK1 effector proteins in our cell line models. Starting with NCI-H1299 cells, wefirst confirmed the role of mammalian RIOK1 in cell cycle pro-gression. RIOK1 knockdown resulted in decreased expression of Cyclin A2, Cyclin B1, Aurora kinases A and B as well as in a clear decrease of CDK1 phosphorylation (Y15) (Fig. 5d). Furthermore, we confirmed the MS predicted increase of RIOK2 expression upon RIOK1 knockdown (Fig. 5e), which was accompanied by a robust electrophoretic mobility shift. In addition to decreased MTDH levels, we also noticed a significant downregulation of RIOK3 expression. The expression of Stathmin1 was not altered, but its phosphorylation on Ser38, a site recently shown to be important for breast cancer cell invasion (Kuang et al., 2015; Kuang et al., 2016), was clearly reduced (Fig. 5e).
Next, we confirmed the influence of RIOK1 knockdown on its identi-fied effectors in our other cellular systems (Figs. S4 and S5). We detect-ed the increasdetect-ed expression and electrophoretic shift for RIOK2 and the decreased expression for RIOK3 upon RIOK1 knockdown in all cell lines except for K562 and MCF-10A KRASG12V cells. This suggests that
the three RIOK isoforms regulate each other, or are controlled in their expression due to their essential consecutive roles in ribosomal biogenesis.
For the other effectors, we observed a segregation between RAS-driven and non-RAS-RAS-driven cancer cells on the one hand and between colorectal and non-colorectal cells on the other hand. Whereas Cyclin B1 was reduced in expression in most cell lines except for SW480, MCF-10A and K562 cells, Cyclin A2 was only reduced in its expression in MDA-MB-231 cells. Phosphorylation of CDK1 (Y15), Stathmin1 (S38) and MTDH expression were clearly reduced in MDA-MB-231 and MCF-10A KRASG12Vcells, which was not the case for the other cell
lines. Most importantly, RIOK1 knockdown in MCF-10A empty vector control cells did not provoke the expression changes observed in MCF-10A KRASG12Vcells, emphasizing that RIOK1 expression is critical for KRASG12Vsignaling. Although all RAS-driven cell lines reacted upon
RIOK1 knockdown with decreased growth and cell metabolism
(Figs. 2–4), only NCI-H1299, MDA-MB-231 and MCF-10A KRASG12V
cells share regulation of identified RIOK1 effectors on the protein level. This result may indicate different cellular functions for RIOK1 in colorec-tal cancer cell lines, compared to lung- and breast cancer cells. 3.4. Invasive Protrusions Rely on RIOK1 Expression and NF-κB Activity
It was previously shown that MTDH is a positive regulator of the NF-κB pathway in various cancer entities by being an IKK substrate and pro-moter of phosphorylation-dependent IκB degradation (Alexia et al., 2013; Krishnan et al., 2015; Shi & Wang, 2015). As MTDH expression de-creases upon RIOK1 depletion and because oncogenic RAS promotes NF-κB activity (Basseres et al., 2014), we asked whether RIOK1 deple-tion impairs NF-κB signaling. First, we detected a diminished basal NF-κB activity upon RIOK1 knockdown in NCI-H1299 and MDA-MB-231 cells by using a luciferase reporter for transcriptionally competent NF-κB (Fig. 6a). To further narrow down at which step RIOK1 depletion af-fects the NF-κB pathway, we co-expressed different IKK2 constructs to-gether with the NF-κB luciferase reporter in the NCI-H1299 system (Fig. 6b and c). Expression of wildtype IKK2 neither increased basal levels of NF-κB activity nor was able to rescue the reduction in pathway activity by RIOK1 depletion. Expression of the kinase inactive IKK2K44M
mutant reduced pathway activity under all conditions, whereas the ex-pression of IKK2S177/181E, a constitutively active mutant, increased path-way activation in all cell lines. Still, IKK2S177/181Ewas not able to
augment pathway activity in RIOK1 deficient cells to the same extent as in the non-induced culture or dox-treated NS cells. To further address at which level RIOK1 depletion impairs NF-κB activity, we stimulated NCI-H1299 RIOK1 knockdown and NS control cells with TNFα in the
presence or absence of Bay 11-7082, an IKK inhibitor (Strickson et al., 2013), and analyzed the abundance of key pathway components in the cyto- and nucleoplasm (Fig. 6d and e). Under basal conditions, we observed a trend (p = 0.089) for increased levels of IκBα, the negative regulator of NF-κB signaling upon RIOK1 depletion (Fig. 6d, lane 2). Moreover, RIOK1 deficient cells displayed significantly less phosphory-lation of IkBa at S32 compared to the control cells (Fig. 6e lane 6). These data suggest impaired IkBa degradation in RIOK1 depleted cells. In line with this, RIOK1 depleted cells displayed less nuclear p65/NF-κB (Fig. 6d, lane 10). As expected, Bay 11-7082 stabilized IκBα expres-sion under both basal and TNFα stimulated conditions and strongly im-paired p65 phosphorylation and nuclear accumulation (Fig. 6d, lanes 12–16). However, RIOK1 abundance had no influence on the TNFα-induced activation of the pathway, suggesting that the strong TNFα sig-nal also activated RIOK1 independent pathways to IκBα phosphoryla-tion. The impaired pathway activation by Bay 11-7082 was also not further enhanced by combination with RIOK1 knockdown. Thus, in line with the identification of MTDH as an IKK complex component and substrate (Krishnan et al., 2015), we place the contribution of RIOK1 to NF-κB signaling upstream of IκBα degradation, probably paral-lel to the IKK complex.
Next, we assessed the effect of NF-κB pathway inhibition on the in-vasive phenotype of NCI-H1299 cells. In 3D cultures of NCI-H1299 cells, the constant inhibition of the NF-κB pathway resulted in a similar phenotype as provoked by RIOK1 knockdown with spheres displaying a smaller diameter and a reduction of invasive protrusions (Fig. 6f). In contrast to the signaling analysis, this phenotype was further enhanced by combination of Bay 11-7082 treatment with RIOK1 knockdown.
RIOK3 has been implicated in the regulation of actinfilaments of breast cancer cells, especially in the context of hypoxic regulation (Singleton et al., 2015). We therefore analyzed protrusion formation for the NCI-H1299 cells grown in 3D matrix displayed inFig. 6f. RIOK1 deficient cells showed reduced F-Actin expression and a localization of F-Actin at the cell membranes (Figs. S6 and S7). In contrast, NS and non-induced shRIOK1 cells formed protrusions with branching filopodia-like structures with high levels of F-actin throughout the cell (Figs. S6 and S7). Furthermore, RIOK1 depletion as well as Bay 11-7082 largely reduced the amount offilopodia-like structures. Taken to-gether, these data suggest that RIOK1 activates NF-κB signaling at the level of the IKK complex and thereby augments the invasive growth be-havior of NCI-H1299 cells.
3.5. RIOK1 Promotes the Formation of Metastases to the Lung In Vivo Next, we analyzed the requirement of RIOK1 for invasive cell be-havior in vivo. In a pilot xenograft experiment, we investigated sub-cutaneous tumor growth of NCI-H1299 cells. Non-induced NS and shRIOK1 cells were injected into theflanks of immunocompromised Rag2−/−γc−/−mice and knockdown of RIOK1 was induced once
palpable tumors arose. The growth of the inoculated subcutaneous tumors did not differ between NCI-H1299 RIOK1 knockdown and NS control cells, although histological analyses revealed less meta-static burden in the lung (Fig. S8a–c). Western blot analysis con-firmed the sustained knockdown of RIOK1 in isolated xenografts (Fig. S8d). Histological staining with H&E and a human specific RIOK1 antibody (Fig. S8e) were performed with NCI-H1299 xeno-grafts. This showed that the xenografts formed by NS cells were char-acterized by increased cellularity and presence of mitoses/metaphases as compared to those derived from induced NCI-H1299 shRIOK1 cells (Fig. S8f).
To investigate the metastatic potential of NCI-H1299 cells with or without RIOK1 expression in mice in more detail, the cells were labeled by luciferase expression and injected either into theflanks or into the tail vein of Rag2−/−;γc−/−mice. Luciferase positive NCI-H1299 lung
cancer cells were followed by consecutive bioluminescence imaging (BLI). In the case of subcutaneous (s.c.) injection, knockdown of RIOK1
was induced by administration of dox via the drinking water once xeno-grafts were detectable for both cell lines in all mice. BLI and tRFP signal analyses did not show any difference in primary tumor growth (Fig. S9a–c). Moreover, the weight of the injected mice was not altered
between the groups (Fig. S9d). These observations are in line with our pilot study (Fig. S8). Strikingly, RFPfluorescence analyses of the isolated lungs reported metastasis formation only for NCI-H1299 NS control cell injected mice (Fig. S9e and f). Again, Western blot analysis of the formed
xenografts confirmed the sustained knockdown in the shRIOK1 tumors (Fig. S9g).
Next, we conducted tail vein injection of induced NCI-H1299 shRIOK1 and NS control cells to answer the question whether RIOK1 ex-pression is necessary to enable circulating cells to colonize distinct or-gans (Fig. 7). Indeed, NCI-H1299 cells expressing the NS shRNA- or the non-induced shRIOK1 construct effectively colonized to the lungs as an-alyzed by BLI and RFP expression measurements of living animals and isolated lungs (Fig. 7a and b). However, no BLI expressing cells were de-tectable in mice injected with RIOK1 deficient cells. Analysis of the co-expressed RFP confirmed colony formation in the lungs of mice inocu-lated with NCI-H1299 NS but not of induced RIOK1 knockdown cells (Fig. 7b).
Histological analysis of the lungs confirmed that those cells forming the metastatic spots highly expressed RIOK1 (Fig. 7c). Furthermore, as this antibody recognizes an epitope only present in human RIOK1, it can be also used to distinguish human tumor cells from murine stroma. Scoring of the isolated lungs of all in vivo experiments demonstrated that, upon s.c. injection, NCI-H1299 NS control cells preferentially formed metastases appearing as nodules of tumor cells (score 2; 10– 20 cells), whereas shRIOK1 cells formed metastases consisting of single or few cells (score 1) (Fig. 7d, left quantification). For i.v. injection, NCI-H1299 shRIOK1 cells failed to colonize to the lungs in 15 out of 16 dox-treated recipient mice, while NCI-H1299 NS control and non-induced shRIOK1 cells formed massive colonies (score 3) in 14 out of 15 and 7 out of 8 animals, respectively (Fig. 7d, right quantification). Taken to-gether, these data suggest that RIOK1 depleted cells are impaired in col-onization and implicate RIOK1 as a potential therapeutic target for metastasis prevention.
3.6. RIOK1 is Overexpressed in Human Lung- and Breast Cancer Specimens Our preclinicalfindings encouraged us to analyze primary lung and breast cancer human tissue specimens or RIOK1 expression. Indeed, in a group of 30 lung cancer tissue specimens, we detected higher levels of RIOK1 expression in the subtypes of squamous cell carcinoma (SCC) (N = 15), compared to a heterogeneous expression observed in the ad-enocarcinoma subtypes (N = 15) (Fig. 8a and b).
Next, we scored RIOK1 expression in a collective of 22 breast carci-noma samples (WHO reclassified in Table S3) with matched non-neoplastic tissue. Expression of different histological subtypes was het-erogeneous (Fig. 8c), whereas RIOK1 was expressed in a comparable ratio between non-neoplastic and tumor tissue (Fig. 8d), which is in ac-cordance to our initial in silico analysis (Fig. 1a). When analyzing RIOK1 expression and tumor grading independent of the histological subtypes, we observed stronger RIOK1 expression in less differentiated grade 3 tumors (Fig. 8e). Important predictive markers for targeted therapies in breast carcinomas are hormone receptor status and HER2 expression. Therefore, we correlated the expression of the estrogen and progester-one receptor with the expression of RIOK1. This analysis showed an in-verse correlation between hormone receptor status and RIOK1 expression (Fig. 8f), while the proportion of RIOK1 high and low
expressing tumors was comparable between HER2 negative and posi-tive tumors (Fig. 8g).
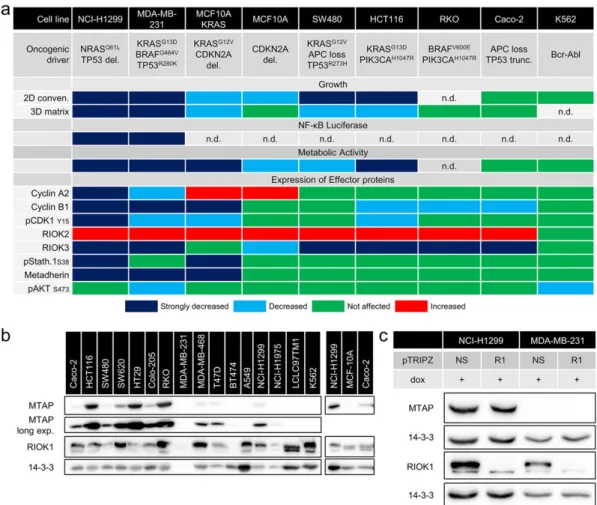
3.7. RIOK1 Knockdown Susceptibility Does Not Necessarily Correlate With MTAP Expression
So far we have identified RIOK1 as a critical contributing factor to on-cogenic RAS signaling in three distinct cancer entities using cell lines from lung-, triple-negative breast- and colorectal cancer (Fig. 9a). How-ever, it is likely that RIOK1 dependence is not only mediated by the RAS mutational status. Interestingly, three recent publications identified de-pletion of RIOK1, or its interaction partner PRMT5, as a critical prerequi-site for synthetic lethal constellations triggered by loss of the MTAP locus (Kryukov et al., 2016; Marjon et al., 2016; Mavrakis et al., 2016). Marjon et al. and Mavrakis et al. established this requirement for RIOK1 expres-sion in KRASG13Dmutant HCT116 colorectal and KRASG12Cmutant
MiaPaCa2 pancreatic cancer cells, respectively, although the RAS muta-tional status was not considered in the interpretation of their data. In-deed, Marjon et al. show that RIOK1 depletion, using shRNA constructs distinct from ours, also reduces colony growth of HCT116 cells by 40%, which is further reduced to 20% in the isogenic MTAP−/− line. These data led to a model in which MTAP deficiency leads to the accumulation of its substrate methylthioadenosine, which represses the PRMT5/RIOK1 complex and pro-proliferative and biosyn-thetic pathways that are positively regulated by PRMT5 (Marjon et al., 2016). Consequently, we analyzed the MTAP status for our cell lines (Fig. 9b). Interestingly, NCI-H1299 cells express MTAP, whereas MDA-MB-231 do not (Fig. 9b and c). Thisfinding correlates well with the ob-served effects of RIOK1 depletion in these cells as MDA-MB-231 responded with an even stronger growth arrest as compared to the NCI-H1299 cells. Furthermore, we observed MTAP expression in all an-alyzed colorectal cancer cell lines, which could explain the less severe effects observed in SW480, HCT116 and RKO cells upon RIOK1 knock-down. In our two epithelial cell lines Caco-2 (MTAP proficient) and MCF-10A (MTAP deficient), the effects of the RIOK1 knockdown corre-lated again with the MTAP status. Whereas Caco-2 cells were not sus-ceptible to RIOK1 knockdown, MCF-10A cells responded partially to the knockdown in conventional culture but not in the more physiolog-ical setting of 3D matrix culture. Finally, the CML cell line K562 (MTAP deficient) did not respond to RIOK1 knockdown. Thus, our data identify RIOK1 as a potential therapeutic target in the context of RAS mutations, in particular but not exclusively in the context of MTAP deficiency. Fur-ther studies will address the question wheFur-ther MTAP (or PRMT5) deple-tion in combinadeple-tion with RIOK1 deficiency (and oncogenic RAS signaling) further reduces cellularfitness.
4. Discussion
In this study, we identified the under-researched atypical kinase RIOK1 as a critical contributor to the transformed phenotypes of RAS-driven cell lines from lung, triple-negative breast and colorectal cancer. In contrast, the growth of cell lines lacking RAS mutations, such as the
Fig. 6. RIOK1 knockdown impairs NF-κB signaling. (a) NCI-H1299 and MDA-MB-231 NF-κB luciferase reporter assay measured after 48 h normalized to NS dox; data is represented as mean ± SEM with * for pb 0.05 by two-way ANOVA (Tukey); N = 3. (b and c) Induced NCI-H1299 non-silencing (NS) or shRIOK1 (R1) cells were transfected with NF-κB luciferase reporter plasmids and IKK2 coding plasmids (empty vector (e.V.), wildtype (WT), kinase dead (KD) or constitutive active (CA)) and lyzed after 48 h. Expression IKK2 was confirmed by probing lysates for Flag-tagged IKK (b) and NF-κB activity was determined (c). Data is represented by mean ± SEM with *** for p b 0.001; ** for p b 0.01 and * for p b 0.05 by two-way ANOVA (Tukey); N = 3. (d) Induced NCI-H1299 non-silencing (NS) or shRIOK1 (R1) cells were treated with Bay 11-7082 (10μM) or DMSO for 1 h followed by a 15 min stimulation with TNFα (10 ng/ml). Cell lysates for cytosolic (C) and nuclear (N) fractions were analyzed with the indicated antibodies. 14-3-3 and Lamin B were used as loading controls for cytosolic and nuclear fractions, respectively. Please note the panels for pP65, P65 and RIOK1 are composed of two exposures from the same gels. This was necessary as the abundance and consequently the signals of these proteins strongly differ between cyto- and nucleoplasm. Quantification of Western blot analysis shown in d and e is depicted below. (mean ± SEM, N = 3; unpaired two-tailed t-test). (e) NCI-H1299 non-silencing (NS) or shRIOK1 (R1) cells were stimulated with TNFα (10 ng/ml) and cytosolic lysate fractions were probed for phosphorylated IκBα N = 3. (f) NCI-H1299 non-silencing or shRIOK1 cells were seeded in 2% Matrigel and allowed to grow for 3 days before they were treated with DMSO or Bay 11-7082 (10μM) for 12 days. Scale bar: 200 μm. (See also Figs. S6 and S7).
epithelial Caco-2 cell line, the BRAFV600Eand PI3KH1047Rdriven RKO cell
line or K562 cells, driven by the potent Bcr-Abl oncoprotein, were not or only partially affected by RIOK1 knockdown. In spontaneously immor-talized MCF-10A mammary epithelial cells with or without ectopic
KRASG12Vexpression, knockdown of RIOK1 partially reverted invasive
growth in 3D culture. Thus, our data demonstrating a requirement for RIOK1 in the proliferation and invasion of carcinoma cells significantly extend thefindings by Luo et al., who first observed RIOK1 as a hit in a
synthetic lethal proliferation shRNA screen in KRASG13Dmutant DLD-1
colorectal cancer cells (Luo et al., 2009). Based on its enzymatic charac-ter, Luo et al. already suggested that further validation efforts will be re-quired to assess the addiction of RAS mutant cells to these genes and to evaluate their utility as drug targets in cancer cells (Luo et al., 2009). Further validation of RIOK1 was not conducted in this study. Since then, however, the critical role of RIOK1 in RAS mutant cells has been, in addition to the data presented in our study, further supported by the following screens. While our paper was under revision, Kiessling et al. published a CRISPR/Cas9 screen in cell lines driven by either mu-tant EGFR or NRAS (Kiessling et al., 2016). Interestingly, only the growth of the latter was affected by RIOK1 knock-out. In that regard, we used cBioPortal to investigate whether RIOK1 overexpression co-occurs with HRAS or KRAS alterations in breast and lung cancer. Although this program identified a co-occurrence for some constellations in breast cancer (Fig. S10), we suggest that this aspect needs to be validated in fu-ture studies that not only include the genetic alterations of RAS genes but also of their modifiers such as RAS inactivating GTPase activating proteins that are often lost in breast cancer by (epi)genomic events (McLaughlin et al., 2013; Olsen et al., 2017).
Likewise, data in the Achilles project database demonstrate that the “essentiality” for RIOK1 expression differs between the various cell lines and that many RAS mutant cell lines are more affected in this indepen-dent CRISPR/Cas9 screen (Fig. S11) (https://portals.broadinstitute.org/ achilles). Thus, both CRISPR/Cas9 based data sets further support our concept with an shRNA independent approach that RAS-driven tumor cells are particularly reliant on RIOK1 expression. Moreover, these data sets and our study suggest that RIOK1 depletion is not generally toxic to cells, but might represent an Achilles heel specifically for RAS-driven cancers. Indeed, knockdown studies on this highly conserved atypical kinase in C. elegans show that worms reach adulthood, although they display defects in their reproductive system (Mendes et al., 2015; Weinberg et al., 2014). Still, as the effects of RIOK1 deficiency in mam-mals remain unknown so far, these data suggest that many cell types do not rely on full RIOK1 expression or activity for survival or differentiation.
So far, RIO kinases have been mostly studied in yeast, but the few studies addressing their function in mammalian cells identified an im-portant role of all three family members in ribosomal biogenesis (Baumas et al., 2012; Ferreira-Cerca et al., 2014; Ferreira-Cerca et al., 2012; Turowski et al., 2014; Zemp & Kutay, 2007). Furthermore, RIOK1 has been implicated in cell cycle progression of the yeast Saccharomyces cerevisiae and to promote either S-phase or G2/M transi-tion (Angermayr et al., 2002). By our expression analysis of cell cycle regulators in NCI-H1299 cells, we provide confirmation that RIOK1 crit-ically contributes to proliferation in mammalian cells as well. This anal-ysis also indicates an arrest or significant delay at the G2/M checkpoint. Importantly, the strong requirement for RIOK1 for proliferation was only visible in RAS mutant cell lines, which identifies RIOK1 as potential vulnerability of RAS-driven tumors. As we could not observe a clear ef-fect of RIOK1 depletion on classical RAS-controlled signaling events, such as MEK-ERK (data not shown) or AKT phosphorylation (Figs. 5e, S4 and S5), we posit that RIOK1 does not directly interact with RAS proximal effectors such as Raf or PI3K. Instead we suggest that RIOK1 rather engages in a functional relationship with constitutively active RAS in nematodes and mammalian cells.
In the present study, we also provide insights into the hardly charac-terized RIOK1 interactome in cancer cells (Fig. 5c and Table S1). Using co-immunoprecipitation, we confirmed the well-described interaction
of PRMT5 with RIOK1 (Guderian et al., 2011), thereby validating our approach (Fig. S12). Furthermore, we observed a protein-protein inter-action of wildtype and catalytically inactive RIOK1 not only with the well-established PRMT5 interaction partner but also with itself and RIOK3, suggesting the formation of homo- and hetero-dimers as already reported by Kiburu and LaRonde-LeBlanc (Kiburu & LaRonde-LeBlanc, 2012). Given the fact that many kinases are activated by dimerization (Beenstock et al., 2016; Röring et al., 2012), one can speculate that homo- and/or hetero-dimerization of RIO kinases represents a key step in regulating their activity or expression levels.
By studying the effects of RIOK1 depletion on the (phospho-)prote-ome, we also provide evidence that the three RIO proteins, despite hav-ing non-redundant functions, cross-regulate each other. Interesthav-ingly, depletion of RIOK1 was associated with a decrease in RIOK3 levels and an increased expression and an electrophoretic mobility shift of RIOK2. A possible explanation for these observations might be the se-quential binding of RIO kinases to the pre-40S ribosomal subunit. As RIOK2first dissociates from the pre-40S subunit before or after binding of RIOK1, loss of RIOK1 could block the dissociation of RIOK2 accompa-nied with accumulation of pre-40S particles (Widmann et al., 2012). RIOK3 is reported to bind late to the pre-40S particle most likely after binding of RIOK1 (Baumas et al., 2012). Therefore, loss of RIOK1 would prevent RIOK3 binding to the pre-40S subunit and could lead to degradation of RIOK3. Our data invite for further studies addressing the stoichiometry and post-translational modification patterns of all three RIO kinases.
A strikingfinding of our study is that RIOK1 is required for the inva-sive properties of NCI-H1299 and MDA-MB-231 cells in 3D culture and in vivo. There are two potential, not mutually exclusive mechanisms explaining the requirement for RIOK1 for this phenotype. Firstly, given recentfindings that local mRNA translation represents a key regulatory event in the formation of protrusions of MDA-MB-231 cells (Mardakheh et al., 2015) and that RIOK1/2 are involved in the export and assembly of 40S ribosomal subunits into the cytoplasm (Kressler et al., 2010), it is conceivable that effector proteins critical for invasion are insufficiently produced in the cellular periphery. Secondly, the loss of invasive growth could be explained by ourfinding that RIOK1 depletion downregulates tonic NF-κB activity and several proteins linked to NF-κB activation and effector functions (Fig. 6and Tables S1 and S2). The NF-κB pathway is activated upon several stimuli like inflammation and oncogenic sig-nals, including those trigged by mutant RAS (Finco et al., 1997; Karin, 2006). In this study, we showed that RIOK1 acts in parallel to IKK com-plexes as its depletion inhibits NF-κB signaling by preventing IκBα phosphorylation and degradation and, as a consequence, translocation of RelA (P65) to the nucleus. Moreover, pharmacological NF-κB path-way inhibition at the level of IKK activation resulted in a very similar 2D and 3D growth phenotype as observed for RIOK1 knockdown. Fur-ther evidence for this hypothesis is provided by the reduced expression of the IKK substrate MTDH upon RIOK1 depletion. Although MTDH has been linked to metastases in a variety of tumor entities (Shi & Wang, 2015), the exact underlying molecular mechanisms remain elusive. However, several reports implicate MTDH as an activator and also as an NF-κB target gene (Emdad et al., 2006; Krishnan et al., 2015). Conse-quently it is conceivable that RIOK1 and MTDH depletion will quench tonic NF-κB signaling triggered by oncogenic RAS. This hypothesis is fur-ther strengthened by our preliminary data showing the reduction of several NF-κB regulated cytokines in our cell line models (data not shown) of which several have been also linked to cellular migration. Fu-ture studies will decipher the exact role of RIOK1 in NF-κB signaling and
Fig. 7. RIOK1 enables lung colonization. (a) Luciferase expressing NCI-H1299 non-silencing and shRIOK1 cells were injected i.v. in mice and tumor growth was followed using BLI for up to 98 days. (b) Ex vivofluorescence imaging of isolated lungs on day 100. N = 2. Doxycycline (2 mg/ml) was administered constantly via the drinking water. (c) Representative histological (H&E) and immunohistochemical (RIOK1) staining of the isolated lungs from this experiment and from s.c. injections (Figs. S8 and S9). Arrows point out RIOK1 positive tumor cells. Scale bar upper panel: 200μm. Scale bar middle and lower panel: 20 μm. (d) Upon s.c. injection (left), NCI-H1299 NS cells preferentially formed nodules of tumor cells (score 2), whereas shRIOK1 cells formed smaller colonies consisting of single cells (score 1). In the case of i.v. injection (right), induced NCI-H1299 shRIOK1 failed to form colonies (score 0), whereas NCI-H1299 NS and non-induced shRIOK1 cells massively infiltrated the lungs of recipient mice (score 3). N = 7 for NS and N = 8 for shRIOK1 for s.c. injections. N = 15 for NS, N = 8 shRIOK1 no dox and N = 16 for shRIOK1 dox for i.v. injection; Chi-square test. (See also Figs. S8 and S9).
of downstream effectors by which RIOK1 promotes the formation of cel-lular protrusions and metastases. However, we do not rule out that the profound effects of RIOK1 depletion on invasiveness in vitro and in vivo are of pleiotropic nature.
Regardless of the precise molecular mechanisms underlying the protrusion and metastasis impairing effect of RIOK1 depletion, our data already identify RIOK1 as a potential target for tumor therapy,
asMarjon et al. (2016) have also recently suggested for MTAP
Fig. 8. RIOK1 protein expression in human lung and breast carcinomas. (a) Representative lung adenocarcinomas (AC) and lung squamous cell carcinomas (SCC). RIOK1 protein expression was scored as follows: score 0 (no expression), score 1 (low expression) and score 2 (high expression). (b) Quantification of immunohistochemical evaluation according to the histological subtypes; N = 15 per group. (c) Representative histological (H&E) and immunohistochemical (RIOK1) staining of the lobular or the NST (no special type) subtype. (d) Comparison of RIOK1 protein expression in normal breast epithelium and breast carcinomas. N = 22 tumor and normal matched pairs. (e) RIOK1 protein expression in breast carcinomas is linked to histologic grading. (f and g) RIOK1 expression in breast carcinomas is inversely correlated to estrogen (ER) and progesterone (PR) receptor expression, but is not associated with HER2 expression. All images were taken with 20× magnification. AC Adenocarcinoma, SCC squamous cell carcinoma. Data in b, d–g are represented as % of analyzed cases and statistically analyzed by Chi-square test.
deficient tumors. Indeed, RIO kinases exhibit ATPase activity and are, as such, potentially druggable by small-molecule compounds. This makes them better suited than other synthetic lethal targets in RAS signaling networks such as transcription factors (Cox et al., 2014;
Downward, 2015). Indeed, specific inhibitors are being developed
and have already been shown to effectively compete with ATP and to block auto-phosphorylation activity in vitro (Kiburu & LaRonde-LeBlanc, 2012; Mielecki et al., 2013). However, they still need to be tested especially in the context of cancer cell growth in vitro and in vivo. Nevertheless, RIOK1 knockdown does neither im-pair the proliferation of K562 and Caco-2 cells nor the acinar mor-phogenesis of MCF-10A cells, a delicate process involving various fundamental biological processes (Debnath & Brugge, 2005). This suggests that RIOK1 depletion will not be generally toxic and there-fore potentially suitable for therapeutic strategies targeting RIOK1. Indeed,Marjon et al. (2016)observed that the growth inhibitory ef-fect of RIOK1 depletion could be rescued in both MTAP pro- and de-ficient HCT116 lines by complementation with wildtype but not with catalytically inactive RIOK1. Thisfinding identifies the enzymatic ac-tivity of this atypical kinase as a potential point for therapeutic inter-vention. According to our data, such an approach would create vulnerability for RAS-transformed cells, while having little or limited effects on healthy cells. Together with our observation that RIOK1 promotes lung colonization in mice and the differential RIOK1 ex-pression in human tumor tissue specimens, our data invite for fur-ther studies addressing RIOK1 in cancer, its prognostic significance and suitability as a drug target.
Supplementary data to this article can be found online athttp://dx. doi.org/10.1016/j.ebiom.2017.04.015.
Author Contributions
Conceptualization: FW, NR, LF, ST, JM, MK, SH, ACB, ND, FMU, AS, SL, JD, RZ and TB; Formal analysis and visualization: FW, NR, LF, ST, JM, MK, SH, ND, TS, ACB, JD, AS. Methodology: FW, NR, LF, ST, JM, MK, SH, ACB, FMU, SL, JD, RZ and TB; Investigation and Resources: all authors; Writing–Original draft: FW and TB; Funding acquisition: TB; Supervision: JD, RZ and TB.
Conflict of Interest
The authors declare no conflict of interest. Acknowledgments
This work was supported by the Deutsche Forschungsgemeinschaft via the CRC 850“Control of cell motility in morphogenesis, cancer inva-sion and metastasis”, projects B4, B8, C6 and Z1 (grants to TB, JD, RZ, SL). NR, MK and SH are supported by the Spemann Graduate School of Biology and Medicine (SGBM) GSC-4. FW, SL, RZ and TB are also supported by the Excellence Initiative of the German Federal and State Governments through EXC 294 BIOSS. TB is also supported by the Emmy-Noether and Heisenberg programs of the Deutsche Forschungsgemeinschaft (DFG) (grant no. BR 3662/1 and BR 3662/2). References
Alexia, C., Poalas, K., Carvalho, G., Zemirli, N., Dwyer, J., Dubois, S.M., Hatchi, E.M., Cordeiro, N., Smith, S.S., Castanier, C., Le Guelte, A., Wan, L., Kang, Y., Vazquez, A., Gavard, J., Arnoult, D., Bidere, N., 2013.The endoplasmic reticulum acts as a platform for ubiquitylated components of nuclear factor kappaB signaling. Sci. Sig. 6 (291), ra79.
Fig. 9. Heatmap of cellular behavior upon RIOK1 knockdown and MTAP status analysis. (a) Scoring determined based on densitometry measurements as follows: strongly decreased: reduction in expression≥ 40%; decreased: reduction in expression ≥ 20%; increased: augmented expression ≥ 50%; n.d. not determined. (b) Western blot analysis of MTAP expression in different cell lines of colon-, breast- and und lung cancer (N = 1). (c) RIOK1 knockdown does not influence MTAP expression in NCI-H1299 and MB-MB-231 cells (N = 1).