Disfluent Responses to Job Interview
Questions and What They Entail
Julie Brosy, Adrian Bangerter, and Eric Mayor
Institute of Work and Organizational PsychologyUniversity of Neuchaˆtel, Neuchaˆtel, Switzerland
Conversation is governed by expectations of timely responding. Violations of these expectations are grounds for inference by other participants. These inferences may be at odds with identities respondents try to project. In job interviews, candidates’ responses are used to make hiring decisions. Candidates trade off between (1) delaying response initiation to search for an appropriate response at the risk of appearing inept and (2) responding quicker but less appropriately. In a corpus of job interviews, response delays predicted the probability of inappropriate initial responses and decreased hireability ratings, illustrating how unintended aspects of conversational delivery can entail social and institutional consequences beyond the conversation itself.
INTRODUCTION Disfluencies in Spontaneous Speech
Spontaneous speech is disfluent by nature. Disfluencies are “phenomena that interrupt the flow of speech and do not add propositional content to an utterance”
(Fox Tree, 1995, p. 709). They include pauses, fillers, interruptions, repetitions,
repairs, or hesitations. An estimated rate of disfluencies is 6 words per 100 (Fox
Tree,1995). Disfluencies are commonly viewed as a problem in communication
(Brennan & Schober,2001; Brennan & Williams, 1995; Clark, 1994; Fox Tree,
Correspondence concerning this article should be addressed to Julie Brosy, Institute of Work and Organizational Psychology, University of Neuchaˆtel, Rue Emile-Argand 11, 2000 Neuchaˆtel, Switzerland. E-mail:[email protected]
1995; MacGregor, Corley, & Donaldson,2010; Schober & Bloom,2004; Smith &
Clark,1993): “If fluency is every speaker’s goal, then disfluency should be every
listener’s nightmare” (Fox Tree,1995, p. 709). This is because they are assimilated
to disturbances that listeners have to ignore to understand what speakers are trying to say. By such a view, then, disfluencies constitute an obstacle to comprehension. However, other studies suggest that disfluencies may constitute conversational signals that are informative to listeners, even enabling them to make inferences
about the speaker (Brennan & Schober,2001; Brennan & Williams,1995; Clark &
Fox Tree,2002; Schober & Bloom,2004; Smith & Clark,1993).
An everyday situation to study spontaneous speech production is question answering. Question answering is a social process with two goals (Smith & Clark,
1993). The first goal is exchanging information: Questioners request information
from respondents, and respondents try to give information to honor the request. The second goal is self-presentation: Respondents try to influence how they appear to the questioner or to listeners. Ideally, responses to questions are produced in a timely fashion and contain the requested information (thereby respecting the
maxim of quality; Grice,1975). Problems may emerge when respondents are not
able to reach this ideal. Because of the precision timing inherent to conversation, speaker transitions typically have very little gap or overlap (Sacks, Schegloff, &
Jefferson,1974): On average, 85% of transitions have less than 1 second gap or
overlap (De Ruiter, Mitterer, & Enfield,2006). Because the relevant next turn to a
question is a timely response, delays can signal various kinds of trouble, including understanding the question, searching for the response, or formulating the response. If responses are delayed, unsure, or unsuccessful, respondents risk negative inferences on the part of their partners, including the risk of being
considered ignorant or uncooperative (DeGroot & Motowidlo, 1999, De Ruiter
et al.,2006; Smith & Clark,1993). Not responding to a question can thus threaten
positive self-presentation, leading respondents to produce disfluencies to warn partners of upcoming delays. For example, respondents unsure about answers
produce more fillers like uh or um (Smith & Clark,1993).
Besides upcoming delays, disfluencies also reveal other information about the respondent. In the case of factual questions, response latencies are used by listeners to make inferences about respondents’ knowledge, the so-called feeling
of another’s knowing (Brennan & Williams,1995; Smith & Clark,1993). Longer
response latencies increase the likelihood of a negative evaluation of respondents’ knowledge. In survey interviews, disfluencies predict respondents’ need to clarify questions: When respondents produce such disfluencies, they are more likely to produce an inaccurate or a less reliable response (Schober &
Bloom,2004; Schober, Conrad, Dijkstra, & Ongena,2012). Taken together, then,
much evidence suggests that disfluencies are not just obstacles to successful communication. They reveal much about the further time course of the response or respondents’ internal states.
Question Answering in Job Interviews
Job interviews are one of the most widely used hiring methods (Judge, Cable,
& Higgins, 2000; Posthuma, Morgeson, & Campion, 2002). They comprise
question-answering sequences, whereby recruiters ask questions of candidates and use their answers to evaluate candidates to make hiring decisions (Coetzee
& Kriek, 2010). Despite their widespread use, the extent to which recruiter
evaluations accurately predict candidates’ future job performance is often called
into question (Anderson, 1992; Harris, 1989; Judge et al., 2000). Predictive
validity can be increased by using a structured interview format (Huffcutt &
Arthur,1994). There are multiple ways to introduce structure into job interviews
(Campion, Palmer, & Campion, 1997), but they often involve limiting
interactional options for participants. For example, questions asked by recruiters can be standardized, as well as recruiters’ evaluations of candidates’ responses. An innovation in structured interviewing is the behavioral interview (Harris,
1989; Motowidlo et al., 1992). Candidates are asked so-called past-behavior
questions about their actions in a job-related situation in the past. An example is Can you tell me about a situation where you managed to convince someone to change their opinion? From an interactional point of view, past-behavior questions invite a narrative response about the situation, actions undertaken by the candidate and related events that transpired. In other words, candidates are expected to respond to such questions by telling a story. Behavioral interviews
are increasingly used (Roulin & Bangerter, 2012), and, as a result, storytelling
skills will become more and more important for candidates (Ralston, Kirkwood,
& Burant, 2003).
How well are candidates able to answer job interview questions, and how timely are their responses? Even if candidates can and do anticipate questions they may get asked by recruiters, they typically do not prepare and practice each utterance. In this way job interviews are interesting to study because they are explicitly evaluative situations where spontaneous responses to questions are
produced by candidates, leading to potential disfluencies (Fox Tree, 1995).
However, little is known about the interactional implications of disfluencies in job interviews. They may possibly predict the further time course of a response or reveal candidates’ misunderstandings as in survey interviews (Schober & Bloom,
2004). This study therefore explores implications of disfluencies in the context of
job interviews. We focused mainly on one specific disfluency, candidates’ pause durations between recruiters’ question offset and candidates’ response onset.
This Study
Disfluencies and candidate responses. Given that past-behavior
often respond to them by telling stories. There are little data on this issue, but one study found that in fact only 23% of responses to past-behavior questions are
stories (Bangerter, Corvalan, & Cavin,2014). Two main problems could prevent
candidates from producing narrative responses. First, it may be unclear for candidates whether a story is warranted. Storytelling requires would-be narrators and their audience to collaboratively suspend normal turn-taking rules and agree
to engage in an extended turn at talk by the narrator (Mandelbaum, 2012).
Candidates may be hesitant to engage in this process in an unfamiliar and high-stakes situation like a job interview. If candidates are not sure about the response type expected, they may delay their response. Second, it may not be easy to produce a story on demand. Producing narratives requires candidates to search memory for a relevant event. The event has to be representative of the competency evaluated in the question (a relevant event for the competency stress management might be for example successfully managing multiple stressful situations happening at the same time: moving to another country, living alone for the first time, dealing with administrative issues). Then candidates have
to prepare speech (Levelt, Roelofs, & Meyer, 1999), following the typical
constituent parts of a well-narrated story: abstract, orientation, complicating
action, evaluation, resolution, and coda (Norrick, 2007). This preparation takes
time and may also delay the response.
As a result of these multiple challenges, candidates may face a trade-off between (1) delaying responding to search for and prepare an appropriate response at the risk of appearing inept and (2) responding quicker but perhaps less appropriately (e.g., in non-narrative form). A lengthy search-and-preparation delay might ultimately be unsuccessful if candidates fail to find an appropriate response. Memory search may be successful and lead to the production of a narrative response, but it may also be unsuccessful and lead to the production of a non-narrative response. Therefore, pause durations in responses to past-behavior questions may be related to the response type (narrative or non-narrative) produced by candidates. We aim to investigate this relation, which could be potentially nonlinear as described above: Longer pause durations may predict success in producing a narrative response, but too-long durations may be harbingers of aborted narrative responses. We thus formulate Research Question 1: Does the pause duration between a recruiter’s question offset and a candidate’s response onset predict the response type (narrative or non-narrative) produced by candidates?
Disfluencies and candidate self-presentation. In job interviews,
candidates usually want to make a good impression on recruiters to increase their chances of ultimately getting hired. Indeed, an important predictor of recruiter evaluations and hiring recommendations is their subjective impression of candidates, and this impression can be influenced by candidate self-presentation
(Stevens & Kristof, 1995). Candidates intentionally use a range of direct impression management tactics, including ingratiation or self-promotion, and indirect tactics, like enhancing or protecting information about people or things
with which they are associated (Cialdini, 1989; Cialdini & Richardson, 1980).
However, impressions conveyed by self-presentation may not only result from intentional behavior of candidates.
Goffman (1959) famously distinguished between impressions given and given
off. Information given involves symbols (often verbal) that are intentionally used to convey information attached to these symbols. Information given off is involuntarily expressed, for example, “leaks” that may reveal unintended aspects of the self to an audience. These two kinds of information may contradict each other.
Applying this distinction to the present study, information and impressions conveyed by disfluencies (e.g., response delays) are given off. As in any conversation, job interview question answering between candidates and recruiters is governed by expectations of timely responding. If candidates violate these expectations, they face the probability of being negatively evaluated by recruiters and be considered as ignorant, for example (DeGroot & Motowidlo,
1999, De Ruiter et al.,2006; Smith & Clark,1993). Recruiters may thus use pause
duration (i.e., information given off) to form impressions and make judgments of candidate suitability and hiring decisions. In that way long pauses may adversely affect recruiter judgments of hireability.
Therefore, responding fluently, e.g., without excessive delay, could be an unintended but efficient means of self-presentation. Conversely, disfluent responding might threaten self-presentation goals and lead to negative recruiter evaluations (e.g., hiring recommendations). We therefore formulate Research Question 2: Does the pause duration between a recruiter’s question offset and a candidate’s response onset predict recruiter evaluations?
We investigated these two research questions using data gathered for another research project on sensing of candidate nonverbal behavior (Frauendorfer, Mast,
Nguyen, & Gatica-Perez, 2014). Candidates applied for a research assistant
position. The database comprised 62 videotaped job interviews featuring four past-behavior questions. A panel of professional recruiters made hiring recommendations for each candidate. We reanalyzed the data by measuring candidates’ pause durations between recruiters’ question offset and candidates’ response onset and using them as predictors of response type (Research Question 1) and recruiter hiring recommendations (Research Question 2). In investigating Research Question 2 we controlled for a range of ancillary variables (e.g., personality, general mental ability [GMA], and the like) using
data available from the original study and from Bangerter et al. (2014), who
investigated the impact of different response types on hiring recommendations controlling for the abovementioned ancillary variables and found that response
types influenced hiring recommendations, for example, narrative responses were associated with better hiring recommendations. Research Question 2 goes
beyond Bangerter et al. (2014) by controlling for the same ancillary variables and
response type to test the additional effect of delays. We thus expect delays to explain additional variance above and beyond response types. Finally, in the present study we also conducted a descriptive analysis of the main types of disfluencies produced other than pause duration.
METHODS Participants
Sixty-two candidates (45 men, 17 women, 59 students, mean age 23.7 years
[SD¼ 3.8]) were recruited for the study at a French-speaking Swiss university.
Candidates had already participated in 3.1 job interviews on average (SD¼ 1.3).
Procedure
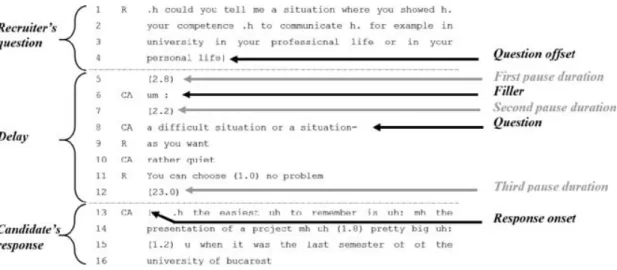
Candidates responded to a job advertisement for a research assistant position, the main activity of which was to recruit participants for another study. On arrival in the lab they took a GMA test and filled out personality and skills questionnaires before undergoing a behavioral interview (average duration, 11 minutes). As part of the interview questions all candidates were asked four past-behavior questions about their competencies of communication, persuasion, organization, and stress management (these competencies were mentioned in the advertisement). The question wording was Can you tell me about a situation where you showed your competency for X? Candidates answered the question in the way they saw fit. When the candidate was done, the interviewer did not ask any follow-up questions but moved on to the next question.
Transcription
Interviews were videotaped and responses to past-behavior questions initially transcribed word-for-word. Transcriptions contained also fillers (for example uh or um), discourse markers (for example well), laughs, and sighs. We retranscribed the talk around the recruiter’s question offset and candidates’ response onset in detail using the Transana software package (University of Wisconsin-Madison Center for Education Research, Madison, WI). We also coded the pause duration between question offset and response onset as a measure of delayed responding
(see pause duration in Coding below and Figure 1). All examples reported here
Measures
Communication skills
Self-reported communication skills were assessed by 13 items based on the
Social Skills Inventory (Riggio, 1986). An example item is In general I
communicate in a clear manner. Items were answered on a Likert scale from 1
(not at all) to 5 (very much), alpha ¼ .89.
Persuasion skills
Self-reported persuasion skills were assessed by six items based on the Social
Skills Inventory (Riggio, 1986). An example item is I often succeed in selling
my point of view. Items were answered on a Likert scale from 1 (not at all) to
5 (very much), alpha¼ .79.
Personality. Candidates responded to 60 items measuring the five traits of
the Revised NEO Personality Inventory (Costa & McCrae, 1992): neuroticism
(alpha¼ .83), extraversion (alpha ¼ .72), openness (alpha ¼ .71, with one item
removed), agreeableness (alpha¼ .67, with one item removed), and
conscien-tiousness (alpha ¼ .89). Items were formulated as assertions, an example for
agreeableness is I try to be courteous to everyone I meet. Items were answered on a Likert scale from 1 (not at all) to 5 (very much).
GMA. GMA was assessed by the Wonderlic Personnel Test (Wonderlic,
2001), which measures vocabulary, arithmetic reasoning, and spatial ability.
Candidates had 12 minutes to answer up to 50 questions. The test score is the percentage of questions correctly answered.
Hiring recommendation. Hiring recommendations were made by five
professional recruiters who had between 2 and 10 years of experience in recruiting.
Recommendations were made on a scale of 0% (weakest recommendation) to 100% (strongest recommendation). One recruiter viewed and rated videotapes of all candidates. The others viewed and rated a subset of the videotapes, such that each candidate was rated by three recruiters; the mean of the three ratings was computed. Recruiters also had access to candidates’ personality scores, communication and persuasion self-reported skills, and GMA scores. Interrater
reliability was computed via intraclass correlations, ICC[1]¼ .50, ICC[2] ¼ .75,
F¼ 4.45, p , .05.
Responsiveness. Responsiveness was measured by counting the number
of words for each candidate’s response to each past-behavior question. We then aggregated over all four questions to produce a mean score per candidate.
Coding
Response type. We coded candidates’ initial responses in two categories,
narrative response and non-narrative response. These two categories were obtained by collapsing five different response types distinguished in Bangerter
et al. (2014). Narrative responses feature responses about particular episodes or
sets of episodes featuring candidate actions described more or less concretely. They collapse across stories, pseudo-stories, and exemplifications. A story was
defined by Bangerter et al., (2014) as a set of events related to a unique past
episode, characterized by a unity of time or action, which constituents often linked by temporal markers (e.g., then). A pseudo-story was defined as a description of a generic episode or recurrent set of similar episodes, without unity of time or action. It differs from a story in that it is a description of several events rather than of a unique event. As a result, pseudo-stories are typically more abstract than stories. Exemplification was defined as a part of a pseudo-story featuring a brief mention of specific contextual information, often marked by for example. Non-narrative responses are decontextualized assertions about the self. They collapse across values or opinions and self-descriptions. Interrater
agreement for the five response types originally coded by Bangerter et al. (2014)
was high (Cohen’s kappa varied between .74 and 1 based on double-coding of 24 responses). Because collapsing the five response types into narrative versus non-narrative categories can be done automatically, no additional check of interrater agreement is necessary. We computed the proportion of responses (out of 4) which featured each response type (i.e., scores could be either 0, .25, .50, .75, or 1).
Pause duration. Following Clark and Wasow (1998), we coded events
happening during a delay, that is, between the question offset and the response onset. We coded pauses (and their duration) separately from other events.
A pause was defined as a period of time where neither party produced speech. We measured pause duration using the ELAN software package (Wittenburg,
Brugman, Russel, Klassmann, & Sloetjes, 2006). We used the sound curve to
measure the time between the recruiter’s question offset and the candidate response onset. We measured all pauses until the response onset, so there often were several pauses because sometimes candidates produced other phenomena
(e.g., fillers or discourse markers, see Figure 1). Interrater agreement, based
on double-coding of 12 candidates (76 pauses), was high (r¼ .99, p , .001).
An example of this coding is provided inFigure 1: We coded the first pause (2.1)
and the second pause (1.0). But then the candidate initiated a response, so we did not code the third pause (.8). This candidate thus produced two pauses during the delay. We then computed the total pause duration by adding all pauses in the
same delay. For example, in Figure 1 the total pause duration is 3.1 seconds.
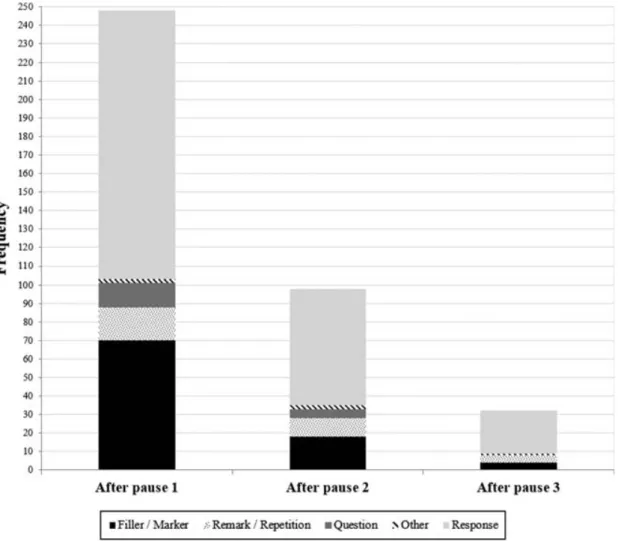
Finally, we coded five categories of other events produced by the candidates during the delay: response (the candidate produced the response to the recruiter’s question, with or without fillers or markers after the pause), filler/marker (the candidate produced only a filler and/or a discourse marker after the pause), question (the candidate responded to the recruiter’s question with another question, e.g, A difficult situation or a calm situation? with or without fillers or
discourse markers after the pause [see Figure 2]), remark/repetition (the
candidate repeated part of the question [seeFigure 3] or the candidate produced a
remark [seeFigure 4]), and other (e.g., the candidate laughed or sighed after the
pause). Interrater agreement, based on double-coding of 62 delays (96 events),
was high (Cohen’s kappa¼ .85). Note that after the first pause, five responses
were preceded by a question but without a second pause. Because we coded only the initial response, they are categorized as questions and not as responses. After the second pause two responses are preceded by a question and one by a remark but without a third pause.
Analysis
We first conducted descriptive analyses of the various events that occurred during the delays of all 248 responses (62 participants, 4 responses each). We investigated Research Question 1 via multilevel logistic regression to predict response type from total pause duration. We used logistic regression because our dependent variable (response type) was binary (narrative vs. non-narrative). One candidate did not answer one question, so we analyzed 247 responses. We used multilevel modeling with random effects because the 247 responses (level 1) are nested in 62 candidates (level 2). We thus modeled candidates as a random effect. We centered the predictors using the grand mean
centering method (Hox, 2002; Paccagnella, 2006; West, Aiken, & Krull,1996).
We first calculated a null model, with candidates modeled as random effect but no predictors. Then we fitted a multilevel model with total pause duration and total pause duration (squared) as linear and curvilinear predictors. We used both linear and curvilinear predictors because of the potentially nonlinear relations discussed in the introduction. We additionally controlled for extraversion because of the significant correlation between extraversion and total pause
duration (Table 1). We then transformed the estimates of total pause duration and
total pause duration (squared) from log odds into a theoretical probability curve. To answer Research Question 2 we used hierarchical multiple regression to predict hiring recommendations from total pause duration by candidate. Because the hiring recommendations were made for candidates and not for
FIGURE 4 Example of response delay with remark. FIGURE 3 Example of response delay with repetition.
TA BLE 1 Means (M ), standa rd de viation s (SD ) and corre lations for main study varia bles Variable M S D 1 2 3 4 56789 1 0 1 1 1 2 1 3 1 4 1 5 1 6 1 7 1. Gender .73 .45 .15 2 .06 2 .10 .26* 2 .14 2 .03 2 .10 .16 2 .43** 2 .19 .26* .15 .17 .05 .07 .25* 2. E 3.98 .49 .15 .40** .07 2 .42** .26* .25* .23 2 .09 .11 .10 .10 .02 .17 .11 2 .18 .40** 3. A 4.11 .46 2 .06 .40** .09 2 .29* .32* .28* .00 2 .02 .19 2 .10 .21 2 .16 .15 .01 2 .07 .09 4. O 3.69 .55 2 .10 .07 .09 .07 2 .04 .03 .19 .00 .19 .10 .01 2 .07 .05 .10 2 .09 .05 5. N 2.25 .61 .26* 2 .42** 2 .29* .07 2 .50** 2 .20 2 .12 .11 2 .31* 2 .17 .09 .04 2 .15 2 .14 .12 2 .12 6. C 4.10 .64 2 .14 .26* .32* 2 .04 2 .50** .45** .25 2 .18 .23 .02 2 .05 2 .11 .16 .17 2 .11 .12 7. Comm. 3.83 .59 2 .03 .25* .28* .03 2 .20 .45** .48** 2 .14 .00 .02 .04 2 .07 .10 .03 2 .10 .13 8. Persuas. 3.98 .55 2 .10 .23 .00 .19 2 .12 .25 .48** 2 .16 2 .02 .11 2 .06 2 .24 .07 2 .18 2 .31* .24 9. GMA .69 .14 .16 2 .09 2 .02 .00 .11 2 .18 2 .14 2 .16 2 .18 2 .08 .20 .38** 2 .18 2 .01 2 .17 .16 10. Resp. 128.46 56.57 2 .43** .11 .19 .19 2 .31* .23 .00 2 .02 2 .18 .44** 2 .46** 2 .10 .33** .05 2 .04 .17 11. Story .41 .34 2 .19 .10 2 .10 .10 2 .17 .02 .02 .11 2 .08 .44** 2 .69** 2 .27* .00 2 .04 2 .03 .26* 12. Pseudo. 1.15 .36 .26* .10 .21 .01 .09 2 .05 .04 2 .06 .20 2 .46** 2 .69** .32* 2 .04 .08 2 .05 .04 13. Exempl. .27 .34 .15 .02 2 .16 2 .07 .04 2 .11 2 .07 2 .24 .38** 2 .10 2 .27* .32* 2 .08 .14 .03 .02 14. V/O .48 .40 .17 .17 .15 .05 2 .15 .16 .10 .07 2 .18 .33** .00 2 .04 2 .08 .11 2 .11 .18 15. Self-d. .47 .46 .05 .11 .01 .10 2 .14 .17 .03 2 .18 2 .01 .05 2 .04 .08 .14 .11 2 .07 2 .25* 16. Pause 3.30 5.34 .07 2 .18 2 .07 2 .09 .12 2 .11 2 .10 2 .31* 2 .17 2 .04 2 .03 2 .05 .03 2 .11 2 .07 2 .38** 17. Hir. Rec. 59.73 19.15 .25* .40** .09 .05 2 .12 .12 .13 .24 .16 .17 .26* .04 .02 .18 2 .25* 2 .38** *** p , .001. ** p , .01. * p , .05. þ p , .08. No te . N ¼ 62. Ge nder: 0 ¼ men, 1 ¼ wome n. E ¼ extraversi on. A ¼ ag reeableness. O ¼ openn ess. N ¼ neurotici sm. C ¼ consci entious ness. Comm. ¼ Co mmunicat ion ski lls. Persua s. ¼ Persuasion ski lls. GMA ¼ ge neral men tal abilit y. Resp .¼ res ponsiven ess. Story ¼ Propor tion of quest ions answer ed with a story. Pseudo. ¼ Propor tion of quest ions answer ed with a pseud ost ory. Exempl .¼ Prop ortion of quest ions feat uring exemplification. V/O ¼ Prop ortion of quest ions answ ered by expre ssing a valu e o r an opinion. Sel f-d. ¼ Propor tion of questio ns answer ed with a self-description. Paus e ¼ tota l pause duration by candi dates (4 interactions). Hir. Rec. ¼ hiring reco mmend ation.
responses (n¼ 62), we calculated the total pause duration by candidate by adding
the pause duration for the four responses (M¼ 15.20, SD ¼ 12.73). We entered
ancillary predictor variables as control variables in Model 1 as follows: gender, candidates’ scores for the Big Five traits, communication skills, persuasion skills, GMA, responsiveness, and scores for each response type. In Model 2 we entered total pause duration as predictor. Thus, the regression analysis tests the effect of total pause duration on hiring recommendations controlling for all the other information the recruiters had at their disposal and thus constitutes a stringent test of Research Question 2.
RESULTS
Descriptive statistics for main study variables appear in Table 1. More specific
descriptive statistics of pause duration appear in Table 2. In Table 2 each
response is preceded by an initial pause of 1.88-second duration on average. After
the first pause responses were initiated 60.5% of the time (Figure 5). In the
remaining 98 cases a second pause of 2.69 seconds on average occurred (after a
filler or other event) (Table 2). After the second pause responses were initiated
67.3% of the time (Figure 5). In the remaining 32 cases, a third pause of 4.13
seconds on average occurred (after a filler or other event). The total pause
duration varies widely, from .1 second to 35.0 seconds. Figure 5 shows the
various events that occurred after the first three pauses. The most frequent events between the first three pauses were fillers or discourse markers.
Research Question 1 was Does the pause duration between a recruiter’s question offset and a candidate’s response onset predict the response type (narrative or non-narrative) produced by candidates? Initial responses are
narrative 82.6% of the time (n¼ 247). The results of the multilevel logistic
regression showed that total pause duration significantly predicts response type (Table 3). Each additional second of pausing increases the odds of producing
TABLE 2
Means (M), standard deviations (SD), minimum and maximum of pause duration by response delay (s)
N Mean SD Minimum Maximum
Pause 1 248 1.88 2.17 0.1 21.0 Pause 2 98 2.69 1.93 0.1 10.0 Pause 3 32 4.13 4.37 0.6 23.0 Pause 4 9 5.72 8.30 1.8 27.4 Pause 5 3 1.67 0.76 0.8 2.2 Pause 6 1 9.50 — 9.5 9.5
a non-narrative response by 21%. Total pause duration squared also just
significantly (p¼ .05) predicts response type, but this effect is smaller.Figure 6
shows the relation between total pause duration and the theoretical probability of producing a non-narrative response, calculated from the model estimates.
Research Question 2 was Does the pause duration between a recruiter’s question offset and a candidate’s response onset predict recruiter evaluations?
Table 4shows the results of the hierarchical multiple regressions. Model 2 shows that gender, responsiveness, and the proportion of stories and pseudo-stories produced (both subsumed in the analyses for Research Question 1 as narrative responses) emerged as significant predictors of hiring recommendations. However, even after controlling for these ancillary variables and for response types, total pause duration significantly and negatively predicts hiring
recommendations, b¼ –.45, t(61) ¼ 2.91, p , .01. The additional variance
explained is significantly different from zero, F(1, 45)¼ 3.99, p , .001.
Therefore, longer pause durations decrease hiring recommendations.
TA BLE 3 Summa ry of null m odel and mult ileve l logis tic reg ress ion predict ing the type of resp onse (na rrative ¼ 0, non-n arrative ¼ 1) Nu ll Model Multi level model Rand om effects Na me Varian ce Std. Dev Nam e Vari ance Std. De v Cand idates Interc ept 0.99 1.00 Intercept 0.93 0.96 Fixed effects Est imate Std.Err or Odds ratio Pr( , jz j) Estimate Std . Erro r Odds rat io Pr( , jz j) Interc ept 2 1.87 0.29 0.85 , .001 *** 3.54 2.03 34.4 2 .08 þ Tot al pause durati on 0.19 0.07 1.21 .01 ** Tot al pause durati on 2 2 0.01 0.00 0.99 .05 * Ext raversion 0.44 0.50 1.56 .37 Log-2 likeliho od 2 111. 86 2 107. 76 x 2 8.19* *** p , .001 . * * p , .01. ** p , .05. þ p , .08.
DISCUSSION
Previous studies suggested that disfluencies are not just obstacles to successful communication but can reveal much about the further time course of responses or
respondents’ internal states (Clark & Brennan, 1991; Schober & Bloom, 2004;
Schober et al., 2012; Smith & Clark, 1993). We extended this research and
studied, in a corpus of job interviews, the impact of disfluencies, more specifically of response delays, on the type of response produced by candidates and hireability ratings made by recruiters. We were interested in studying if pause durations can predict candidates’ response type and recruiters’ hireability ratings. The descriptive results indicated that job interviews constitute situations affording large and complex variations in response delays. Some candidates needed a short pause before producing their response, whereas others needed much more time, up to six pauses and 35 seconds, often including various
disfluencies (Figure 5). Delays often lasted several seconds. How does this
pattern of results compare with disfluent speech in other conversational settings?
In the Smith and Clark (1993) study of answering factual, general-knowledge
questions, average pauses accompanying the fillers uh and um were 2.65 and 8.83 seconds, respectively. We found similar results, with average overall pauses to respond to one question between 1.88 and 9.50 seconds. These durations are of course much higher than turn transitions in everyday conversation (De Ruiter
FIGURE 6 Probability of producing a non-narrative response (vs. narrative response) according to total pause duration (s).
et al.,2006), probably because the high-stakes nature of job interviews requires reflection and planning from candidates, and their responses have important outcomes beyond the conversation itself (i.e., getting hired).
Research Question 1 investigated if the pause duration between the recruiter’s question offset and candidates’ response onset predicts the type of response (narrative vs. non-narrative). Results showed that delays decrease the probability of a narrative response. This suggests that candidates may initially set out to plan and produce a (more appropriate) narrative response, but, as time goes by, they may ultimately decide to abort such a response in favor of initiating speech, perhaps because they have difficulty retrieving an appropriate episode from memory. This suggests that they face a trade-off between (1) delaying response
TABLE 4
Summary of hierarchical multiple regression predicting hiring recommendation
Model 1 Model 2 Variable B SE B B SE B Intercept 264.54 36.92 232.47 35.98 Gender 12.82* 5.76 13.16* 5.35 E 11.85* 5.29 9.26 4.99 A 2.76 3.96 2.81 3.67 O 1.32 4.37 .29 4.07 N 26.44 5.72 25.73 5.31 C 3.94 4.12 3.19 3.83 Comm. .51 4.32 1.87 4.03 Persuas. 3.99 4.82 1.63 4.55 GMA 29.96 16.69 23.07 15.66 Resp. .11* .05 .09 .05 Story 20.19* 8.68 21.07* 8.06 Pseudo. 19.69* 8.77 19.44* 8.14 Exempl. 22.21 7.40 22.45 6.86 V/O 2.60 5.90 1.99 5.47 Self-d. 213.50* 4.74 213.93** 4.40 Pause 2.45** .16 Adj. R2 .35 .44 F for R2change 3.18** 3.99*** *p, .05. **p , .01. ***p , .001.
Note. N¼ 62. Gender: 0 ¼ men, 1 ¼ women. E ¼ extraversion. A ¼ agreeableness. O ¼ openness. N¼ neuroticism. C ¼ conscientiousness. Comm. ¼ Communication skills. Persuas. ¼ Persuasion skills. GMA ¼ general mental ability. Resp. ¼ responsiveness. Story ¼ Proportion of questions answered with a story. Pseudo.¼ Proportion of questions answered with a pseudostory. Exempl.¼ Proportion of questions featuring exemplification. V/O ¼ Proportion of questions answered by expressing a value or an opinion. Self-d.¼ Proportion of questions answered with a self-description. Hir. Rec.¼ hiring recommendation. Pause ¼ total pause duration by candidates (4 interactions).
initiation to find an appropriate response but at the risk of not being able to find such a response and appearing inept and (2) responding faster but perhaps less appropriately. The additional quadratic effect of pause duration on response type suggests that candidates may sometimes be successful in retrieving a suitable episode to construct a narrative response with (however, the effect size is small and thus we would tend to interpret this quadratic effect with some circumspection). Individual candidates may have different thresholds above which they consider they have delayed too long and need to initiate a response— or such thresholds may also partly reflect the particular conversational situation (e.g., cues of impatience or on the contrary reassurance from the interviewer). The effect of pause duration on response type also suggests that candidates may be partly aware of the self-presentational implications of timely responding. In other question-answering situations respondents who do not know the answer to a question might more easily admit this; in job interviews initiating a response, even a potentially inappropriate one, seems preferable to saying I don’t know. Indeed, only 1 response of 248 was a direct admission of inability to answer the question.
Research Question 2 investigated whether the pause duration between the recruiter’s question offset and candidates’ response onset predicts the hiring recommendation made by recruiters. Results show that delays negatively predict hiring recommendations. Delayed responses may thus influence inferences made by recruiters. In the context of factual questions, longer delays increased the likelihood of a negative evaluation of respondents’ knowledge—the feeling of
another’s knowing (Brennan & Williams, 1995). A similar process may have
occurred in our job interviews. Recruiters may have made inferences about some aspect of candidates’ abilities or qualifications, thus leading them to decrease hiring recommendations. Conversely, responding to job interview questions without excessive delay increases the chances of a positive evaluation and is therefore useful for candidates to know. We know that verbal responses and nonverbal behavior (e.g., frequent eye contact or smiling) influence recruiters’ impressions and evaluations and that candidates, if aware of this, can use such tactics to manage impressions and influence recruiters in a positive way (Stevens
& Kristof, 1995). Similarly, disfluencies may constitute a kind of paradata
(Couper,2000; Schober et al.,2012) that have not been investigated that much in
the context of self-presentation and impression management (but see DeGroot &
Motowidlo,1999). As discussed in the Introduction, responding with appropriate
timing and response type to a job interview question could be seen as given off
information (Goffman,1959) that contributes to positive self-presentation. In any
case the fact that delayed responses decrease hiring recommendations suggests that candidates face an authentic tradeoff between responding quickly (and thus avoiding being penalized) and responding well (less appropriate answers are also
This study has some limitations. First, although we found that delays predict candidates’ responses, our results do not directly reveal their cognitive processes. We assumed that candidates who produced an inappropriate response either did not know how to respond or could not recall a story to tell. However, these interpretations imply that candidates know they have to produce a story but have trouble producing one. Yet, as raised in the Introduction, sometimes it is unclear for candidates whether a story is warranted. Therefore, we do not know for sure what processes led candidates to produce an inappropriate response. Thus, a delay followed by an inaccurate response could either reflect the fact that candidates do not know the response type expected by recruiters or are unable to produce that type of response. A potential experimental follow-up study to exclude this possibility might consist of instructing candidates how to respond appropriately before the interview. If candidates in such a condition are faster to respond than those without instruction, then part of the response delay is probably due to not knowing what type of response is expected. A (similar) second limitation is that although recruiters negatively evaluate candidates who respond with (excessive) delays, we do not know what inferences they may have made about the candidates that caused their negative evaluations (but see
DeGroot & Motowidlo, 1999). To deal with this limitation, future research
might explicitly ask researchers to verbalize their inference processes while
watching the videos (Hall & Schmid Mast, 2007). A third limitation concerned
the interviewer’s behavior during the interview. She did not produce any probes, prompts, or ask any follow-up questions but directly moved on to the next question. This highly structured format, leading to a lack of interaction, may have been disturbing for candidates and may have affected candidates’ behavior. Future research might study the impact of more interactive behavior on candidates’ response parameters. A fourth limitation concerned our focus of research: We analyzed only the impact of disfluencies before response initiation and not the impact of disfluencies during the response. Perhaps the impact of disfluencies is less important once the response has started. Or it might be that more disfluencies occur when responses are less appropriate. Future research
could pursue these questions.1A fifth limitation concerns the sample size, which
is on the small side relative to the regression analyses.
Despite these limitations, our results extend understanding of disfluent responses to questions in several ways. Disfluencies are not just errors of speech production and obstacles to understanding but can constitute an important window on cognitive and interactional processes in high-stakes question-answering settings. Moreover, they affect interpersonal judgments on the part of conversational partners.
1
In the context of job interviews, these judgments have consequences that potentially extend well beyond the conversation itself, by influencing hiring evaluations.
Our findings also have implications for training candidates and recruiters in job interview interactions. Candidates could be trained to recognize when stories are warranted and trained to prepare interviews accordingly. Recruiters could be trained to encourage story production in candidates, for example by getting candidates comfortable, letting them take their time to respond, or showing more interactive behavior and using probes and follow-up questions.
This study demonstrated that disfluencies can provide important insights in the context of job interviews, for both candidates and recruiters. However, disfluencies remain underexplored and constitute an important topic for future investigations.
FUNDING
The study was funded by a Swiss National Science Foundation Sinergia project (Interactional Competences in Institutional Practices: Young People between School and the Workplace, CRSII1_136291). We thank Paloma Gosteli for her help in the data preparation. The data were initially obtained from another Swiss National Science Foundation Sinergia project, SONVB, FNCRSII2-127542/1. We thank Dr. Daniel Gatica-Perez, IDIAP, Dr. Marianne Schmid Mast, University of Neuchatel, and Dr. Tanzeem Choudhury, Cornell University, for granting us access to their data.
REFERENCES
Anderson, N. R. (1992). Eight decades of employment interview research: A retrospective meta-review and prospective commentary. European Work and Organizational Psychologist, 2, 1 – 32. Bangerter, A., Corvalan, P., & Cavin, C. (2014). Storytelling in the selection interview? How
applicants respond to past behavior questions. Journal of Business and Psychology, 29, 593 – 604. Brennan, S. E., & Schober, M. F. (2001). How listeners compensate for disfluencies in spontaneous
speech. Journal of Memory and Language, 44, 274 – 296.
Brennan, S. E., & Williams, M. (1995). The feeling of another0s knowing: Prosody and filled pauses as cues to listeners about the metacognitive states of speakers. Journal of Memory and Language, 34, 383 – 398.
Campion, M. A., Palmer, D. K., & Campion, J. E. (1997). A review of structure in the selection interview. Personnel Psychology, 50, 655 – 702.
Cialdini, R. B. (1989). Indirect tactics of image management: Beyond basking. In R. A. Giacalone & P. Rosenfeld (Eds.), Impression management in the organization (pp. 45 – 56). Hillsdale, NJ: Erlbaum.
Cialdini, R. B., & Richardson, K. D. (1980). Two indirect tactics of image management: Basking and blasting. Journal of Personality and Social Psychology, 39, 406 – 415.
Clark, H. H. (1994). Managing problems in speaking. Speech Communication, 15, 243 – 250. Clark, H. H., & Brennan, S. E. (1991). Grounding in communication. In L. B. Resnick, J. M. Levine, &
S. D. Teasley (Eds.), Perspectives on socially shared cognition (pp. 127 – 149). Washington, DC: American Psychological Association.
Clark, H. H., & Fox Tree, J. E. (2002). Using uh and um in spontaneous speaking. Cognition, 84, 73 – 111.
Clark, H. H., & Wasow, T. (1998). Repeating words in spontaneous speech. Cognitive Psychology, 37, 201 – 242.
Coetzee, M., & Kriek, H. (2010). Recruitment and selection. In M. Coetzee & D. Schreuder (Eds.), Personnel psychology. An applied perspective (pp. 134 – 169). Cape Town, South Africa: Oxford University Press.
Costa, P. T., & McCrae, R. R. (1992). Normal personality assessment in clinical practice: The NEO Personality Inventory. Psychological Assessment, 4, 5 – 13.
Couper, M. P. (2000). Usability evaluation of computer-assisted survey instruments. Social Science Computer Review, 18, 384 – 396.
DeGroot, T., & Motowidlo, S. J. (1999). Why visual and vocal interview cues can affect interviewers’ judgments and predict job performance. Journal of Applied Psychology, 84, 986 – 993.
De Ruiter, J. P., Mitterer, H., & Enfield, N. J. (2006). Projecting the end of a speaker’s turn: A cognitive cornerstone of conversation. Language, 82, 515 – 535.
Fox Tree, J. E. (1995). The effects of false starts and repetitions on the processing of subsequent words in spontaneous speech. Journal of Memory and Language, 34, 709 – 738.
Frauendorfer, D., Mast, M. S., Nguyen, L., & Gatica-Perez, D. (2014). Nonverbal social sensing in action: Unobtrusive recording and extracting of nonverbal behavior in social interactions illustrated with a research example. Journal of Nonverbal Behavior, 38, 231 – 245.
Goffman, E. (1959). The presentation of self in everyday life. Oxford, UK: Doubleday.
Grice, H. P. (1975). Logic and conversation. In P. Cole & J. L. Morgan (Eds.), Syntax and Semantics (pp. 41 – 58). New York, NY: Academic Press.
Hall, J. A., & Schmid Mast, M. (2007). Sources of accuracy in the empathic accuracy paradigm. Emotion, 7, 438 – 446.
Harris, M. M. (1989). Reconsidering the employment interview: A review of recent literature and suggestions for future research. Personnel Psychology, 42, 691 – 726.
Hox, J. (2002). Multilevel analysis techniques and applications. Mahwah, NJ: Erlbaum.
Huffcutt, A. I., & Arthur, W. (1994). Hunter and Hunter (1984) revisited: Interview validity for entry-level jobs. Journal of Applied Psychology, 79, 184 – 190.
Judge, T. A., Cable, D. M., & Higgins, C. A. (2000). The employment interview: A review of recent research and recommendations for future research. Human Resource Management Review, 10, 383 – 406.
Levelt, W. J., Roelofs, A., & Meyer, A. S. (1999). A theory of lexical access in speech production. Behavioral and Brain Sciences, 22, 1 – 38.
MacGregor, L. J., Corley, M., & Donaldson, D. I. (2010). Listening to the sound of silence: Disfluent silent pauses in speech have consequences for listeners. Neuropsychologia, 48, 3982 – 3992. Mandelbaum, J. (2012). Storytelling in conversation. In J. Sidnell & T. Stivers (Eds.), The handbook
of conversation analysis (pp. 492 – 508). Chichester, UK: John Wiley & Sons.
Motowidlo, S. J., Carter, G. W., Dunnette, M. D., Tippins, N., Werner, S., Burnett, J. R., & Vaughan, M. J. (1992). Studies of the structured behavioral interview. Journal of Applied Psychology, 77, 571 – 587.
Norrick, N. R. (2007). Conversational storytelling. In D. Herman (Ed.), The Cambridge companion to narrative (pp. 127 – 141). Cambridge, UK: Cambridge University Press.
Paccagnella, O. (2006). Centering or not centering in multilevel models? The role of the group mean and the assessment of group effects. Evaluation Review, 30, 66 – 85.
Posthuma, R. A., Morgeson, F. P., & Campion, M. A. (2002). Beyond employment interview validity: A comprehensive narrative review of recent research and trends over time. Personnel Psychology, 55, 1 – 81.
Ralston, S. M., Kirkwood, W. G., & Burant, P. A. (2003). Helping interviewees tell their stories. Business Communication Quarterly, 66, 8 – 22.
Riggio, R. E. (1986). Assessment of basic social skills. Journal of Personality and Social Psychology, 51, 649 – 660.
Roulin, N., & Bangerter, A. (2012). Understanding the academic – practitioner gap for structured interviews: “Behavioral” interviews diffuse,”structured” interviews do not. International Journal of Selection and Assessment, 20, 149 – 158.
Sacks, H., Schegloff, E. A., & Jefferson, G. (1974). A simplest systematics for the organization of turn-taking for conversation. Language, 50, 696 – 735.
Schober, M. F., & Bloom, J. E. (2004). Discourse cues that respondents have misunderstood survey questions. Discourse Processes, 38, 287 – 308.
Schober, M. F., Conrad, F. G., Dijkstra, W., & Ongena, Y. P. (2012). Disfluencies and gaze aversion in unreliable responses to survey questions. Journal of Official Statistics, 28, 555 – 582.
Smith, V. L., & Clark, H. H. (1993). On the course of answering questions. Journal of Memory and Language, 32, 25 – 38.
Stevens, C. K., & Kristof, A. L. (1995). Making the right impression: A field study of applicant impression management during job interviews. Journal of Applied Psychology, 80, 587 – 606. West, S. G., Aiken, L. S., & Krull, J. L. (1996). Experimental personality designs: Analyzing
categorical by continuous variable interactions. Journal of personality, 64, 1 – 48.
Wittenburg, P., Brugman, H., Russel, A., Klassmann, A., & Sloetjes, H. (2006, May). ELAN: A professional framework for multimodality research. Presented at the Fifth International Conference on Language Resources and Evaluation, Genoa.