175
0022-2291/05/0400-0175/0 © 2005 Springer Science+Business Media, Inc.
Scaling of the Equilibrium Magnetization in the
Mixed State of Type-II Superconductors
I. L. Landau and H. R. OttLaboratorium f¨ur Festk¨orperphysik, ETH H¨onggerberg, CH-8093 Z¨urich, Switzerland
We discuss the analysis of mixed-state magnetization data of type-II super-conductors using a recently developed scaling procedure. It is based on the fact that, if the Ginzburg-Landau parameter κ does not depend on temperature, the magnetic susceptibility χ(H, T ) is a universal function of H/Hc2(T ), leading to a simple relation between magnetizations at different tempera-tures. Although this scaling procedure does not provide absolute values of the upper critical field Hc2(T ), its temperature variation can be established rather accurately. This provides an opportunity to validate theoretical mod-els that are usually employed for the evaluation of Hc2(T ) from equilibrium magnetization data. In the second part of the paper we apply this scaling procedure for a discussion of the notorious first order phase transition in the mixed state of high-Tc superconductors. Our analysis, based on experi-mental magnetization data available in the literature, shows that the shift of the magnetization accross the transition may adopt either sign, depending on the particular chosen sample. We argue that this observation is inconsis-tent with the interpretation that this transition always represents the melting transition of the vortex lattice.
PACS numbers: 74.60.-w, 74.60.Ec, 74.60.Ge, 74.72.-h
1. INTRODUCTION
Measurements of the equilibrium magnetization in the mixed state of a type-II superconductor provide valuable information about different param-eters characterizing the superconducting state of the investigated material. This is particularly true for high-Tc (HTSC) superconductors, because of
the extremely wide range of magnetic fields in which their magnetization is reversible.1 The physically meaningful information is not straightforwardly
accessible, however, and theoretical models have to be invoked in analyses of experimental data. In this short review we discuss a recently developed scaling procedure and its application to the analysis of equilibrium magne-tization measurements in the mixed state of type-II superconductors.2, 5, 6
The comparison of our results with those obtained earlier by using alter-native methods of analyzing the data shows that some of the assumptions that are made in traditional theoretical approaches are not justified. For in-stance, we show that the impact of thermal fluctuations on the equilibrium magnetization is much weaker than previously claimed. We also apply the scaling approach in analyzing the well known first order phase transition in the mixed state of HTSC’s which is usually attributed to the melting of the vortex lattice.7–14
In order to illustrate the problems that arise in the interpretation of the experimental data, we first consider several commonly used approaches for establishing the upper critical field and its temperature dependence Hc2(T )
from magnetization M (T ) data.
1.1. Intuitive approach
As an example we pick a study of an optimally doped YBa2Cu3O7−x
(Y-123) sample that was published in Ref. 15. First, we consider the magne-tization measurements in very low magnetic fields (Fig. 1(a)). The shape of this low-field M (T ) curve is exactly as expected for a type-II superconductor with non-zero pinning. In this case, the width of the observed transition is not connected with the sample non-uniformity but rather reflects a decrease of the critical current density by approaching Tc. The zero-field critical
tem-perature Tccan be reliably evaluated as that value of temperature, at which
the diamagnetic moment of the sample vanishes.
In higher magnetic fields (Fig. 1(b)), however, the situation is more complicated and the corresponding value of the critical temperature in a given external field, Tc2(H), cannot be evaluated in the same simple manner
as the zero-field Tc. In order to evaluate Hc2(T ), some a priory assumptions
have to be made. In Ref. 15, it was postulated that some rounding of the
M (T ) curve above T ≈ 88 K is due to thermal fluctuations. According to
arguments presented in Ref. 15, 16 the corresponding value of Hc2(T ) may
be evaluated as the intersection point of the extrapolation of the linear part of the M (T ) curve with the abscissa axis (see Fig. 1(b)). As expected, Hc2
evaluated in such a way varies linearly with temperature (see the inset of Fig. 1(b)). At the same time, the value of T , at which Hc2(T ) vanishes,
Fig. 1. Magnetization curves for Y-123 and Bi-2212 samples studied in Ref. 15 and 21, respectively. (a) A zero-field-cooled (ZFC) M (T ) curve. The solid line is a guide to the eye. (b) and (c) Reversible magnetization data for two different samples. The solid lines represent linear approximations to the low temperature part of the curves. The insets show the resulting behavior of Hc2(T ). Note the difference in Tc mentioned in the text in the inset of
panel (b).
this situation casts some doubts on the validity of the assumptions that were made, the same approach was frequently used for evaluations of Hc2(T ) of
Y-based cuprates.17–20
The discrepancies are even worse if we apply the same approach to Bi-based HTSC’s. The corresponding plots for a Bi2Sr2CaCu2O8(Bi-2212)
sample, studied in Ref. 21, are shown in Fig. 1(c). Although the shape of the M (T ) curve for this sample is practically identical to that shown in Fig. 1(b), the resulting temperature dependence of Hc2(T ), shown in the inset of
Fig. 1(c), demonstrates rather clearly the failure of the approach. In Ref. 21, this failure was claimed to be due to an especially important role of thermal fluctuations in layered cuprates. Although this explanation is plausible, it should be considered as an assumption rather than a firm conclusion and, of course, this assumption does not help to establish Hc2(T ).
1.2. Hao-Clem model and thermal fluctuations of vortices Another widely used approach to extract Hc2(T ) from experimental
magnetization data is by employing the model of Hao and Clem.22 This
model is an analytical approximation to the Ginzburg-Landau theory of the Abrikosov vortex lattice. It allows to find the values of the Ginzburg-Landau parameter κ and the thermodynamic critical magnetic field Hc for a given
measurements. An important advantage of this approach is that equilibrium magnetization data collected in magnetic fields well below Hc2may be used
and therefore the accessible Hc2(T ) curve is not limited to temperatures very
close to Tc.
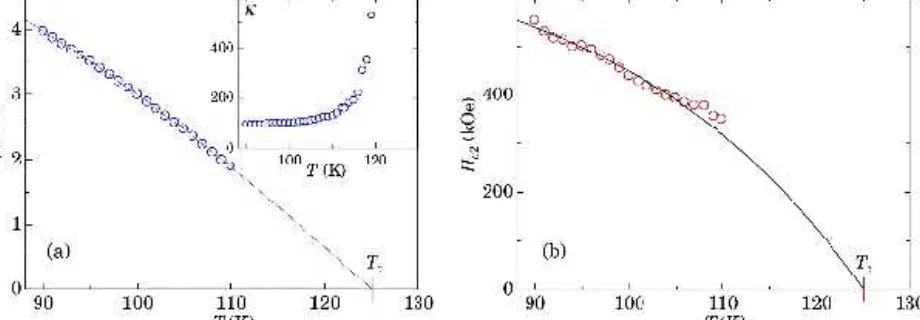
Fig. 2. (a) Hc(T ) and κ(T ) (inset) for a Hg-based sample studied in Ref. 23.
(b) The Hc2(T ) curve calculated as Hc2= √
2κHc. The solid lines are guides
to the eye.
As a first example, we consider the results for a Hg-based sample pub-lished in Ref. 23 (Fig. 2). While the shape of the Hc(T ) curve appears as
reasonable, the temperature dependence of κ reveals a strong and unphys-ical increase of κ with increasing temperature. This type of κ(T ) behavior resulted in practically all published analyses, in which the Hao-Clem model was applied to experimental magnetization data.24–36 The standard
expla-nation is that because of thermal fluctuations of vortices, which are not accounted for by the model, this approach is inapplicable at higher temper-atures. Considering the data presented in Fig. 2(b), we may conclude that for this particular sample the Hao-Clem analysis is valid only at tempera-tures T ≤ 105 K = 0.84Tc. In some other cases, however, the same type
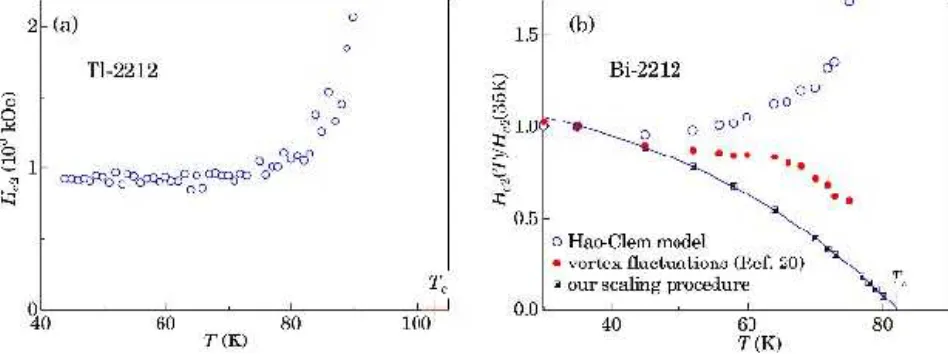
of analysis leads to manifestly wrong results even at lower temperatures. Two such examples are shown in Fig. 3. Contrary to common expectations,
Hc2(T ) does not decrease with increasing temperature.
In order to explain these failures of the model, two different theories were developed.37, 38 In Ref. 37, it was assumed that at low temperatures T ¿ T
c,
the discrepancies are due to effects of non-locality. The steep increase of Hc2
at higher temperatures was ascribed to extremely strong fluctuation effects in these HTSC compounds.38 Indeed, if magnetization data are treated by
taking into account fluctuation effects, the resulting Hc2(T ) curve adopt a
more reasonable shape (see Fig. 3(b)).
temper-Fig. 3. The Hc2(T ) curves resulting from Hao-Clem type analyses for
Tl2Ba2CaCu2O8+x (Tl-2212) and Bi-2212 samples, studied in Refs. 36 and
26, respectively. For the latter sample, calculations based on the theory de-veloped in Ref. 38 and our method, which is described below, are also shown. The solid line in frame (b) is a guide to the eye.
atures close to Tc. For instance, they account for the experimental
obser-vation that in layered HTSC compounds, the derivative dM/dH changes sign at one particular temperature in all magnetic fields.39 The rather ad
hoc assumption of their importance, simply to correct for the inadequacies of the above mentioned model, is less convincing, and it may well be that the failure of the model is due to completely different reasons. Several such possibilities are listed below.
The model’s three main assumptions include
(i) Conventional s-wave pairing. It is, however, commonly accepted that d-wave pairing is responsible for superconductivity in cuprates. The free energy includes a term describing the spatial distribution of the super-conducting order parameter and therefore the equilibrium configuration of the mixed state, which is determined by a minimum of the free energy, is sensitive to the pairing type.
(ii) The sample geometry. The model assumes an infinite extension of the sample in the direction of the applied magnetic field. Because real HTSC samples are often rather thin, the free energy corrections due to a non-uniform magnetic field distribution outside the sample should also be taken into account.
(iii) The normal state background. It is assumed that the normal-state magnetic susceptibility χ(n) is negligible. This is not the case in HTSC’s.
Because χ(n) is temperature dependent, it is difficult to identify the
corre-sponding contribution from experimentally measured magnetizations. Summarizing, we note that none of the main assumptions of the
Hao-Clem model is actually satisfied in real experiments. Any disagreement between a theoretical M (H) curve and corresponding experimental data is thus not surprising at all. Below we consider a simple scaling procedure which allows for the evaluation of the temperature dependence of a normal-ized upper critical field from magnetization measurements. This procedure is based on the single assumption that the Ginzburg-Landau parameter κ is temperature independent. The resulting temperature dependencies of Hc2
turn out to be quite different from those quoted above.
2. THE SCALING PROCEDURE
If the Ginzburg-Landau parameter κ is temperature independent,40the
magnetic susceptibility χ in the mixed state of a type-II superconductor may be written as
χ(H, T ) = χ(H/Hc2), (1)
According to Eq. (1), the temperature dependence of χ is solely determined by the temperature variation of the upper critical field. Eq. (1) is suffi-cient to establish a relation between the magnetizations M at two different temperatures T and T0, which may be written as
M (H/hc2, T0) = M (H, T )/hc2 (2)
where hc2(T ) = Hc2(T )/Hc2(T0) is the ratio of the upper critical fields at T
and T0. This equation is valid if the diamagnetic response of the mixed state
is the only significant contribution to the sample magnetization. It is well known, however, that many superconducting materials, including HTSC’s, exhibit sizable paramagnetic susceptibilities in the normal state. In order to account for this additional contribution to the sample magnetization, the following modification of Eq. (2) needs to be made2
M (H/hc2, T0) = M (H, T )/hc2+ c0(T )H, (3)
with
c0(T ) = χ(n)ef f(T ) − χ(n)ef f(T0), (4)
where χ(n)ef f(T ) is the effective magnetic susceptibility of the superconduc-tor in the normal state. In practice and depending on the measurement technique, χ(n)ef f may also include a non-negligible contribution arising from the sample holder. In the following we use Mef f(H) = M (H, T0) to
de-note the field dependence of the magnetization at T = T0, calculated from
and c0(T ) are obtained by sticking to the condition that the Mef f curves,
calculated from measured M (H) data in the reversible regime at different temperatures, collapse onto a single Mef f(H) curve, which represents the
equilibrium magnetization at T = T0 (see Ref. 2 for details).
There are two adjustable parameters in our scaling procedure. The up-per critical field Hc2represents the natural normalization parameter for all
magnetic characteristics of the mixed state and, as stated above, c0(T ) is
essential to account for any temperature dependence of the magnetic sus-ceptibility in the normal state.
The condition expressed by Eq. (1) is also satisfied in the above men-tioned model of Hao and Clem.22 An important advantage of our scaling
approach, however, is that no particular field dependence of the magneti-zation has to be assumed and therefore, this procedure is free from those limitations that we outlined at the end of the previous section. The scal-ing procedure can be used for any type-II superconductor, independent of the pairing type, the absolute value of κ, the anisotropy of superconduct-ing parameters or the sample geometry. In addition, it is equally valid for different mixed state configurations such as a vortex lattice, a vortex liq-uid, a vortex glass, or even a configuration of superconducting filaments in a normal matrix, considered in Ref. 43. It is only important that the mag-netization curves that are used in the analysis are reversible, i.e., represent the equilibrium magnetization.
3. SCALING ANALYSIS OF MAGNETIZATION DATA.
TEMPERATURE DEPENDENCE OF Hc2
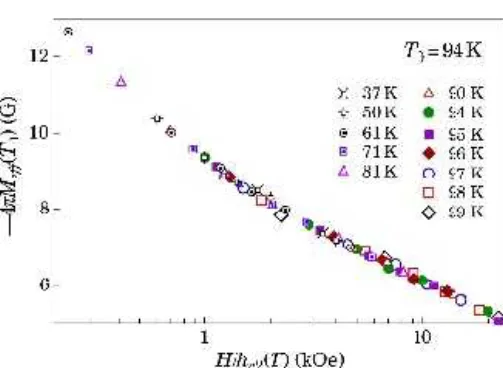
As a first example, we consider the magnetization data for a Tl-2212 sample presented in Ref. 36. The dependence of Mef f on H/hc2(T ) that
results from our scaling procedure is shown in Fig. 4. Because of the high quality of the original experimental data and the extended covered range of magnetic fields, the Mef f(H/hc2) data points, calculated from the
measure-ments at different temperatures, combine to a single curve with virtually no scatter.
The temperature dependence of the scaling parameter c0, which is shown
in Fig. 5(a), demonstrates that the paramagnetic contribution to the sam-ple magnetization obeys a Curie-type law in a rather extended temperature range with some deviations at temperatures below 55 K, as well as at tem-peratures very close to Tc.
The normalized upper critical field hc2(T ) is shown in Fig. 5(b). As may
Fig. 4. The scaled magnetization Mef f calculated for the Tl-2212 sample
studied in Ref. 36.
linearity allows for a quite accurate evaluation of the critical temperature
Tc by extrapolating the hc2(T ) curve to hc2 = 0. The inset of Fig. 5(b)
demonstrates that the value of Tc = 103.0 K is well in agreement with the
temperature dependence of the low-field magnetization of the same sample. We note that the resulting temperature dependence of Hc2 is significantly
different from the results of previous analy?ses of the same data, shown in Fig. 3(a).
The results of an analogous analysis of data for a Bi-2212 sample, re-ported in Ref. 26, are shown in Fig. 3(b). As may be seen, our hc2(T ) curve is
again rather different from those obtained by other approaches. The temper-ature dependence of Hc2, as it follows from our analysis, is well in agreement
with expectations: it is linear close to Tc, with a trend to saturation at lower
temperatures.
Because the influence of thermal fluctuations on the magnetization of HTSC’s in the mixed state is often overestimated in the literature, we discuss this point in more detail. As may clearly be seen in Fig. 4, if the experimental magnetizations are corrected for the temperature dependence of χ(n)ef f, the
Mef f(H) data points, calculated from data that were obtained at different
temperatures, merge onto exactly the same curve. The obvious conclusion is that fluctuation effects do not contribute to the sample magnetization in this rather wide temperatures range. However, a close inspection of Fig. 5(a) reveals that the c0(T ) data points for the three highest temperatures
(T ≥ 97 K) deviate from the straight line which represents the Curie law. It is plausible that these deviations are indeed due to thermal fluctuations. As was pointed out in Ref. 3, at temperatures close to Tc, the term (c0(T )H)
may also account for fluctuation effects. However, because the fluctuation-induced contribution to the sample magnetization is not linear in H, it may
Fig. 5. (a) The scaling parameter c0 as a function of 1/T . The solid line
represents the Curie-Weiss type behavior of χ(n)(T ). (b) The temperature
dependence of the normalized upper critical field. The solid line is the best linear fit to the data points for T ≥ 80 K. The inset shows the M (T ) data measured at H = 10 Oe.36 The short vertical line indicates the position of
Tc as evaluated by the linear extrapolation of hc2(T ) to hc2= 0.
only approximately be accounted for. At still higher temperatures T ≥ 100 K ≈ 0.97Tc, the magnetization data presented in Ref. 36 cannot satisfactorily
be scaled using Eq. (3). We consider these observations as evidence for the increasing role of fluctuations with increasing temperature, but only close to
Tc. For Y-123 compounds, the impact of fluctuations effects is even weaker
and in some cases our scaling procedure could successfully be employed up to temperatures as high as 0.99Tc.2
Fig. 6. Hc2(T )/Hc2(0.95Tc) versus T /Tc for two groups of HTSC’s (see text
for details). In both frames, the solid line represents the same data set. In order to compare the results obtained for different samples of HTSC’s, we plot Hc2(T )/Hc2(0.95Tc) versus T /Tc in Fig. 6. It turns out that all the
numerous HTSC’s may be divided into two groups with two distinctly dif-ferent normalized Hc2(T ) curves. The corresponding results are shown in
Fig. 6. As may be seen in Fig. 6, the Bi-2212 and Tl–2212 samples that we discussed above belong to different groups. Note that the first group (Fig. 6(a)) includes a great variety of different HTSC compounds, while the sec-ond one (Fig. 6(b)) is apparently limited to a few Y- and Tl-based materials (see Refs. 3 and 5 for details). The universality of the Hc2(T ) curves for
dif-ferent HTSC’s is undoubtedly the most surprising result of our analysis so far. It is difficult to imagine that this universality is simply accidental. The spectacular coincidence of the hc2(T /Tc) data for a great variety of
differ-ent samples is rather an unambiguous evidence that our approach captures the essential features of the magnetization process of HTSC’s. It does not necessarily mean, however, that the Ginzburg-Landau parameter κ is indeed temperature independent. The universality of hc2(T /Tc) is preserved if the
temperature dependence of κ is the same for different HTSC compounds. Because the temperature dependence of κ is weak,42it does not change the
hc2(T ) curves significantly.41
4. SCALING ANALYSIS OF PHASE TRANSITIONS IN
HTSC’S
In this section, we consider the scaled magnetization curves Mef f(H)
in the vicinity of the well-known first order phase transition in the mixed state of HTSC’s. The analysis of such curves provides some new insight in the very complex physics of the phase transition. In existing literature this phase transition is almost always attributed to vortex-lattice melting. However, some of the results of our following analysis are in contradiction with the vortex-lattice-melting hypothesis. Hence, in order to distinguish the two phases above and below the transition, respectively, we introduce the notion of ”high-field” and ”low-field phase”, instead of the commonly used notations of vortex liquid and vortex solid. We divide this section into two parts. In the first subsection, we present and discuss the analysis of the isothermal M (H) curves, while in the second we demonstrate that the scaling procedure may also be used for the scaling of M (T ) curves measured in fixed magnetic fields.
4.1. Analysis of M (H) curves
First, we consider the experimental data for two similar La1.908Sr0.092
49. The scaling results for these samples are shown in Fig. 7(a). In these two experiments, the magnetization is reversible down to magnetic fields well below the phase transition. The collapse of the data points measured at different temperatures is achieved with the same values of hc2(T ) and c0(T ) both below and above the transition, in complete agreement with the
expectation outlined above. The results displayed in Fig. 7(a) may be in-terpreted as evidence for the existence of two different modifications of the mixed state with two different equilibrium Mef f(H, T0) curves above and
below the transition. In the following we use Meq(l) and Meq(h) to distinguish
between the equilibrium Mef f(H) curves for the low- and the high-field
mod-ifications of the mixed state, respectively. As may be seen in Fig. 7(a), the low-field modification corresponds to slightly higher values of the diamag-netic moment. The difference ∆M =¯¯¯Meq(l)
¯ ¯ ¯−¯¯¯Meq(h) ¯ ¯ ¯ is positive.
Fig. 7. (a) Mef f(H/hc2) in the vicinity of the transition for two La-214
samples studied in Refs. 48 and 49. For the sample of Ref. 49, only reversible magnetization data are shown. The analogous diagram for a Bi-2212 sample studied in Ref. 50 is displayed in (b).
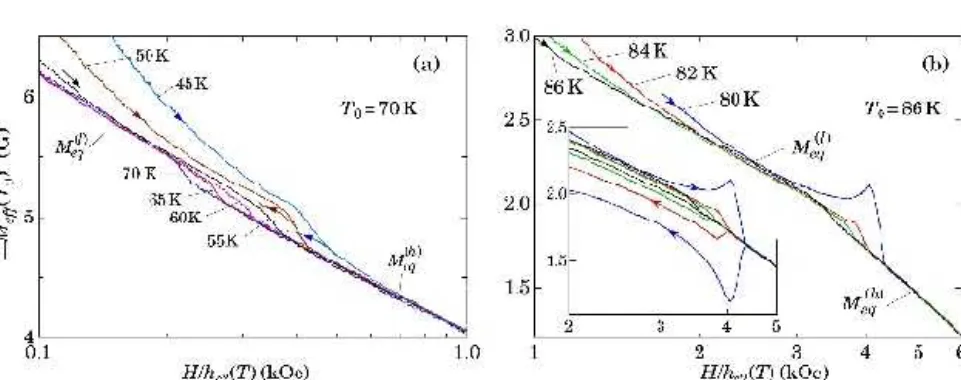
The results for the Bi-2212 sample investigated in Ref. 50 are shown in Fig. 7(b). The M (H) curves measured at T = 75 K and T = 70 K are reversible in the entire covered field range.50 As for the La-214 samples, the
Mef f(H, T0) curves collapse, both above and below the transition, clearly
indicating Meq(l)(H) and Meq(h)(H). The unexpected difference to the results
shown in Fig. 7(a) is that the branches of the magnetization curves measured in increasing fields follow the equilibrium magnetization Meq(l) curve already
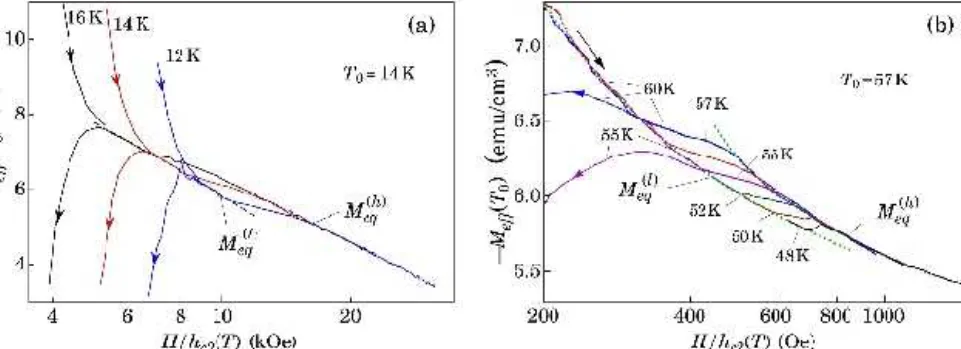
at magnetic fields well below the irreversibility line. This behavior seems to be common for Bi-based HTSC’s and another example is shown in Fig. 8(a).4
Fig. 8. The scaled magnetization in the transition region for (a) a Bi-2212 sample investigated in Ref. 55, and (b) an Y-123 sample investigated in Ref. 51. The inset in frame (b) shows both branches of M (H) for the same temperatures as in the mainframe.
in the vicinity of the phase transition is similar to that for Bi-based samples. In spite of a pronounced peak effect at the lowest temperature, the Meq(l)and Meq(h) curves are readily identified.
The results presented in Figs. 7(b) and 8 demonstrate that in Bi-2212 and Y-123 samples, the effect of pinning is strongly dependent on the di-rection of the flux motion. The pinning effects are obviously much weaker for the magnetic flux entering the sample. One of the possible explanations of this pinning force asymmetry was considered in Ref. 4. Note that this asymmetry is practically absent in the data for the La-214 samples, shown in Fig. 7(a).
The Mef f(H) curves in the transition region for another La-214 sample,
which are displayed in Fig. 9(a), are quite different from those shown in Figs. 7 and 8. The easily distinguishable Meq(l)(H) and Meq(h)(H) curves indicate
that the difference ∆M =
¯ ¯ ¯Meq(l) ¯ ¯ ¯− ¯ ¯ ¯Meq(h) ¯ ¯
¯ is negative. The reason for the sign difference of ∆M between the data shown in Fig. 7(a) and those in Fig. 9(a) is difficult to establish. According to the original work,48, 49, 52 the three
La-214 samples are practically identical.
Finally, in Fig. 9(b), we show the result of the scaling procedure for an overdoped Bi-2212 sample studied in Ref. 52. Although only M (H) data in magnetic fields above the transition were used for the evaluation of hc2(T )
and c0(T ), the magnetization curves measured in increasing magnetic fields
collapse onto a single Mef f(H) curve also below the irreversibility line and
thus, as argued above, represent the equilibrium magnetization for T = T0
in this field range.4 The equilibrium M (H) curves for the low and high
the transition region is again negative. The width of the transition from one modification of the mixed state to the other, which is quite large at higher temperatures, is considerably reduced with decreasing temperature.
Fig. 9. (a) Mef f(H) for a La-214 sample studied in Ref. 52. The dashed line
indicates Meq(l)(H). (b) Mef f(H) for an overdoped Bi-2212 sample.53 The
dotted lines indicate Meq(l)(H) and Meq(h)(H), respectively. Because of strong
fluctuations in part of the magnetization data, shown in Fig. 2(a) of Ref. 53, the corresponding branches of the Mef f(H/hc2) curves are not displayed in
this plot.
The most unexpected result of our analysis is that the magnetization difference ∆M across the transition may adopt either sign. This result is difficult to reconcile with the vortex-lattice-melting hypothesis. In case of vortex lattice melting, the external magnetic field acts as pressure does in traditional solid-liquid melting transitions. Thermodynamics requires that the phase corresponding to the higher pressure must have a higher density, independent of whether this high-pressure phase is a liquid or a solid. In relation with the mixed state of type-II superconductors, the vortex liquid necessarily has to adopt a higher vortex density, i.e., the difference ∆M must always be positive. Since negative values of ∆M are identified for materials belonging to two different families of HTSC’s, this can hardly be refuted as an accidental result.
In the bulk of the existing literature (see, for instance, Refs. 7–14), the first order transition in the mixed state of HTSC’s is viewed as a melting transition in the system of vortices. In this scenario, the mixed state above the transition represents the vortex liquid, while the vortex solid below the transition is described as a lattice or Bragg glass of vortices, depending on the particular experimental conditions. Numerous experimental observa-tions in the literature are in agreement with this interpretation. However,
if the vortex lattice melting is indeed always responsible for the first or-der transition, all experimental results must be consistent with this point of view. Apparently, this is not the case. We see no way in which the neg-ative values of ∆M , clearly demonstrated in Figs. 9(a) and 9(b), may be explained by invoking the vortex-lattice-melting hypothesis. At present, it is difficult identify the reason for the negative ∆M values. Several possibilities are discussed in Ref. 54.
4.2. Analysis of M (T ) curves
In this subsection, we consider an experimental study of a Bi-2212 sam-ple presented in Ref. 55. This study was chosen because both M (H) and
M (T ) curves were measured in rather extended ranges of magnetic fields and
temperatures. Our main goal here is to demonstrate that the scaling proce-dure can also be used for the analysis of magnetization curves measured in fixed magnetic fields.
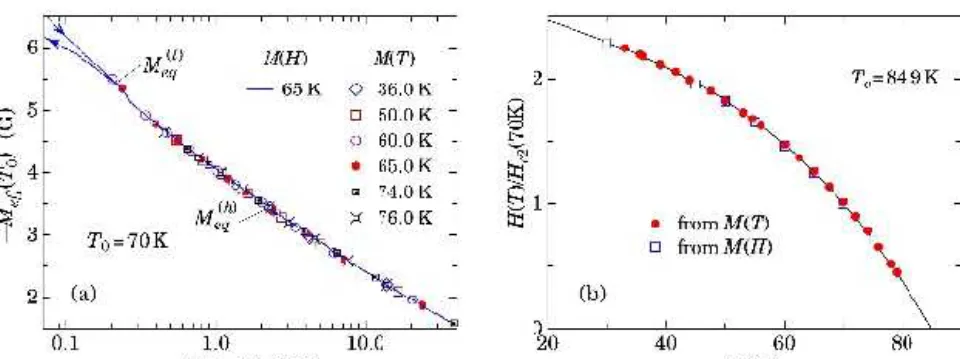
Fig. 10. (a) Comparison of Mef f(H/hc2) for a Bi-2212 sample investigated
in Ref. 55 as calculated from M (T ) data (symbols) and as calculated from
M (H) data (solid line). (b) The resulting hc2(T ) curve. The solid line
represents the “universal” hc2(T ) curve shown in Fig. 6(a), calculated for Tc= 84.9 K and T0= 70 K.
Because only M (H) curves can be used for the evaluation of the scaling parameters hc2(T ) and c0(T ), the first step of the analysis is to transform
the M (T ) curves into M (H) data at different temperatures. It can easily be done by taking the corresponding values directly from the M (T ) curves. The correspondingly scaled magnetization is presented in Fig. 10(a). Different data sets perfectly merge together, allowing for a reliable evaluation of hc2(T )
and c0(T ). As may be seen in Fig. 10(b), the values of hc2(T ) that emerge
from the scaling of either the M (T ) or the M (H) curves coincide.
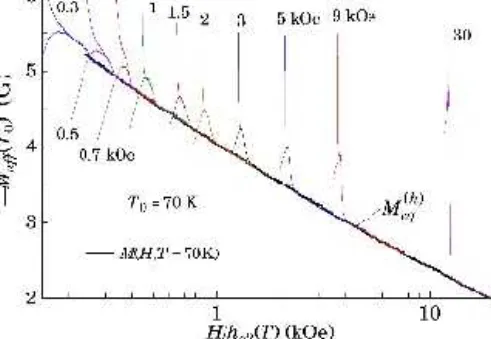
Fig. 11. (a) The M (T ) data, as reported in Ref. 55 for Bi-2212, scaled as described in the text. The M (H) curve measured at T = 70 K is shown for comparison as a thicker solid line.
Although the algorithm described above allows for establishing the tem-perature dependence of the normalized upper critical field hc2(T ), the small
number of data points along the resulting M (H) curves makes them ineffec-tive for the analyses of the phase transition itself. In order to make use of all the data, the following procedure may be applied. After hc2(T ) and c0(T )
are established, the transformation defined by Eq. (3) can be applied to each point of each of the original M (T ) curves. The results are plotted in Fig. 11 as Mef f(T0) versus H/hc2(T ). Note that the temperature variation of M enters via hc2. For temperatures T < 35 K, extrapolations of the hc2(T )
and c0(T ) curves were used. The measured isothermal M (H, 70K) curve is
shown for comparison. As may be seen, above the transition the Mef f(H, T0)
curve, calculated from the M (T ) data collected in different applied fields, coincides with experimentally collected isothermal magnetization at T = T0,
i.e., it does not really matter whether the change of H/hc2(T ) is achieved
by varying the applied magnetic field or by a corresponding change of tem-perature.
Because the magnetization curves above the transition are reversible, the equilibrium magnetization curve for the high-field phase Meq(h) may
reli-ably be established in a rather extended range of H/hc2. In order to compare
the transitions observed at different magnetic fields, we plot the difference
Mef f− Meq(h) in Fig. 12(a). In view of these plots, we argue that substantial
changes of M in rather narrow ranges of H/hc2(T ) provide convincing
fields. The temperature dependence of the mid-point of the transition H∗is
shown in Fig. 12(b). It turns out that H∗(T ) may very well be approximated
by a power law for T ≥ 45 K. At lower temperatures, H∗increases
exponen-tially with decreasing temperature. Both these features are emphasized by the broken and the solid line, respectively.
Fig. 12. (a) The difference Mef f − Meq(h) as a function of H/hc2. (b) The
middle-point of the transition as a function of temperature. The solid and the broken line are commented in the text; A and B are fit parameters.
The experimental results that we discuss here are available in the lit-erature for already some time and several scenarios for their interpretation have been proposed.55–58 There is a consensus that in the high
temper-ature (low field) range, the step-like fetemper-ature in the magnetization curves reflects the vortex-lattice-melting transition. The situation at low temper-atures and high fields is still controversial. Nevertheless, it seems to be commonly accepted that the phase transition at low temperatures is not reflecting the melting of the vortex lattice. While our analysis of experimen-tal data presented above cannot serve to identify the exact nature of the phase transition, it may be used to verify the validity of different models. Below we consider different explanations of the magnetization step in the low-temperature regime that we could find in the literature and show that all these explanations are inconsistent with the existing experimental data.
1. In Ref. 55 it was proposed that with decreasing temperature the first order vortex-lattice-melting transition gradually changes into a second-order vortex glass transition. In a more recent study,56 a similar behavior
in the low temperature range was attributed to a second order transition between two different vortex liquids. Neither of two can be accepted. As may be seen in Fig. 12(a), there are equally sharp and large changes of the
reversible magnetizations in all applied magnetic fields, clearly a feature of a first rather than a second order phase transition.
2. In Ref. 57, it was assumed that the H∗(T ) curve at lower
tem-peratures represents the Hc2(T ) curve for inclusions with a lower critical
temperature in a chemically non-uniform sample. However, considering the exponential increase of H∗ with decreasing temperature at T < 45 K, this
explanation must inevitably be rejected.
3. Another type of spatial non-uniformity of the investigated sample was considered in Ref. 58. It was assumed that this non-uniformity is induced by the so-called intrinsic inhomogeneous electronic state in HTSC’s. In this scenario, two different phases of the mixed state above H∗(T ) and an
additional phase boundary separating them are expected. However, our scaling analysis presented above reveals only one single phase of the mixed state above H∗(T ) and therefore this explanation is also not tenable.
Summarizing this part of the discussion, we note that to the best of our knowledge, no acceptable explanation of the magnetization step in the mixed state of HTSC’s in high magnetic fields has yet been given. This situation is all the more disturbing, because this step is a rather prominent feature of the magnetization curves.
REFERENCES
1. K. A. M¨uller, M. Takashige, and J. G. Bednorz, Phys. Rev. Lett. 58, 1143 (1987).
2. I. L. Landau and H. R. Ott, Phys. Rev. B 66, 144506 (2002). 3. I. L. Landau and H. R. Ott, Physica C 385, 544 (2003). 4. I. L. Landau and H. R. Ott, Phys. Rev. B 67, 92505 (2003). 5. I. L. Landau and H. R. Ott, Physica C 411, 83 (2004).
6. I. L. Landau and H. R. Ott, submitted to Phys. Rev. B, (cond-mat/0405286). 7. H. Safar, P. L. Gammel, D. A. Huse, D. J. Bishop, J. P. Rice, D. M. Ginzberg,
Phys. Rev. Lett. 69, 824 (1992).
8. W. K. Kwok, S. Fleshler, U. Welp, V. M. Vinokur, J. Downey, G. W. Crabtree, M. M. Miller, Phys. Rev. Lett. 69, 3370 (1992).
9. H. Pastoriza, M. F. Goffman, A. Arrib´ere, F. de la Cruz, Phys. Rev. Lett. 72, 2951 (1994).
10. R. Liang, D. A. Bonn, W. N. Hardy, Phys. Rev. Lett. 76, 835 (1996).
11. U. Welp, J. A. Fendrich, W. K. Kwok, G. W. Crabtree, B. W. Veal, Phys. Rev. Lett. 76, 4809 (1996).
12. D. R. Nelson, Phys. Rev. Lett. 60, 1973 (1988).
13. D. R. Nelson and H. S. Seung, Phys. Rev. B 39, 9153 (1989).
14. G. Blatter, M. V. Feigel`man, V. B. Geshkenbein, A. I. Larkin, Rev. Mod. Phys. 66, 1125 (1994).
15. U. Welp, W. K. Kwok, G. W. Crabtree, K. G. Vandervoort, J. Z. Liu, Phys. Rev. Lett. 62, 1908 (1989).
16. We note that these arguments are not completely justified. A short discussion of this matter may be found in Ref. 2
17. U. Welp, W. K. Kwok, G. W. Crabtree, K. G. Vandervoort, J. Z. Liu, Phys. Rev. B 40, 5263 (1989).
18. U. Welp, M. Grimsditch, H. You, W. K. Kwok, M. M. Fang, G. W. Crabtree, J. Z. Liu, Physica C 161, 1 (1989).
19. U. Welp, M. Grimsditch, H. You, W. K. Kwok, M. M. Fang, G. W. Crabtree, J. Z. Liu, Physica C 163, 473 (1990).
20. K. G. Vandervoort, U. Welp, J. E. Kessler, H. Claus, G. W. Crabtree, W. K. Kwok, A. Umezawa, B. W. Veal, J. W. Downey, A. P. Paulikas, Phys. Rev. B 43, 13042 (1991).
21. W. Kritscha, F. M. Sauerzopf, H. W. Weber, G. W. Crabtree, Y. C. Chang, P Z. Jiang, Physica C 179, 59 (1991).
22. Z. Hao and J. R. Clem, Phys. R
ev. Lett, 67, 2371 (1991). Z. Hao and J. R. Clem, M. W. McElfresh, L.Civale, A. P. Malozemoff, and F. Holtzberg, Phys. Rev. B 43, 2844 (1991). 9. Y. Zhuo, J.-H. Choi, M.-S. Kim, W.-S. Kim, Z. S. Lim, S.-I. Lee, S. Lee, Phys. Rev. B 55, 12719 (1997).
23. Y. Zhuo, J.-H. Choi, M.-S. Kim, W.-S. Kim, Z. S. lim, S.-I. Lee, S. Lee Phys. Rev. B 55, 12719 (1997).
24. J. Gohng and D. K. Finnemore, Phys. Rev. B 46, 398 (1992).
25. Q. Li, M. Suenaga, J. Gohng, D. K. Finnemore, T. Hikata, K. Sato, Phys. Rev. B 46, 3195 (1992).
26. J. H. Cho, Z. Hao, D. C. Johnston, Phys. Rev. B 46, 8679 (1992). 27. D. N. Zheng, A. M. Campbell, R. S. Liu, Phys. Rev. B 48, 6519 (1993). 28. Q. Li, K. Shibutani, M. Suenaga, I. Shigaki, R. Ogawa, Physica B 194-196
1501 (1994).
29. Y. C. Kim, J. R. Thompson, J. G. Ossandon, D. K. Christen, M. Paranthaman, Phys. Rev. B 51, 11767 (1995).
30. M.-S. Kim, S.-I. Lee, S.-C. Yu, N. H. Hur, Phys. Rev. B 53, 9460 (1996). 31. J. R. Thompson, J. G. Ossandon, D. K. Christen, M. Paranthaman, E. D.
Specht, Y. C. Kim, Phys. Rev. B 54, 7505 (1996).
32. Y. Zhuo, J.-H. Choi, M.-S. Kim, J.-N. Park, M.-K. Bae, S.-I. Lee, Phys. Rev. B 56, 8381 (1997).
33. M.-S. Kim, S.-I. Lee, S.-C. Yu, I. Kuzemskaya, E. S. Itskevich, K. A. Lokshin, Phys. Rev. B 57, 6121 (1998).
34. M. Y. Cheon, G. C. Kim, G. C. Kim, Y. C. Kim, Physica C 302, 215 (1998). 35. Y. Zhuo, S.-M. Oh, J.-H. Choi, M.-S. Kim, S.-I. Lee, N. P. Kiryakov, M. S.
Kuznetsov, S. Lee, Phys. Rev. B 60, 13094 (1999).
36. H.-J. Kim, P. Chowdhury, I.-S. Jo, S.-I. Lee, Phys. Rev. B 66, 134508 (2002). 37. V. G. Kogan, M. Ledvij J. H. Cho, D. C. Jonston, M. Xu, J. R. Tompson, and
A. Martynovich, Phys. Rev. B 70, 1870 (1993).
38. V. G. Kogan, M. Ledvij, A. Yu. Simonov, J. H. Cho, D. C. Johnston Phys. Rev. Lett 70, 1870 (1993).
39. L. N. Bulaevskii, M. Ledvij and V. G. Kogan, Phys. Rev. Lett 68, 3773 (1992). 40. In framework of the Ginzburg-Landau theory κ is temperature independent.
The BCS theory predicts, however, a slight increase off κ with decreasing tem-perature.42 If the temperature dependence of κ is known a priori, the scaling procedure can be modified to take κ(T ) into account.41
41. I. L. Landau and H. R. Ott, Physica C 398, 73 (2003).
42. L. P. Gor’kov, Zh. Eksp. Teor. Fiz. 37, 833 (1959) [Soviet Phys.?JETP 10, 593 (1960)]. E. Helfand and N. R. Werthamer, Phys. Rev. 147, 288 (1966). 43. I. L. Landau and H. R. Ott, Journal of Phys.: Cond. Mat. 14, L313 (2002). 44. J.-Y. Genoud, T. Graf, A. Junod, D. Sanchez, G. Triscone, J. Muller, Physica
C 177, 315 (1991).
45. G. Triscone, A. F. Khode, C. Opagiste, J.-Y. Genoud, T. Graf, E. Janod, T. Tdukamoto, M. Couach, A. Junod, J. Muller, Physica C 224, 263 (1994). 46. A. Poddar, R. Prozorov,, Y. Wolfus, M. Ghinovker, B. Ya. Shapiro, A. Shaulov,
Y. Yeshurun, Physica C 282-287, 1299 (1997). 47. M. D¨aumling, Physica C 183, 293 (1991).
48. T. Sasagawa, Y. Togawa, J. Shimoyama, A. Kapitulnik, K.Kitazawa, K. Kishio, J. of Low Temp. Phys. 117, 1399 (1999).
49. T. Sasagawa, Y. Togawa, J. Shimoyama, A. Kapitulnik, K. Kitazawa, K. Kishio, Phys. Rev. B 61, 1610 (2000).
50. K. Kimura, R. Koshida, W. K. Kwok, G. W. Crabtree, S. Okayasu, M. Sataka, Y. Kazumata, and K. Kadowaki, J. of Low Temp. Phys. 117, 1471 (1999). 51. N. Kobayashi, T. Nishizaki, K. Shibata, T. Sato, M. Maki, T. Sasaki, Physica
C 362, 121 (2001).
52. T. Sasagawa, K. Kishio, Y. Togawa, J. Shimoyama, K. Kitazawa, Phys. Rev. Lett 80, 4297 (1998).
53. T. Hanaguri, T. Tsuboi, A. Maeda, T. Nishizaki, N. Kobayashi, Y. Kotaka, Jun-ichi Shimo-yama, K. Kishio, Physica C 256, 111 (1996).
54. I. L. Landau and H. R. Ott, submitted to Phys. Rev. B (cond-mat/0404340). 55. K. Kimura, S. Kamisawa, K. Kadowaki, Physica C 357-360, 442 (2001). 56. S. J. Feng, H. D. Zhou, G. Li, X. F. Sun, and X.-G. Li, Supercond. Sci. Technol.
15, 1068 (2002).
57. M. R. Koblichka and M. Murakami, phys. stat. sol. (b) 218, R3 (2000). 58. H. H. Wen, W. L. Yang, Z. X. Zhao, and Y. M. Ni, Phys. Rev. Lett. 82, 410

