ORIGINAL PAPER
Development of a fully automated toxicological LC-MS
n
screening system in urine using online extraction
with turbulent flow chromatography
Daniel M. Mueller&Bénédicte Duretz&
Francois A. Espourteille&Katharina M. Rentsch
Received: 30 September 2010 / Revised: 24 November 2010 / Accepted: 1 December 2010 / Published online: 21 December 2010 # Springer-Verlag 2010
Abstract In clinical toxicology, fast and specific methods are necessary for the screening of different classes of drugs. Therefore, an online extraction high-performance liquid chromatography coupled to mass spectrometry (LC-MSn) screening method using a MS2and MS3spectral library for the identification of xenobiotic substances has been developed and validated. Samples were run twice, once native and once after enzymatic hydrolysis. Internal standards and buffer were added to the urine samples. Following centrifugation, the supernatant was injected into the system. Extraction was performed by online turbulent flow chromatography. The chromatographic separation was achieved using a Phenyl/Hexyl column. For detection, a linear ion trap, equipped with an APCI interface, was used and the different compounds were identified using a MS2 and MS3spectral library containing 356 compounds. The turnaround time to report the results of the screening including hydrolysis was approximately 2 h. About 92% of
the 356 substances could be identified with a limit of identification below 100 ng/ml. The recovery and matrix effect experiments showed suitable results, and in six drug-free urine samples of healthy volunteers analyzed for selectivity, no substances have been identified. Carryover could be well controlled, and the method had a good reproducibility. The comparison of the results of 103 real patient urine samples showed a good agreement between the existing GC-MS and LC-MS methods with offline extraction and the new online extraction LC-MSnscreening method. The presented method allows a fast and sensitive analysis of a broad range of compounds.
Keywords LC-MS . Turbulent flow chromatography . Online extraction . Toxicological screening . Clinical toxicology
Introduction
The most often used techniques for toxicological screening purposes are immunological screening systems and gas chromatography-mass spectrometry (GC-MS) methods [1]. Immunological screening systems are fast, but often show cross-reactivities with other substances, e.g., metabolites or other drugs which can lead to false-positive results [2]. Moreover, immunological screening methods are only available for a limited number of compounds.
GC-MS nowadays is used as gold standard in the clinical-toxicological laboratory. Several large libraries including 100,000s of substances are commercially avail-able [3] which makes this approach very powerful for the identification of unknown substances. However, not all substances potentially involved in intoxications can be analyzed using GC-MS. For example, the analysis of
Published in the special issue Forensic Toxicology with Guest Editors Frank T. Peters, Hans H. Maurer, and Frank Musshoff.
Electronic supplementary material The online version of this article (doi:10.1007/s00216-010-4560-4) contains supplementary material, which is available to authorized users.
D. M. Mueller
:
K. M. Rentsch (*)Institute for Clinical Chemistry, University Hospital Zurich, Raemistrasse 100,
8091 Zurich, Switzerland e-mail: [email protected]
B. Duretz
Thermo Fisher Scientific, 91963 Les Ulis Cédex, France
F. A. Espourteille Thermo Fisher Scientifc, Franklin, MA 02038, USA DOI 10.1007/s00216-010-4560-4
thermolabile substances and compounds with a high molecular weight is impossible using this technique. Moreover, GC-MS needs extensive, mostly manual sample preparation that slows down the process and can be an origin of errors.
In the field of liquid chromatography screening, diode array detectors (DAD) were the most popular detectors used for a long time. Like in GC-MS, a standardization of the ultraviolet/visible (UV/VIS) spectra was possible [4] leading to the development of large commercially available libraries. The major drawbacks of this method are in some cases the bad specificity of the generated UV/VIS spectra and the poor UV/VIS activity of some compounds [4]. High-performance liquid chromatography (HPLC)/DAD systems can also be used in combination with online extraction [5]. One important approach to mention here is the REMEDi system [6] that was commercially available and widely used in clinical and forensic toxicological laboratories but which is no longer available.
Several screening methods have been developed using HPLC coupled to mass spectrometry (LC-MS). MS/MS or MSn spectra can be used for the identification of sub-stances, either generated on single-stage quadrupole instru-ments (via in-source collision) [7, 8], ion trap instruments [9–11] or hybrid instruments [12–14]. A comparison of three different commercially available screening systems using either a single-stage quadrupole, an ion trap or a triple quadrupole–ion trap hybrid instrument with GC-MS and the REMEDi system has been published recently [15].
Some larger LC-MS spectral libraries have already been published [16]. The main issue with MS/MS or LC-MSn spectra is the poor reproducibility of the spectra obtained from different types of mass spectrometers [17], even though some progress has been made recently in this area [18–20].
In targeted screening approaches using a triple quadru-pole instrument, the monitoring of different multiple reaction monitoring (MRM) transitions can be used to detect substances [21].
As alternative to full-scan spectra, it is now possible to identify compounds using their exact masses. Several methods using offline extraction and a time-of-flight mass spectrometer [22,23] or a quadrupole–time-of-flight hybrid instrument [24] have been published recently.
Online extraction using turbulent flow chromatography has been used for the analysis of different substances and for various matrices, e.g., immunosuppressants in whole blood [25] or antidepressants in serum [26]. This extraction method works with large, porous stationary particles, where small molecules can diffuse into, whereas matrix constitu-ents, e.g., proteins, are washed to the waste with the dwell volume of the column. To our knowledge, this method has not been used so far for the extraction of several hundreds
of substances as it is required in case of a toxicological screening approach.
In this paper, we present a fast and sensitive screening method using turbulent flow chromatography for sample preparation, thereby omitting extensive manual sample preparation steps.
Materials and methods Chemicals and reagents
HPLC grade ammonium acetate and ammonium carbonate were purchased from Scharlau (Taegerig, Switzerland), and analytical grade formic acid and ammonia were from Merck (Darmstadt, Germany). HPLC gradient grade methanol and 2-propanol was purchased from Seelze GmbH (Seelze, Germany), acetonitrile from Romil (Cambridge, Great Britain), acetone from Merck (Darmstadt, Germany), and dimethylsulfoxide from Fluka (Buchs, Switzerland). Puri-fied water was obtained using a central water purification installation (Burkhalter AG, Worblaufen, Switzerland). The 356 reference compounds which have been used to build the MS2and MS3library have been obtained as reference compounds by commercial suppliers (e.g., Cerillant (Round Rock, TX, USA), Lipomed (Arlesheim, Switzerland)) or by the manufacturers of the marketed drug.
LC-MS analysis Equipment
The HPLC system consisted of a Transcend TLX-1 HTLC system, equipped with two Allegro pumps, an HTC PAL autosampler, and a valve interface module with built-in switching valves, all controlled by the Aria software (version 1.6.2). The MS analysis was performed using a LXQ linear ion trap mass spectrometer, controlled by the Xcalibur 2.0.7 SP1 software (all from Thermo Fisher Scientific, Basel, Switzerland). Due to its better perfor-mance in terms of matrix effects compared with electro-spray ionization [27], an atmospheric pressure chemical ionization (APCI) interface was used.
Spectral library and identification of compounds
Reference spectra have been acquired in-house by direct infusion of a solution containing the reference compounds at a concentration of 10,000 ng/ml into the MS. ToxID 2.1.1 (Thermo Fisher Scientific, Basel, Switzerland) was used for the automated processing of chromatograms and the creation of the report. The library algorithm of ToxID compared all spectra acquired during the chromatographic
run with the ones from the library and reported the hits, where the search fit and reverse search fit as well as the retention time were within the range specified in the processing method. The minimal search fit was set to 600; the minimal reverse search fit was set to 700. The tolerance for the retention time was set to 1.5 min. Retention time shifts above 1.5 min would have to be considered manually and would not be corrected automatically by ToxID using the retention time of the internal standards. Compounds were identified using both MS2and MS3reference spectra from the spectral library as well as retention times, which have been determined by injecting spiked urine samples into the system.
Sample pre-treatment
Samples were run both natively and hydrolyzed. For the native aliquot, 100μl of sample were diluted with 50 μl of
ammonium acetate buffer 50 mM (pH 4) and 10 μl of
methanolic internal standard solution containing 10,000 ng/ ml of each temazepam-d5, haloperidol-d4, and morphine-d3 were added. The three internal standards were chosen in order to get a reference for the retention times over the whole chromatographic run and to control the efficiency of both extraction columns. The samples were vigorously vortexed and centrifuged for 5 min at 11,700×g and 10 °C.
130 μl of the supernatant were transferred into an
autosampler vial.
The procedure for the hydrolysis was adapted from Eichhorst et al. [21]. 500 μl of urine were acidified with 10 μl of glacial acetic acid, and 50 μl of
beta-glucuronidase/arylsulfatase from Helix pomatia were added. After vortexing, the samples were placed in a water bath (55 °C) for 1 h. An aliquot of 200μl of the hydrolyzed sample was diluted with 100 μl ammonium acetate buffer 50 mM (pH 4) and 20μl of the abovementioned methanolic internal standard solution were added. After vigorous vortexing and centrifugation for 5 min at 11,700×g and 10 °C, 250 μl of the supernatant was transferred into an autosampler vial.
LC method
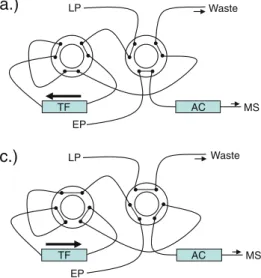
100 μl of the sample were injected into the LC system. Extraction was done using two columns in series, a Cyclone and C18XL extraction column (Thermo Fisher Scientific, Basel, Switzerland). A Betasil Phenyl/Hexyl column, 100× 3 mm with 3 μm particle size (Thermo Fisher Scientific, Basel, Switzerland) was utilized as an analytical column. A schematic view of the online extraction system with the different steps can be seen in Fig.1. The following eluents were used: loading B, 10 mM ammonium carbonate buffer in water; loading C, 2-propanol/acetone/acetonitrile 1/1/1 (v/v/v); eluting A, 5 mM ammonium acetate in water +0.1% formic acid; eluting B, 5 mM ammonium acetate in methanol +0.5% formic acid; eluting C, 2-propanol/ace-tone/acetonitrile 1/1/1 (v/v/v). The details of the gradient applied and the flow rates used are reported in Table 1. Chromatography was performed at room temperature (approximately 24 °C), and the LC flow was diverted into the waste between 0 and 0.8 min and 27 and 32.35 min, respectively, using a divert valve.
MS TF AC EP LP Waste
a.)
b.)
TF AC EP LP Waste MS MS TF AC EP LP Wastec.)
Fig. 1 Configuration of the online extraction system. LP loading pump for the online extraction, EP eluting pump for the analytical chromatography, TF turbulent flow extraction columns, AC analytical column, MS mass spectrometer. a Loading, as well as washing, and equilibration step, corresponds to steps 1–2 and 9–15 in Table1. b
Short back-flush step, to remove precipitates from the entry frit of the extraction column to avoid clotting of the analytical column, corresponds to step 3 in Table1. c Elution of the analytes from the extraction column and analytical chromatography, corresponds to steps 4–8 in Table1
MS conditions
The compounds were ionized using an APCI source. The vaporizer temperature was set to 450 °C, the sheath gas to 30 arbitrary units (AU) and the auxiliary gas to 5 AU. The
discharge current was set at 5 μA, and the capillary
temperature was maintained at 275 °C. Polarity was switched from positive to negative mode within the same run. Normalized collision energy of 35% was used for the
generation of full-scan MS2 and MS3 spectra. The
acquisition of the chromatograms was performed using dependent acquisition with polarity switching. A data-dependent scan was triggered when a precursor mass from a predefined list was detected with an intensity above 100 counts per second.
In MS1, the mass range used was between 100 and
1,000 amu. The mass ranges for MS2and MS3spectra were automatically set by the instrument when performing data-dependent acquisition. The upper mass value was set 10 to 15 amu above the mass of the precursor ion and the lower mass at the low-mass cut-off of the instrument (about one fourth of the precursor mass). All scans were performed in full-scan mode.
Established toxicological screening methods
The established toxicological screening methods have been used for the analyses of patient samples, which have then been reanalyzed by the new LC-MSn screening method. The main method used was a GC-MS screening procedure
using 2 ml native urine and 2 ml chemically hydrolyzed urine. After liquid–liquid extraction, the extract was divided into two parts and two different derivatization procedures were applied (silylation and acetylation) [28]. In addition, targeted LC-MS2 screening methods were performed for the detection of amphetamines, antidepressants, beta-blockers, cocaine, dextromethorphan, methadone, opiates, and zolpidem. The urine samples were extracted using offline solid-phase extraction, and the chromatographic conditions as well as the data-dependent MS2 acquisitions have been optimized for the different groups of compounds [29].
Method validation Specificity
Urine samples of six different healthy volunteers who were not taking any medications were analyzed and searched against the spectral library.
Matrix effects
Matrix effects were evaluated qualitatively according to the method described by Bonfiglio et al. [30]. Urine samples from six different patients who were not taking any medications were pre-treated as described above. Five out of the six urine samples were selected to show pathological values for ketone bodies, urobilinogen, protein, hemoglo-bin, or bacteria (urine 1—ketone bodies, 800 mg/l and
Table 1 Gradient used
Step no. Time Flow LP (ml/min) Loading B (%) Loading C (%) Flow EP (ml/min) Eluting A (%) Eluting B (%) Eluting C (%)
1 0 2 100 0.3 99 1 2 0:50 2 100 0.3 99 1 3 0:55 0.5 100 0.3 99 1 4 1:35 0.5 100 0.3 99 1 5 7:15 0.01 100 0.3 55 45 6 14:45 0.01 100 0.3 40 60 7 23:05 0.01 100 0.3 2 98 8 25:05 0.01 100 0.5 2 98 9 27:05 2 100 0.5 2 98 10 27:06 2 100 0.5 2 100 11 29:05 2 100 0.5 100 12 29:35 2 100 0.5 100 13 31:35 2 100 0.5 99 1 14 31:36 2 100 0.3 99 1 15 32:35 2 100 0.3 99 1
The total method duration was 32:35 min
protein, 300 mg/l; urine 2—ketone bodies, 400 mg/l and protein, 300 mg/l; urine 3—urobilinogen, 40 mg/l; urine 4—protein, 300 mg/l; urine 5—hemoglobin, 10 mg/l and bacteria (not differentiated or identified), 21/μl of urine; urine 6—healthy volunteer).
Forty-seven representative substances (Table 2) have been selected to cover the whole retention time range and mass range. During the injection of the six urine samples by the autosampler, the 47 substances (each, 1,000 ng/ml) were introduced in groups of eight to ten substances by post-column infusion via a T-valve with a flow rate of 3μl/min.
The approach for the quantitative evaluation of matrix effects was adapted to the one described by Matuszewski
et al. [31]. The same urine samples as used in the
qualitative analysis were spiked with the same mixtures of 47 substances at 100 and 1,000 ng/ml to simulate different concentrations observed in intoxication cases. The resulting peak areas were compared with the peak areas of neat standards in solvent (n=6).
Recovery
The recovery was determined at 100 ng/ml (n=6) with the same 47 substances already used for the matrix effect experiments. Recovery was calculated by dividing the peak area of the standards in solvent injected onto the extraction columns with subsequent analytical chromatography by the peak area of standards in solvent injected directly onto the analytical column, omitting the online extraction step. In analogy to Matuszewski et al. [31], no spiked urine samples were used to clearly distinguish between matrix effects and recovery.
Limit of identification
Aliquots of pooled blank urines from different healthy volunteers not taking any medications were spiked with all 356 substances to achieve a concentration of 10, 100, and 1,000 ng/ml of each substance. The lowest concentration where a substance was identified by ToxID was considered as the limit of identification (n=3).
Carryover
Carryover was tested for all 356 substances by injecting urine samples spiked with 10,000 ng/ml in groups of ten sub-stances/urine. Two blank samples were injected following the high concentrated urine and searched against the library to detect the presence of any substances. The peak heights of the first blank samples were divided by the peak height of the highly concentrated standard to get a quantitative evaluation of carryover.
Reproducibility
For all reproducibility experiments, the same set of compounds already used for the determination of the matrix effects and the recovery have been used at a concentration of 100 ng/ml.
The reproducibility of retention times was checked both within day (n=6) and between days (n=6) by calculating the coefficient of variation (CV) of the retention times. The between-day analysis included columns of different lots to check its influence.
The reproducibility of the measured mass-to-charge ratios was checked both within day (n=6) and between days (n=6) by calculating the CV of the mass-to-charge ratio of the most intense peak of the MS2 spectra of the compounds.
The reproducibility of the mass spectra was checked both within day (n = 6) and between days (n = 6) by calculating the CV of the matching factors (search fit) reported by ToxID.
Analysis of patient samples
A total of 103 patient samples which were already analyzed by the GC-MS procedure [28], existing targeted LC-MS2 screening methods [29], and immunological screening methods were reanalyzed with the new online extraction LC-MSnscreening method. The samples have been stored at−20 °C until analysis (for up to 8 months). The results were analyzed by a person who had no information about the results obtained from the existing screening methods.
Results
Method validation Specificity
In urine samples from persons not smoking nor drinking beverages containing caffeine, no substances have been identified. In the samples of healthy volunteers drinking coffee or energy drinks or smoking, besides caffeine, nicotine, and cotinine, no other substances have been identified.
Matrix effects
In the qualitative method, ion suppression was observed only in urine samples positive for ketone bodies in high concentrations (>400 mg/l). In all other cases, no matrix effects could be detected. Ion suppression has been observed mainly at the beginning of the chromatographic
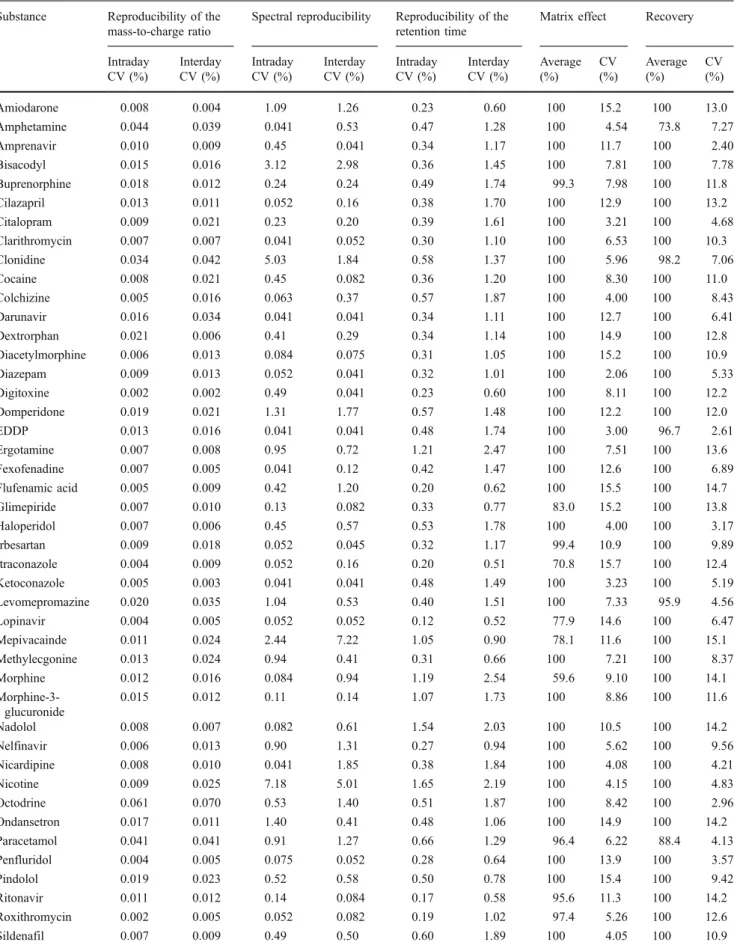
Table 2 Reproducibility data for mass-to-charge ratio, spectral reproducibility, and retention time variation (intraday and interday, n=6) as well as matrix effect and recovery data (n=6)
Substance Reproducibility of the mass-to-charge ratio
Spectral reproducibility Reproducibility of the retention time
Matrix effect Recovery
Intraday CV (%) Interday CV (%) Intraday CV (%) Interday CV (%) Intraday CV (%) Interday CV (%) Average (%) CV (%) Average (%) CV (%) Amiodarone 0.008 0.004 1.09 1.26 0.23 0.60 100 15.2 100 13.0 Amphetamine 0.044 0.039 0.041 0.53 0.47 1.28 100 4.54 73.8 7.27 Amprenavir 0.010 0.009 0.45 0.041 0.34 1.17 100 11.7 100 2.40 Bisacodyl 0.015 0.016 3.12 2.98 0.36 1.45 100 7.81 100 7.78 Buprenorphine 0.018 0.012 0.24 0.24 0.49 1.74 99.3 7.98 100 11.8 Cilazapril 0.013 0.011 0.052 0.16 0.38 1.70 100 12.9 100 13.2 Citalopram 0.009 0.021 0.23 0.20 0.39 1.61 100 3.21 100 4.68 Clarithromycin 0.007 0.007 0.041 0.052 0.30 1.10 100 6.53 100 10.3 Clonidine 0.034 0.042 5.03 1.84 0.58 1.37 100 5.96 98.2 7.06 Cocaine 0.008 0.021 0.45 0.082 0.36 1.20 100 8.30 100 11.0 Colchizine 0.005 0.016 0.063 0.37 0.57 1.87 100 4.00 100 8.43 Darunavir 0.016 0.034 0.041 0.041 0.34 1.11 100 12.7 100 6.41 Dextrorphan 0.021 0.006 0.41 0.29 0.34 1.14 100 14.9 100 12.8 Diacetylmorphine 0.006 0.013 0.084 0.075 0.31 1.05 100 15.2 100 10.9 Diazepam 0.009 0.013 0.052 0.041 0.32 1.01 100 2.06 100 5.33 Digitoxine 0.002 0.002 0.49 0.041 0.23 0.60 100 8.11 100 12.2 Domperidone 0.019 0.021 1.31 1.77 0.57 1.48 100 12.2 100 12.0 EDDP 0.013 0.016 0.041 0.041 0.48 1.74 100 3.00 96.7 2.61 Ergotamine 0.007 0.008 0.95 0.72 1.21 2.47 100 7.51 100 13.6 Fexofenadine 0.007 0.005 0.041 0.12 0.42 1.47 100 12.6 100 6.89 Flufenamic acid 0.005 0.009 0.42 1.20 0.20 0.62 100 15.5 100 14.7 Glimepiride 0.007 0.010 0.13 0.082 0.33 0.77 83.0 15.2 100 13.8 Haloperidol 0.007 0.006 0.45 0.57 0.53 1.78 100 4.00 100 3.17 Irbesartan 0.009 0.018 0.052 0.045 0.32 1.17 99.4 10.9 100 9.89 Itraconazole 0.004 0.009 0.052 0.16 0.20 0.51 70.8 15.7 100 12.4 Ketoconazole 0.005 0.003 0.041 0.041 0.48 1.49 100 3.23 100 5.19 Levomepromazine 0.020 0.035 1.04 0.53 0.40 1.51 100 7.33 95.9 4.56 Lopinavir 0.004 0.005 0.052 0.052 0.12 0.52 77.9 14.6 100 6.47 Mepivacainde 0.011 0.024 2.44 7.22 1.05 0.90 78.1 11.6 100 15.1 Methylecgonine 0.013 0.024 0.94 0.41 0.31 0.66 100 7.21 100 8.37 Morphine 0.012 0.016 0.084 0.94 1.19 2.54 59.6 9.10 100 14.1 Morphine-3-glucuronide 0.015 0.012 0.11 0.14 1.07 1.73 100 8.86 100 11.6 Nadolol 0.008 0.007 0.082 0.61 1.54 2.03 100 10.5 100 14.2 Nelfinavir 0.006 0.013 0.90 1.31 0.27 0.94 100 5.62 100 9.56 Nicardipine 0.008 0.010 0.041 1.85 0.38 1.84 100 4.08 100 4.21 Nicotine 0.009 0.025 7.18 5.01 1.65 2.19 100 4.15 100 4.83 Octodrine 0.061 0.070 0.53 1.40 0.51 1.87 100 8.42 100 2.96 Ondansetron 0.017 0.011 1.40 0.41 0.48 1.06 100 14.9 100 14.2 Paracetamol 0.041 0.041 0.91 1.27 0.66 1.29 96.4 6.22 88.4 4.13 Penfluridol 0.004 0.005 0.075 0.052 0.28 0.64 100 13.9 100 3.57 Pindolol 0.019 0.023 0.52 0.58 0.50 0.78 100 15.4 100 9.42 Ritonavir 0.011 0.012 0.14 0.084 0.17 0.58 95.6 11.3 100 14.2 Roxithromycin 0.002 0.005 0.052 0.082 0.19 1.02 97.4 5.26 100 12.6 Sildenafil 0.007 0.009 0.49 0.50 0.60 1.89 100 4.05 100 10.9
run and was affecting in tendency compounds having a lower molecular weight.
With the quantitative method, 89% of the compounds showed no ion suppression (Table 2). Maximum suppres-sion of the signal led to a reduction of the signal intensity of 40%. Substances which have been suppressed more than 15% were glimepiride, itraconazol, lopinavir, mepivacaine, and morphine. It has been demonstrated that the signal, even with the lower concentration tested (100 ng/ml), was not completely lost and all the compounds could still be identified by ToxID. Since the method is not intended to be used as a quantitative method, these results were considered as acceptable.
Recovery
Recovery was above 74% for all compounds tested (Table2). About 97% of the substances showed a recovery higher than 90%, indicating that this new online extraction procedure is able to extract different compounds having different polarities and masses with good recoveries. Limit of identification
The limit of identification was below 10 ng/ml for 213 (60%) out of the 356 substances which were part of the library. At a concentration of 100 ng/ml, 329 (90%) of all compounds could be identified, and at 1,000 ng/ml, all substances have been successfully identified, which makes it possible to detect most of the substances in urine already after the intake of therapeutic doses. The limits of identification for all 356 compounds tested are reported in the Electronic supplementary material (Table S1).
Carryover
The carryover for all substances was below 1% for all substances in the first blank sample after injection of the highly concentrated spiked urine. In the second blank, no substances have been identified.
In order to prevent any misleading results due to carryover, a blank sample was run after the injection of every patient sample.
Reproducibility
Reproducibility data are shown in Table2. The CV for the reproducibility of the retention time was below 1.7% for the intraday measurements and below 2.5% for the interday measurements. Therefore, a time window of 1.5 min was set for the identification of compounds using ToxID.
The CV for the reproducibility of the measurements of the mass-to-charge ratios was below 0.06% for the intraday measurements and below 0.07% for the interday measure-ments, indicating an excellent calibration stability of the non-high resolution instrument.
The CV for the reproducibility of the mass spectra was below 7.2% both for the intraday and the interday measure-ments, demonstrating good reproducibility of the fragmen-tation pattern.
Analysis of patient samples
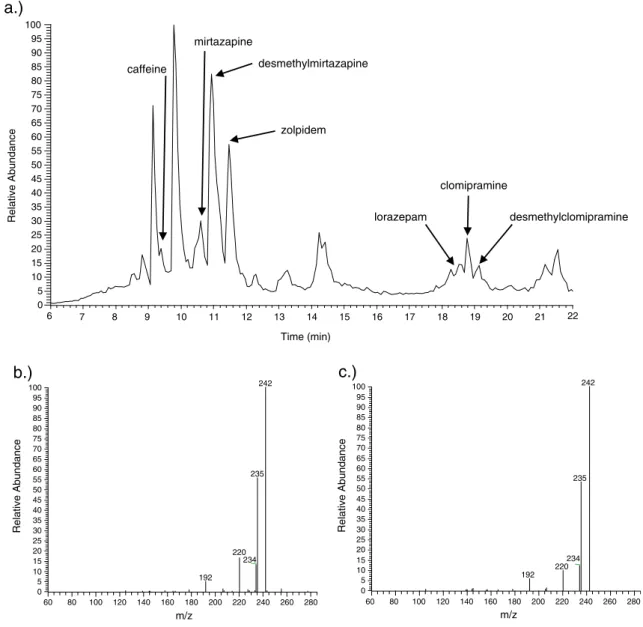
An example of a real patient urine sample chromatogram is shown in Fig.2.
Among 103 patient samples, a total of 451 substances could be identified using the combination of both, the established methods and the new method (Fig. 3). When using only the established methods, 354 substances (78%, 106 different compounds) could be found. Applying only the method presented, 404 substances (89%, 100 different coumpounds) could be identified. For seven patient samples, no compounds have been detected.
Forty-one substances identified by the established methods could not be detected with the new screening method. Out of these compounds, 38 substances (93%) were at the time when the samples have been analyzed not yet included in the library. This illustrates clearly the need for a library containing more entries. The three remaining substances (flurazepam and two samples with duloxetine)
Table 2 (continued)
Substance Reproducibility of the mass-to-charge ratio
Spectral reproducibility Reproducibility of the retention time
Matrix effect Recovery
Intraday CV (%) Interday CV (%) Intraday CV (%) Interday CV (%) Intraday CV (%) Interday CV (%) Average (%) CV (%) Average (%) CV (%) Tranylcypromine 0.021 0.030 0.90 0.66 0.67 0.64 98.6 7.47 93.4 14.9 Triazolam 0.008 0.014 0.076 0.15 0.40 1.25 100 6.48 100 8.43 Trimipramine 0.030 0.020 1.26 1.02 0.30 1.48 100 4.86 100 4.58
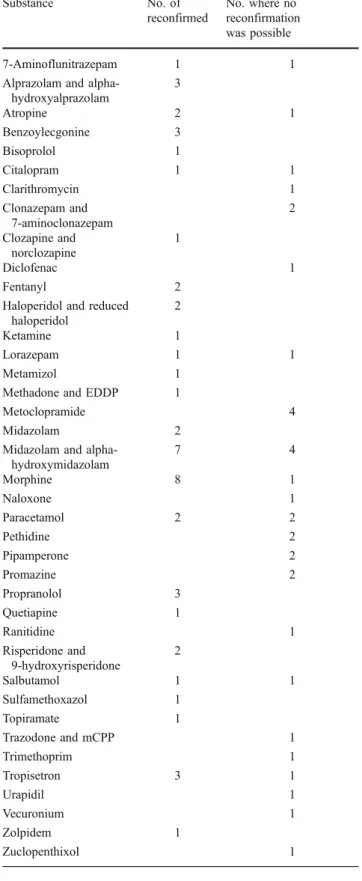
were only present at very low concentrations and were therefore below the limit of identification of the new method. Eighty-six substances (38 different compounds) have been newly identified with the online screening method (Table 3). Out of these 86 substances, 52 (60%) could be reconfirmed by using dedicated methods (LC-MS/MS
methods in MRM mode or LC-MS2methods with library
matching). For the remaining 34 newly identified substan-ces, unfortunately, no confirmatory analysis was possible since there was not enough sample material left for a reconfirming analysis or there was no specific confirmatory method available in our laboratory.
In the four cases where a reconfirmation of the newly identified midazolam was not possible,
alpha-hydroxymidazolam has also been identified, which con-firms the presence of midazolam in the sample. The same behavior was observed with the newly identified trazodone, where also its main metabolite, mCPP, has been identified in all cases. When clonazepam was identified by the new method, its metabolite 7-aminoclonazepam could also be found.
Discussion
In our laboratory, we often observed a higher matrix effect using electrospray ionization compared with APCI. This effect has also been described in the literature [27]. For that
6 7 8 9 10 11 12 13 14 15 16 17 18 19 20 21 22 Time (min) 0 5 10 15 20 25 30 35 40 45 50 55 60 65 70 75 80 85 90 95 100 Relative Abundance caffeine mirtazapine desmethylmirtazapine zolpidem lorazepam clomipramine desmethylclomipramine 60 80 100 120 140 160 180 200 220 240 260 280 m/z 0 5 10 15 20 25 30 35 40 45 50 55 60 65 70 75 80 85 90 95 100 Relative Abundance 242 235 220 234 192 60 80 100 120 140 160 180 200 220 240 260 280 m/z 0 5 10 15 20 25 30 35 40 45 50 55 60 65 70 75 80 85 90 95 100 Relative Abundance 242 235 234 220 192
a.)
b.)
c.)
Fig. 2 Example chromatogram and spectra. a Chromatogram of a real patient case with identified substances annotated (total ion chromato-gram). b Acquired MS3spectrum of a metabolite of the antidepressant
clomipramine, desmethylclomipramine, from the chromatogram shown in (a). c Library MS3spectrum of desmethylclomipramine
reason, we have decided to use APCI as the ionization mode for the screening method. One issue when using APCI is the higher likelihood of getting in-source frag-mentation; therefore, occasionally a fragment of a substance was used as a precursor ion instead of the molecular ion (cf. Electronic Supplementary Material (Table S1)).
During the method development, it became obvious that not all glucuronide metabolites could be retained during extraction. Whereas, morphine glucuronides could be detected, glucuronides of benzodiazepines, and beta-blockers were directly eluted to the waste, if present at low concentrations. Unfortunately, reference compounds for these metabolites were not available; therefore, an estimation of the identification limit was not possible. Consequently, the enzymatic hydrolysis step was added to cleave the glucuronides and allow the identification of these compounds. Out of the 110 different compounds identified with the new method in the 103 patient samples, 15% could only be detected after hydrolysis, all belonging to the drug classes mentioned above.
At the moment, our library contains 65 important metabolites (18% of all entries). As some substances are excreted exclusively as metabolites, more metabolites have to be added in the near future.
a.) 354 451 0 50 100 150 200 250 300 350 400 450 500
Established methods New method Established methods + new method
# of compounds
native samples additionally found only in hydrolysed samples
b.) 119 106 0 20 40 60 80 100 120 140
Established methods New method Established methods + new method
# of different compounds
native samples additionally found only in hydrolysed samples 67
17 337
93
Fig. 3 Results of the analysis of patient samples (n=103). Displayed is a the total number of identified substances in these urine samples and b the number of different compounds identified with the established methods, the new method and the total by combining all methods
Table 3 Substances which were newly identified using the LC-MSn online screening method
Substance No. of reconfirmed No. where no reconfirmation was possible 7-Aminoflunitrazepam 1 1
Alprazolam and alpha-hydroxyalprazolam 3 Atropine 2 1 Benzoylecgonine 3 Bisoprolol 1 Citalopram 1 1 Clarithromycin 1 Clonazepam and 7-aminoclonazepam 2 Clozapine and norclozapine 1 Diclofenac 1 Fentanyl 2
Haloperidol and reduced haloperidol
2
Ketamine 1
Lorazepam 1 1
Metamizol 1
Methadone and EDDP 1
Metoclopramide 4
Midazolam 2
Midazolam and alpha-hydroxymidazolam 7 4 Morphine 8 1 Naloxone 1 Paracetamol 2 2 Pethidine 2 Pipamperone 2 Promazine 2 Propranolol 3 Quetiapine 1 Ranitidine 1 Risperidone and 9-hydroxyrisperidone 2 Salbutamol 1 1 Sulfamethoxazol 1 Topiramate 1 Trazodone and mCPP 1 Trimethoprim 1 Tropisetron 3 1 Urapidil 1 Vecuronium 1 Zolpidem 1 Zuclopenthixol 1
Regarding the handling of the samples, the presented screening method requires only few manual steps due to the online extraction procedure, thereby reducing the risk for handling errors and also reducing variability of the results. Compared to existing GC-MS screening methods, the presented screening method offers several advantages. First of all, the new method is faster than the GC-MS screening method used in our laboratory as the total turnaround time for the analysis of a urine sample analysis in the case of intoxication is approximately 2 h (including hydrolysis), instead of the approximately 4 h required with our GC-MS procedure. Additionally, the method uses only 600 μl of sample material which is much less than the 4 ml required for the GC-MS analysis.
As compared with GC-MS, the most important disad-vantage of the new method is the limited size of the library. The classical disadvantage of LC-MS mass spectra as compared with GC-MS mass spectra is the reduced number of fragments in the LC-MS mass spectra in most cases. By
using MS3 spectra whenever possible, the number of
fragments could be increased.
Compared with the HPLC/DAD screening methods or the REMEDi system, full-scan MS2and MS3spectra offer a much better specificity.
Detection with exact mass instruments is a newer trend in the field of screening with LC-MS. The advantages of screening with exact mass instruments include the ability to retrospectively look at the data and thereby be able to identify new compounds that were not part of the library at the time the analysis took place. With the presented approach, the mass of the parent ion not part of the library can also be retrieved, but there are no MS2or MS3spectra acquired which would enable library searching.
Several years ago, Decastecker et al. [24] presented a method using a combined quadrupole–time-of-flight instru-ment with offline solid-phase extraction. Limits of identi-fication obtained with this method are very close to the one we have obtained using our screening approach.
Dresen et al. [16] recently published a library with over 1,200 substances on a hybrid triple quadrupole - linear ion trap instrument, which is a reasonable size for routine usage. A similar approach was already presented in 2006 by Sauvage et al. [32]. Offline solid-phase extraction was chosen as the extraction method. In this paper ion suppression was also investigated. The authors stated that with the 20 compounds they checked, no ion suppression was observed in the retention time range from 5.5 to 18.5 min. However, it is not clear if they also checked urine samples positive for ketone bodies, since ketone body positive urine samples are the only samples showing ion suppression under the setting presented here.
Lee et al. [22] recently published a method using ultra-performance liquid chromatography (UPLC) coupled to a
time-of-flight mass spectrometer for screening. Extraction was performed offline using an acidic and an alkaline fraction. Over 300 substances were included in the library. The limits of identification were in a similar range as with the method presented here. Matrix effects were also checked for a subset of compounds. With a maximal ion suppression of 50%, the results are comparable with our findings. However, the authors state that the urine samples used in these experiments were obtained from healthy volunteers. Since ketone bodies in urine are a sign of a metabolic lapse, it is unlikely that the urine samples from the volunteers were containing ketone bodies. Regarding the recovery, the authors stated a recovery between 0% and 80% for the substances they checked. With our online extraction system, recoveries were higher than 74% for all evaluated compounds.
Eichhorst et al. [21] recently presented a method using UPLC coupled to a triple stage quadrupole instrument in a screening approach for the detection of 40 different compounds. The screening method was intended as replacement for drug of abuse screening with immuno-assays, not a broad toxicological screening method. Detection of the compounds was performed using the ratio between two MRM transitions scanned for each compound. In our opinion, full-scan spectra give a much better specificity, especially when combined with retention time as orthogonal identification point. Also in this paper, matrix effects were taken into account. The authors state that the maximum loss of sensitivity was about 8%, but the origin of the urine matrices is unclear. Recoveries for the selected substances ranged between 80% and 118% and are therefore comparable to the results obtained with our method.
Two methods were published very recently using also ion trap instruments very similar to the one used in this paper. Liu et al. [9] presented a method where the library contains about 800 compounds. Liquid-liquid and solid-phase extraction of each 1 ml sample was used for sample preparation. The limits of identification were comparable with the method presented here; however no evaluation of matrix effects or recovery was performed.
Sturm et al. [11] published a method using an online extraction system based on online solid-phase extraction and APCI. Acquisition of spectra was performed in a very similar way as presented in this paper using data-dependent acquisition. However, the authors used two different runs, one in positive and one in negative mode, whereas in our approach, positive and negative scans are combined in a single run. Matrix effect experiments as well as limits of identification showed similar results. The size of the library was almost the same as in this paper with 365 compounds as compared with 356 compounds. Identification of the substances was based on the relative retention time as well
as the MS2 spectra. The method presented here uses retention times as well as MS2 and MS3 spectra which brings an additional level of specificity.
Conclusions
To our knowledge, this is the first description of an LC-MSnscreening method for the detection of 356 compounds using online extraction with turbulent flow chromatogra-phy. Since polarity switching was used, a single injection of a sample containing unknown compounds was sufficient to detect both substances ionizing in negative and positive modes. The presented method allows a fast and sensitive analysis of a broad range of compounds.
Acknowledgments The authors would like to thank Thermo Fisher Scientific for providing the LC-MS system and the online extraction instrument.
References
1. Maurer HH (2004) Position of chromatographic techniques in screening for detection of drugs or poisons in clinical and forensic toxicology and/or doping control. Clin Chem Lab Med 42:1310–1324 2. Baden LR, Horowitz G, Jacoby H, Eliopoulos GM (2001) Quinolones and false-positive urine screening for opiates by immunoassay technology. JAMA 286:3115–3119
3. Aebi B, Bernhard W (2002) Advances in the use of mass spectral libraries for forensic toxicology. J Anal Toxicol 26:149–156 4. Pragst F, Herzler M, Erxleben B (2004) Systematic toxicological
analysis by high-performance liquid chromatography with diode array detection (HPLC-DAD). Clin Chem Lab Med 42:1325–1340 5. Schönberg L, Grobosch T, Lampe D, Kloft C (2006) New
screening method for basic compounds in urine by on-line extraction–high-performance liquid chromatography with photodiode-array detection. J Chromatogr A 1134:177–185 6. Binder S, Regalia M, Biaggi McEachern M, Mazhar M (1989)
Automated liquid chromatographic analysis of drugs in urine by on-line sample cleanup and isocratic muticolumn separation. J Chromatogr 473:325–341
7. Kratzsch C, Tenberken O, Peters FT, Weber AA, Kraemer T, Maurer HH (2004) Screening, library-assisted identification and validated quantification of 23 benzodiazepines, flumazenil, zale-plone, zolpidem and zopiclone in plasma by liquid chromatogra-phy/mass spectrometry with atmospheric pressure chemical ionization. J Mass Spectrom 39:856–872
8. Lips AG, Lameijer W, Fokkens RH, Nibbering NM (2001) Methodology for the development of a drug library based upon collision-induced fragmentation for the identification of toxico-logically relevant drugs in plasma samples. J Chromatogr B Biomed Sci Appl 759:191–207
9. Liu H-C, Liu RH, Lin D-L, Ho H-O (2010) Rapid screening and confirmation of drugs and toxic compounds in biological speci-mens using liquid chromatography/ion trap tandem mass spec-trometry and automated library search. Rapid Commun Mass Spectrum 24:75–84
10. Dulaurent S, Moesch C, Marquet P, Gaulier JM, Lachatre G (2010) Screening of pesticides in blood with liquid chromatography-linear ion trap mass spectrometry. Anal Bioanal Chem 396:2235–2249
11. Sturm S, Hammann F, Drewe J, Maurer HH, Scholer A (2010) An automated screening method for drugs and toxic compounds in human serum and urine using liquid chromatography-tandem mass spectrometry. J Chromatogr B Analyt Technol Biomed Life Sci 878:2726–2732
12. Marquet P, Saint-Marcoux F, Gamble T, Leblanc J (2003) Comparison of a preliminary procedure for the general unknown screening of drugs and toxic compounds using a quadrupole-linear ion-trap mass spectrometer with a liquid chromatography-mass spectrometry reference technique. J Chromatogr B 789:9–18 13. Mueller CA, Weinmann W, Dresen S, Schreiber A, Gergov M (2005) Development of a multi-target screening analysis for 301 drugs using a QTrap liquid chromatography/tandem mass spec-trometry system and automated library searching. Rapid Commun Mass Spectrom 19:1332–1338
14. Dresen S, Ferreiros N, Gnann H, Zimmermann R, Weinmann W (2010) Detection and identification of 700 drugs by multi-target screening with a 3200 Q TRAP LC-MS/MS system and library searching. Anal Bioanal Chem 396:2425–2434
15. Lynch KL, Breaud AR, Vandenberghe H, Wu AH, Clarke W (2010) Performance evaluation of three liquid chromatography mass spectrometry methods for broad spectrum drug screening. Clin Chim Acta 411:1474–1481
16. Dresen S, Gergov M, Politi L, Halter C, Weinmann W (2009) ESI-MS/MS library of 1, 253 compounds for application in forensic and clinical toxicology. Anal Bioanal Chem 395:2521– 2526
17. Jansen R, Lachatre G, Marquet P (2005) LC-MS/MS systematic toxicological analysis: comparison of MS/MS spectra obtained with different instruments and settings. Clin Biochem 38:362–372 18. Hopley C, Bristow T, Lubben A, Simpson A, Bull E, Klagkou K, Herniman J, Langley J (2008) Towards a universal product ion mass spectral library - reproducibility of product ion spectra across eleven different mass spectrometers. Rapid Commun Mass Spectrom 22:1779–1786
19. Oberacher H, Pavlic M, Libiseller K, Schubert B, Sulyok M, Schuhmacher R, Csaszar E, Kofeler HC (2009) On the inter-instrument and inter-laboratory transferability of a tandem mass spectral reference library: 1. Results of an Austrian multicenter study. J Mass Spectrom 44:485–493
20. Oberacher H, Pavlic M, Libiseller K, Schubert B, Sulyok M, Schuhmacher R, Csaszar E, Kofeler HC (2009) On the inter-instrument and the inter-laboratory transferability of a tandem mass spectral reference library: 2. Optimization and characteriza-tion of the search algorithm. J Mass Spectrom 44:494–502 21. Eichhorst JC, Etter ML, Rousseaux N, Lehotay DC (2009) Drugs
of abuse testing by tandem mass spectrometry: a rapid, simple method to replace immunoassays. Clin Biochem 42:1531–1542 22. Lee HK, Ho CS, Iu YPH, Lai PSJ, Shek CC, Lo Y-C, Klinke HB,
Wood M (2009) Development of a broad toxicological screening technique for urine using ultra-performance liquid chromatogra-phy and time-of-flight mass spectrometry. Anal Chim Acta 649:80–90
23. Ojanperä S, Pelander A, Pelzing M, Krebs I, Vuori E, Ojanperä I (2006) Isotopic pattern and accurate mass determination in urine drug screening by liquid chromatography/time-of-flight mass spectrometry. Rapid Commun Mass Spectrom 20:1161–1167 24. Decaestecker T, Vande Casteele S, Wallemacq P, Van Peteghem C,
Defore D, Van Bocxlaer J (2004) Information-dependent acquisition-mediated LC-MS/MS screening procedure with semi-quantitative potential. Anal Chem 76:6365–6373
25. Ceglarek U, Lembcke J, Martin Fiedler G, Werner M, Witzigmann H, Peter Hauss J, Thiery J (2004) Rapid simultaneous quantifi-cation of immunosuppressants in transplant patients by turbulent flow chromatography combined with tandem mass spectrometry. Clin Chim Acta 346:181–190
26. Breaud AR, Harlan R, Di Bussolo JM, McMillin GA, Clarke W (2010) A rapid and fully-automated method for the quantitation of tricyclic antidepressants in serum using turbulent-flow liquid chromatography-tandem mass spectrometry. Clin Chim Acta 411:825–832
27. Dams R, Huestis MA, Lambert WE, Murphy CM (2003) Matrix effect in bio-analysis of illicit drugs with LC-MS/MS: influence of ionization type, sample preparation, and biofluid. J Am Soc Mass Spectrom 14:1290–1294
28. Zgraggen S, Bonatim R, Gutteck-Amsler U, Rentsch KM (2007) Toxicological screening after the REMEDI™—comparison of a GC-MS screening with the REMEDI™. Ther Drug Monit 29:492–492
29. Mueller DM, Rentsch KM (2009) Development and validation of a library-assisted toxicological screening method in urine by LC-MS2. In: Proceedings XVI GTFCh-Symposium. pp. 166–169 30. Bonfiglio R, King R, Olah T, Merkle K (1999) The effects of
sample preparation methods on the variability of the electrospray ionization response for model drug compounds. Rapid Commun Mass Spectrom 13:1175–1185
31. Matuszewski BK, Constanzer ML, Chavez-Eng CM (2003) Strate-gies for the assessment of matrix effect in quantitative bioanalytical methods based on HPLC-MS/MS. Anal Chem 75:3019–3030 32. Sauvage F-L (2006) Screening of drugs and toxic compounds
with liquid chromatography-linear ion trap tandem mass spec-trometry. Clin Chem 52:1735–1742