Spatial-temporal clustering of companion animal enteric
syndrome: detection and investigation through the use of
electronic medical records from participating private practices
R. M. ANHOLT1*, J. BEREZOWSKI2, C. ROBERTSON3 A N D C. STEPHEN1 , 4 1Faculty of Veterinary Medicine, Department of Ecosystem and Public Health, University of Calgary, AB,
Canada
2Veterinary Public Health Institute, Vetsuisse Faculty, University of Bern, Bern, Switzerland
3Department of Geography and Environmental Studies, Wilfrid Laurier University, Waterloo, ON, Canada 4Centre for Coastal Health, Nanaimo, BC, Canada
Received 11 June 2014; Final revision 28 September 2014; Accepted 28 November 2014; first published online 29 December 2014
SUMMARY
There is interest in the potential of companion animal surveillance to provide data to improve pet health and to provide early warning of environmental hazards to people. We implemented a companion animal surveillance system in Calgary, Alberta and the surrounding communities. Informatics technologies automatically extracted electronic medical records from participating veterinary practices and identified cases of enteric syndrome in the warehoused records. The data were analysed using time-series analyses and a retrospective space–time permutation scan
statistic. We identified a seasonal pattern of reports of occurrences of enteric syndromes in companion animals and four statistically significant clusters of enteric syndrome cases. The cases within each cluster were examined and information about the animals involved (species, age, sex), their vaccination history, possible exposure or risk behaviour history, information about disease severity, and the aetiological diagnosis was collected. We then assessed whether the cases within the cluster were unusual and if they represented an animal or public health threat. There was often insufficient information recorded in the medical record to characterize the clusters by aetiology or exposures. Space–time analysis of companion animal enteric syndrome cases found evidence of clustering. Collection of more epidemiologically relevant data would enhance the utility of practice-based companion animal surveillance.
Key words: Community outbreaks, gastrointestinal infections, GP surveillance systems, spatial modelling, veterinary epidemiology.
I N T R O D U C T I O N
The spatial and behavioural associations between people and their pets, with their shared risks and susceptibilities has motivated recommendations to use companion animals as sentinels of environmental
hazards for people [1–3]. However, companion animal surveillance has not been fully exploited as a method for identifying changing human environmen-tal risk. There is no mandate for companion animal surveillance in Canada and only a limited number of companion animal diseases are federally or provin-cially reportable.
Laboratory surveillance may have limited value. An aetiological diagnosis, based on laboratory confirmation is often not pursued in companion
* Author for corresponding: Miss R. M. Anholt, TRW2D16, 3280 Hospital Dr. NW, Calgary, AB, Canada, T2N 4Z6.
animal practice as veterinarians frequently rely on em-pirical management of their patients [4]. When a diag-nosis is sought, samples from clinical cases are often tested in private laboratories from which there is currently no formal means of sharing data. New approaches should be explored. Syndromic surveil-lance has shown promise for early detection of chang-ing disease patterns in human populations. The last decade has seen a focus on veterinary syndromic sur-veillance as a means of identifying signals associated with changing population health in a variety of avail-able data [5].
Syndromic surveillance uses existing data that are easily and electronically available and may include be-haviour (e.g. school attendance) or the signs and symptoms of disease (e.g. emergency room attendance with complaints) in a population. It aims to detect changing patterns in the data over time and/or lo-cation [6–8]. The utility of syndromic surveillance for early disease detection, its uses in research initia-tives and to support planning and policy development, have resulted in its continued growth in veterinary medicine [5]. The adoption of electronic medical records by veterinary practitioners provides an opportunity to employ informatics for data collection, management and analysis [9] to enable syndromic sur-veillance of pet populations.
Many methods are available for detecting unusual disease patterns in syndromic data [7, 10]. Spatial-temporal methods have been used to identify aberrations in disease frequency from an expected baseline [11]. Kuldorff et al. [12] developed a space– time permutation scan statistic that uses case counts from one data stream to identify disease clusters with-out requiring information abwith-out the underlying popu-lation at risk. Without denominator data, this method relies on historical data from normal time periods to serve as the control. Therefore the space–time permu-tation scan statistic is well suited to surveillance con-texts where the catchment area is undefined, the population at risk is unknown, and the volume of data is large [12, 13]. These are characteristics of veterinary practice surveillance. Kuldorff’s space– time permutation scan statistic has been applied in human [14–16] and veterinary [17,18] surveillance sys-tems. Maciejewski et al. [19] used the electronic medi-cal record and syndromic definitions to detect a change in time and spatial patterns of eye in flamma-tion in cats and gastrointestinal syndrome in dogs following a release of propyl mercaptan from a waste-processing facility in Fairburn, Georgia, USA.
The objective of space–time scan analysis of surveil-lance data is to detect unusual aggregations (clusters) of disease occurrences and to identify the location, size and duration of the aggregation. Suspected clusters must to be further investigated to determine whether they represent actionable signals originating from true changes in of patterns of disease in the popu-lation. In veterinary medicine this may be ac-complished using protocols that are similar to the frameworks described for outbreak investigations [20,21]. In this approach, additional data are sought for the post-hoc descriptive epidemiological character-ization of detected clusters. Charactercharacter-ization often includes a description of the location and dates of the clusters, a description of the animals involved (spe-cies, age, sex), their clinical histories, clinicalfindings and aetiological diagnoses [20, 21]. The distribution of cluster characteristics is compared to an expected distribution for the population at risk over the same time and space [22]. If the cluster is determined to be unexpected or unusual, then a hypothesis can be formulated as to its cause. However, once a signal has been detected in the data, there must be enough information available with which to make a decision in regards to a response [23].
In prospective surveillance with the objective of early warning, the final step is to determine if the cluster is of animal or public health importance and to communicate this information to those who need to know so that an intervention can be underta-ken [20, 21]. The objectives of retrospective space–time analysis may include: an epidemiological investigation of a health event, an enhanced under-standing of the natural history of the disease, or it may facilitate planning for disease eradication or management [24].
In this paper we present a retrospective analysis of companion animal enteric syndrome data collected from electronic medical records extracted from parti-cipating veterinary practices. This research had the following objectives:
(1) Use time-series analysis to visualize and charac-terize the trends and patterns of enteric syndrome in companion animals seen in private veterinary practices.
(2) Determine if it was possible to identify statisti-cally significant spatial-temporal clusters of en-teric syndrome in the study area.
(3) Determine if there was sufficient information to infer the potential cause(s) of the cluster.
(4) Determine if sufficient information could be accessed in electronic medical records to deter-mine the biological and epidemiological signi fi-cance of the clusters to human or animal health.
M E T H O D S
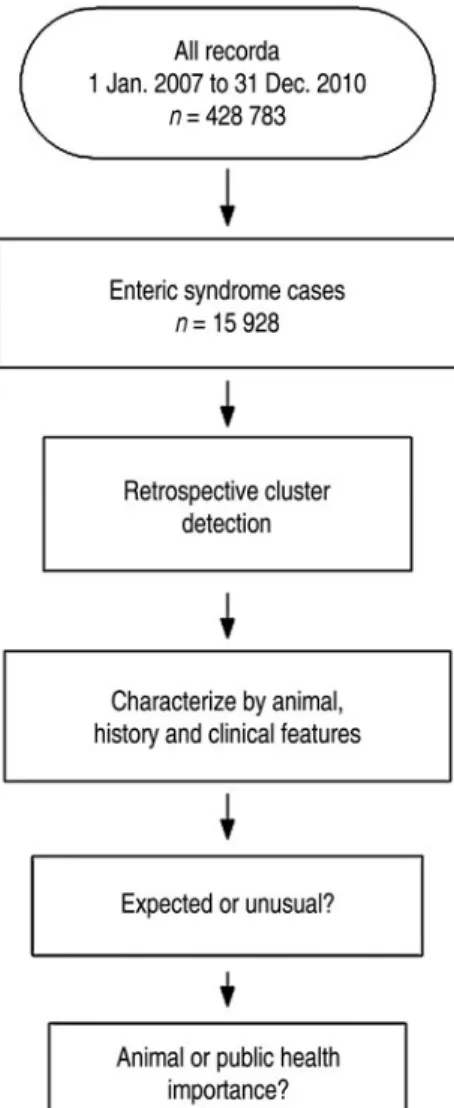
Figure 1provides an overview of the study’s methods. Study population and enteric syndrome data
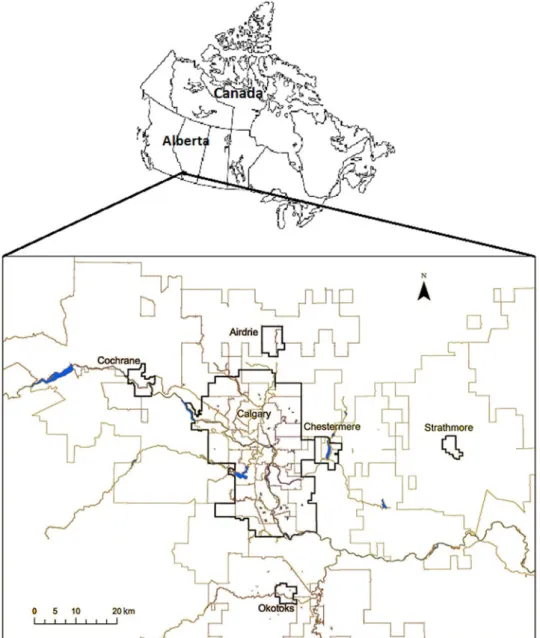
Electronic medical records were extracted from 12 participating veterinary practices in the city of Calgary, Alberta and the surrounding communities of Cochrane, Airdrie, Chestermere, Strathmore and Okotoks (Fig. 2). The participating practices repre-sented a convenience sample of companion animal
practices. Participating practices had completely com-puterized medical records and used the same veterin-ary management software for which a customized data extraction program was written to accurately ex-tract data. Records from each practice were aggre-gated into a single file which contained 428 783 companion animal records for the period 1 January 2007 to 31 December 2010. Thefile was stored in a se-cure data warehouse at the University of Calgary [25]. We used text-mining technology and an enteric syndromic case definition (all animals presenting to the veterinarian with complaints or clinical signs con-sistent with diarrhoea) to identify and retrieve enteric syndrome positive records from the warehoused medi-cal records [26]. Enteric syndromes resulting from in-fectious or parasitic aetiologies most often have an acute presentation which is defined as being 414 days’ duration [27]. Records from individual animals within 14 days of the initial visit were combined to represent one enteric syndrome case. There were 15 928 enteric syndrome cases. Data were stored and managed in Microsoft Office Excel 2007 (Microsoft, USA) and Konstanz Information Miner 2.2.2 (Knime, http://www.knime.org).
The date that the animalfirst presented to the veter-inarian with symptoms of enteric syndrome served as the time value for temporal analysis. To protect the identity of pet owners, only thefirst three digits of the owner’s home postal code (the forward sortation area; FSA) were obtained and these provided the spatial data (Canada Post, http://www.canadapost.ca/busi-ness/tools/pg/manual/PGaddress-e.asp# 1 382 487). There were 35 FSAs from within the city of Calgary and 15 FSAs in the remaining study area. The animal’s demographic data (species, age, sex, dog breed) and the medical notes recorded by the veterinarian or his/her staff were used to further characterize the cases.
Time series
The total number of enteric syndrome cases recorded for each day of the week was counted. The daily count and the 7-day moving average of daily case counts were plotted against time (Stata/IC 10.0, Stata Corp, USA). The results of these analyses were used to deter-mine appropriate parameter values required for the space–time permutation scan statistic. To characterize temporal trends, the daily number of enteric syndrome cases divided by the daily number of all cases was plotted against time and a regression line was fitted to the data (Stata/IC 10.0).
Fig. 1. Framework for detection and investigation of enteric syndrome clusters using companion animal electronic medical records (after [21]).
Scan statistic for space–time clusters
The space–time scan statistic software, SaTScan™, v. 9·1·1 (Kulldorff Information Management Services; http://www.satscan.org), and the retrospec-tive space–time permutation model [12] were used to detect clusters of enteric syndrome occurrences in the data. This analysis required two data files; the geographical coordinates (latitude and longitude) for the centroid of each FSA and the number of enteric cases for each FSA on each day of the study. Temporal aggregation was based on the variation in the number of cases that presented to the participating practices on each day of the week (see results below)
and was set at 7 days. Temporal aggregation also served to reduce the computing time. We used 100 days as the maximum size of the temporal window to reflect the seasonal pattern of enteric syndrome cases (see results below). The default maximum spatial window of 50% of the data was used. Statistical sign-ificance was evaluated using Monte Carlo re-sampling (999 repetitions) whereby the observed data was per-mutated under a null hypothesis of no disease cluster-ing and the observed data are compared to this random distribution [12]. The relative risk of a com-panion animal presenting with clinical signs of enteric syndrome inside the clusters compared with the sur-rounding area was estimated.
Evaluating the cluster signals
In each of the statistically significant (α = 0·05) clus-ters, the cases within the clusters were characterized by the animals involved, their histories and clinical features using the information available within the electronic medical records stored in the data ware-house. If necessary the records from previous or sub-sequent days (and outside the time-frame of the cluster) were reviewed to further characterize a case in-cluded in a cluster. For example, if an animal’s record indicated that a faecal sample had been submitted to a laboratory for diagnostic testing, subsequent records were searched tofind the laboratory results.
The median was used to describe the age of the ani-mals within the cluster. The remaining variables were reported as a proportion of cases within the cluster with the variable of interest and the 95% confidence interval (CI). This descriptive statistic was used for: (i) species (dogs, cats and ‘other species’ which in-cluded rabbits, ferrets and small rodents); (ii) intact animals (i.e. not spayed or neutered); (iii) vaccination history; (iv) exposure history; (v) disease severity (in-cluding haematochezia, admitted for intravenous fluid therapy, died or euthanized); and (vi) aetiological diagnosis.
The next step was to determine if the characteristics of cases within a cluster identified the cluster as either expected (similar to) or unexpected (unusual) com-pared to the characteristics of referent cases. To estab-lish the parameters of the reference population against which the clusters could be compared, the median age, and proportions (with 95% CI) for species, and sexu-ally intact animals, were calculated from all of the en-teric syndrome cases. For each of the remaining variables, the medical notes from a random sample of 500 enteric syndrome cases were reviewed to de-scribe the proportions of cases by the history of vacci-nations, exposure history, disease severity and the aetiological diagnosis. This sample size was sufficient to estimate the reference population’s proportions with a 4·4% precision, assuming the a priori estimate of the proportion to be (conservatively) 0·5, and a 5% significance level [28].
After the characteristics of the cluster were defined and it was determined that thefindings were unexpec-ted when compared to the reference population, we evaluated the information available within the elec-tronic medical records: (i) for the possibility of de-veloping a hypothesis as to the cause of the outbreak, (ii) to assess the possible risk factors for
enteric syndrome in the cluster, and/or (iii) to inform a response by animal health or public health authorities.
R E S U LT S Time series
There were 1242 enteric cases presenting to the parti-cipating veterinary practices on Sundays during the study period compared to an average of 2446 cases on each of the other 6 days of the week. This day of the week effect was a reflection of the veterinary prac-tices’ operating hours and informed the 7-day time ag-gregation in SaTScan.
The daily and 7-day moving average of counts of enteric cases were plotted against time. The numbers of enteric syndrome cases presenting to veterinarians increased in late summer and autumn (over a window of ∼100 days) for each of the 4 years of the study (Fig. 3). The seasonal pattern was still evident when the daily enteric cases were normalized by all cases presenting to the participating practices each day. The linear regression examining the number of enteric syndrome cases over all cases indicated there was no long-term trend (slope coefficient <0·0001) in the pro-portion of enteric syndrome cases over the time of the study (Fig. 4).
Space–time analysis
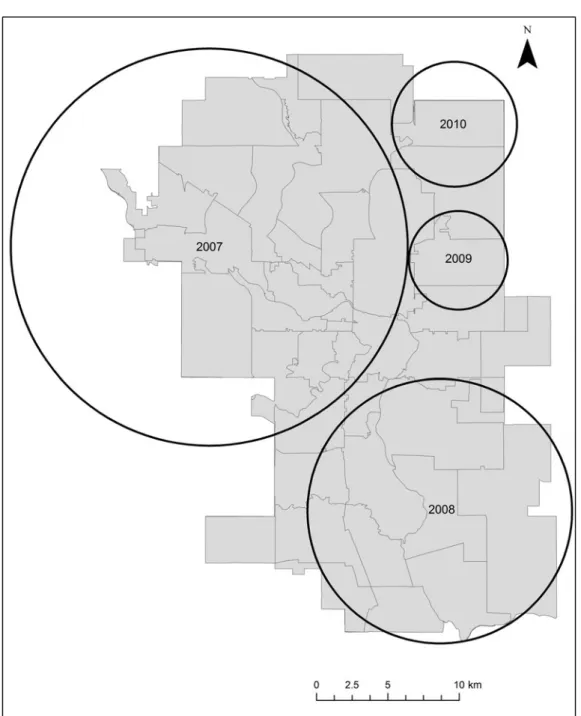
There were four significant (P < 0·05) clusters iden-tified, one each in 2007, 2008, 2009, and 2010 (Table 1,Figs 3and5).
Evaluating the cluster signals
The characteristics of the reference population were estimated and are reported inTable 2.
The distributions of cats and dogs within each of the clusters were as expected (similar to the reference population). Other species were not represented in the 2007, 2008, or the 2010 clusters. The 2009 cluster had an unexpectedly high proportion (0·125) of ferret cases. Four of the eight ferret cases had hyperadreno-corticoidism as a comorbidity, one was positive for parvovirus (Aleutian disease) and an aetiological diag-nosis was not obtained in the other three cases.
The vaccination status and severity of disease for cases within all of the clusters were similar to those in the reference population.
Two clusters (2008 and 2009) had a larger pro-portion of cases positive for canine parvovirus (CPV) than the reference population (Fig. 6). The time-frames for these two clusters overlapped the sea-sonal peak for enteric syndrome identified in the time
series (Fig. 3). The median age of the animals in these two clusters was different from enteric cases in the ref-erence population (Fig. 7). The 2009 cluster contained more animals that had not been spayed or neutered compared to the reference population (Fig. 8). The
Fig. 3. Daily count and 7-day moving average of counts of the enteric syndrome cases seen by the participating veterinary practices. Asterisks (*) Denotes cluster time-frames.
Fig. 4. Daily number of enteric cases divided by the daily number of all cases presented to the participating veterinary practices; proportion andfitted linear regression plotted against time.
Table 1. Significant clusters of enteric syndrome cases at participating companion animal practices identified using a retrospective space–time permutation model
Dates Radius P value
No. of cases
(expected number) Relative risk 7 Apr. to 13 July 2007 13·91 km 3·1 × 10–6 379 (268·8) 1·41 10 May to 15 Aug. 2008 9·27 km 2·4 × 10–3 445 (343·4) 9·27 19 Sept. to 27 Nov. 2009 3·46 km 4·2 × 10–6 68 (28·21) 3·46 16 Jan. to 22 Jan. 2010 4·38 km 5·8 × 10–4 11 (1·1) 4·38
Fig. 5. Map of Calgary, Alberta showing the significant clusters of enteric syndrome identified using retrospective space– time permutation model.
2009 cluster also had an unexpectedly high proportion of Shepherd-crosses in both the cases without an aetio-logical diagnosis and the CPV-positive cases; ten of the CPV cases presented to the veterinary practice together, were the same breed and age and so were presumed to be from the same litter. In cluster 2008, 10/22 positive CPV cases in the cluster were from the same pet store, another four were from the same litter, and three were from the same rescue organization.
The remaining two clusters (2007 and 2010) oc-curred outside the seasonal peak of enteric syndrome and had expected values for the proportion of cases with any positive aetiological diagnosis. The cases from the 2010 cluster had a median age of 0·13
years and most were still intact. Nine of these animals were boxer puppies from the same litter; there was no aetiological diagnosis. The increased number of cases in the 2007 and 2010 clusters may have been the result of a true increase in disease burden in the pet popu-lation, or they may have been an artifact. There was insufficient diagnostic or exposure information in the data to make this distinction.
D I S C U S S I O N
This study demonstrates that extracted electronic medical records from private veterinary practices has potential for characterizing disease trends and Table 2. Characteristics of reference population of enteric syndrome cases against which the cases within each significant cluster were compared
Variable Result Proportion 95% CI
Estimated from all enteric syndrome cases (n = 15 928)
Age Median = 2·9 years n.a. n.a.
Species Dog 0·842 −00·836–0·847
Cat 0·248 0·142–0·154
Other* 0·01 0·008–0·012
Spay/neuter status Intact 0·228 0·221–0·234
Spay or neutered 0·772 0·765–0·778 Estimated from a random sample of enteric syndrome cases (n = 500)
Vaccination history None provided 0·77 0·730–0·80
Up to date 0·186 0·153–0·223
Not up to date 0·044 0·028–0·066 Exposure history None provided 0·882 0·850–0·909
Comorbidity 0·042 0·026–0·063 Feed† 0·034 0·020–0·054 Medications 0·016 0·007–0·031 Housing‡ 0·01 0·003–0·023 Environmental exposure§ 0·006 0·001–0·017 Stress 0·006 0·001–0·017 Coprophagic 0·002 0·000–0·011
Disease severity Haematochezia 0·216 0·181–0·255 Hospitalization 0·066 0·046–0·091
Euthanasia 0·012 0·004–0·026
Aetiological diagnosis None provided 0·93 0·904–0·951 Giardia spp. 0·022 0·046–0·091 Canine parvovirus 0·018 0·008–0·034 Bacterial overgrowth|| 0·018 0·008–0·034 Helminths 0·004 0·000–0·014 Coccidia 0·004 0·000–0·014 Campylobacter spp.|| 0·002 0·000–0·011 Cryptosporidia spp. 0·002 0·000–0·011 n.a., Not applicable; CI, confidence interval.
* Other species includes ferrets, rabbits and small rodents † Feed includes raw diet, diet change, dietary indiscretion ‡ Housing includes pet store, breeder, boarding kennel
§ Environmental exposure includes hunter/scavenger, off leash parks, camping, hiking
patterns, and identifying clusters of excess cases of en-teric syndrome in pets. However, the validity of the surveillance system’s performance reported in this study could not be estimated because there was no alternative data source against which to measure the system.
The use of a syndromic case definition provided sufficient number of cases to identify clusters using the retrospective space–time permutation model. In this study the investigation of clusters was limited to a review of the clinical records. The lack of infor-mation in the medical records often limited the case assessment to a few demographic parameters. Most
of the case histories were only briefly documented es-pecially in terms of the animals’ potential risk beha-viours and risk exposures. A detailed examination of the potential risk factors for these clusters based on the records alone was compromised by a lack of data. This does provide an opportunity to educate pri-vate practice veterinarians about the importance of collecting epidemiologically relevant data.
Describing clusters by species, vaccination status, or disease severity was not useful for determining whether the clusters were unexpected or unusual. An increased number of cases diagnosed with CPV was useful for determining that two clusters (2008 and 2009) were unusual. These clusters were of animal health importance and being informed of an increased risk could be of interest to pet owners. CPV is capable of causing disease in pets and spreading rapidly through direct faecal–oral contact or environmental contamination [29]. There were too few aetiological diagnoses to understand the animal or human health importance of the 2007 and 2010 clusters.
The records from the 2008 and 2009 clusters pro-vided some information from which risk factor hy-potheses could be developed. Dog breeders were linked to increased numbers of CPV cases in these two clusters. A pet store and a rescue organization were associated with CPV cases in the 2008 cluster. The animals in both of these clusters were younger. The animals in the 2009 cluster were less likely to have been surgically sterilized compared to the refer-ence population despite a median age of 0·5 years;
Fig. 6. Proportion and 95% confidence interval of enteric syndrome cases positive for canineparvovirus in the reference population (sample, n = 500) and in each of the four significant space–time clusters.
Fig. 7. Median ages of the animals from all enteric syndrome cases (n = 15928) and within each of the four significant space–time clusters.
an age when most animals can be spayed or neutered. One possible hypothesis is that the pets in the 2009 clus-ter received less preventive veclus-terinary care than the pets in other regions of the study area. The vaccination his-tory would have provided some insight into this hypoth-esis but this information was not routinely recorded in these veterinary records. Further investigations such as surveys of the pet owners and of the veterinarians practising in this area of Calgary would be needed to understand the context of thesefindings.
An alternative approach to the analysis would be to examine the data by species. However, we expect that the evaluation of any additional species-specific clus-ters indentified with this approach would still be com-promised by the lack of clinical data.
If this study had been conducted prospectively and in real-time, the syndromic surveillance data could yield information that may inspire a targeted edu-cational campaign. For example, dog owners in the re-gion could be notified of an increased number of cases of CPV and the importance of vaccination stressed.
Clusters identified in a prospective study would require further investigations if there was insufficient information recorded in the medical records to deter-mine if the cases were biologically or epidemiologi-cally related. Contacting veterinary practices to seek additional information about risk behaviours and exposures in order to determine if the increased num-ber of cases is important, would be an obvious first step. Veterinarians are likely to be interested in
knowing if there is an unusual increase in enteric cases within their practice area. Given that few enteric cases in this study were routinely subjected to aetiolo-gical testing, communication of an unusual number of cases of diarrhoea could motivate veterinarians in the cluster area to increase diagnostic testing.
Public health responds to human cases of disease; there have been no studies indicating an association between companion animal enteric disease and human enteric disease in Alberta. There is no mandate or provisions for companion animal disease outbreak investigations in the province of Alberta and it is un-likely that any action would be taken by the public sector upon cluster detection. Implementation of this surveillance system would need to be led by the pri-vate or academic sector because these are the two sec-tors most likely to benefit from or use the outputs.
The results of this study were similar to those of Balter et al. [30]. These authors reported on a human syndromic surveillance system using emergency-department chief complaint data for gastrointestinal syndrome. Their system was capable of detecting seasonal outbreaks of diarrhoeal illness due to norovirus. However, an outbreak that occurred outside of the seasonal peak of diarrhoeal disease and that followed a widespread power outage had insufficient information recorded in the records to characterize that cluster by aetiology or exposures. Furthermore, the study by Maciejewski et al. [19] reported that they were unable to associate a
Fig. 8. Proportion and 95% confidence interval of enteric syndrome cases that had been sexually altered from all of the enteric syndrome cases (n = 15928) and in each of the four significant space–time clusters.
pet’s clinical signs, that may have been an indication of exposure to propyl mercaptan, with that of its owners.
We have demonstrated that cluster detection is poss-ible, but the importance of the cluster to animal or public health is compromised by the lack of data in the medical records– a critical information require-ment if inspiring action is the desired outcome of the disease surveillance. To overcome this limitation, in-cluding data from faecal examinations and faecal cul-ture results from the laboratories outside the veterinary practices may be helpful. It is also possible that if this system was adapted for surveillance of alternative syn-dromes such as respiratory or urinary tract diseases, the information biases affecting the data would be dif-ferent from those identified in this study.
The use of a convenience sample of veterinary prac-tices and the associated selection bias may have impac-ted this study’s results. In order for a case of enteric syndrome to be captured by this syndromic surveillance system, an animal exhibiting clinical signs of enteric disease needed to have an owner, their pet’s symptoms needed to be severe enough for the owner to justify a visit to the veterinarian and the animal had to be seen by a participating practice. Previous work [25] demonstrated that the data collected by this system was not geographically or demographically representa-tive of the underlying companion animal population. Pets in northeast Calgary were underrepresented in the data but enteric syndrome signals were detected in this region. Dogs and pets aged <1 year were over-represented in the data. This bias may have enhanced the ability of the system to detect the clusters with higher than expected numbers of CPV cases. It is also possible that the limitations found in the medical records in this study (few diagnostic tests performed and limited exposure information) were not consistent across the study area. Therefore the results of this study cannot be generalized to all of the pet population in Calgary and area.
We have described how syndromic electronic medi-cal record data from companion animal veterinary practices can be used for retrospective space–time surveillance in Alberta. The tools can also be used prospectively and could be useful to inform additional surveillance and control strategies. Demonstrating the value of these methods to veterinary practitioners may result in improved data collection. This study high-lights the value of developing both the technological and human capacities to strengthen animal disease surveillance.
AC K N O W L E D G E M E N T S
The authors thank Peter Peller, Librarian, Carto-graphic Materials and Spatial Data, University of Calgary.
D E C L A R AT I O N O F I N T E R E S T None.
R E F E R E N C E S
1. Cleaveland S, Laurenson MK, Taylor LH. Diseases of humans and their domestic mammals: pathogen charac-teristics, host range and the risk of emergence. Philosophical Transactions of the Royal Society of London, Series B: Biological Sciences 2001; 356: 991– 999.
2. Halliday JE,et al. A framework for evaluating animals as sentinels for infectious disease surveillance. Journal of the Royal Society, Interface 2007; 4: 973–984.
3. Rabinowitz PM. Human and animal sentinels for shared health risks. Veterinaria Italiana 2009; 45: 23–34. 4. Anholt RM, et al. Using informatics and electronic
medical record to describe antimicrobial use in the clini-cal management of diarrhea cases at 12 companion an-imal practices. PLoS ONE 2014; 9: e103190
5. Dórea FC, Sanchez J, Revie CW. Veterinary syndromic surveillance: current initiatives and potential for develop-ment. Preventive Veterinary Medicine 2011; 101: 1–17. 6. Henning KJ. Overview of syndromic surveillance. What
is syndromic surveillance. Morbidity and Mortality Weekly Report 2004; 53: 5–11.
7. Mandl KD,et al. Implementing syndromic surveillance: a practical guide informed by the early experience. Journal of the American Medical Informatics Asso-ciation 2004; 11: 141–150.
8. Babin S,et al. Understanding the data: Health indica-tors in disease surveillance. In: Lombardo JS, Buckeridge DL, eds. Disease Surveillance: A Public Health Informatics Approach. New Jersey: John Wiley and Sons, 2007, pp. 43–85.
9. Savel TG, Foldy S. The role of public health informatics in enhancing public health surveillance. CDC’s vision for public health surveillance in the 21st century. Morbidity and Mortality Weekly Report 2012; 61: 20–24.
10. Burkom H. Alerting algorithms for biosurveillance. In: Lombardo JS, DL Buckeridge, eds. Disease Sur-veillance: A Public Health Informatics Approach. New Jersey: John Wiley and Sons, 2007, pp. 143–187. 11. Carpenter TE. Methods to investigate spatial and
tem-poral clustering in veterinary epidemiology. Preventive Veterinary Medicine 2001; 48: 303–320.
12. Kulldorff M,et al. A space–time permutation scan stat-istic for disease outbreak detection. PLoS Medicine 2005; 2: 216–224.
13. Robertson C, et al. Review of methods for space–time disease surveillance. Spatial and Spatio-temporal Epi-demiology 2010; 1: 105–116.
14. Heffernan R, et al. Syndromic surveillance in public health practice, New York City. Emerging Infectious Diseases 2004; 10: 858–864.
15. Pearl D,et al. The use of outbreak information in the in-terpretation of clustering of reported cases of Escherichia coli O157 in space and time in Alberta, Canada, 2000– 2002. Epidemiology and Infection 2006; 134: 699–711. 16. Greene SK,et al. Timely detection of localized excess
influenza activity in Northern California across patient care, prescription, and laboratory data. Statistics in Medicine, 2011; 30: 549–559.
17. Recuenco S,et al. Spatial and temporal patterns of en-zootic raccoon rabies adjusted for multiple covariates. International Journal of Health Geographics 2007; 6: 14. 18. Van den Wijngaard C,et al. In search of hidden Q-fever outbreaks: Linking syndromic hospital clusters to infected goat farms. Epidemiology and Infection 2011; 139: 19–26.
19. Maciejewski R,et al. Companion animals as sentinels for community exposure to industrial chemicals: the Fairburn, GA, propyl mercaptan case study. Public Health Reports 2008; 123: 333–342.
20. Pavlin JA. Investigation of disease outbreaks detected by‘syndromic’ surveillance systems. Journal of Urban Health 2003; 80: i107–114.
21. Hurt-Mullen KJ, Coberly J. Syndromic surveillance on the epidemiologist’s desktop: making sense of much data. Morbidity and Mortality Weekly Report 2005; 54: 141–146.
22. Hertz-Picciotto I, Environmental epidemiology. In: Rothman KJ, Greenland S, Lash TL, eds. Modern
Epidemiology. Philadelphia: Lippincott Williams and Wilkins, 2008, pp. 598–619.
23. Wagner MM,et al. The emerging science of very early detection of disease outbreaks. Journal of Public Health Management and Practice 2001; 7: 51–59. 24. Teutsch SM, Considerations in planning a surveillance
system. In: Teutsch SM Churchill RE, eds. Principles and Practice of Public Health Surveillance. New York: Oxford University Press, 2000, pp. 17–29.
25. Anholt RM, et al. The application of medical infor-matics to the veterinary management programs at companion animal practices in Alberta, Canada: a case study. Preventive Veterinary Medicine 2014; 113: 165–174.
26. Anholt RM,et al. Mining free-text medical records for companion animal enteric syndrome surveillance. Preventive Veterinary Medicine 2014; 113: 417–422. 27. Triolo A, Lappin M. Acute medical diseases of the
small intestine. In: Tams T, ed. Handbook of Small Animal Gastroenterology. St Louis: Elsevier, 2003, pp. 195–210.
28. Dohoo IR, Martin W, Stryhn H. Sampling. In: Veterinary Epidemiologic Research. Charlottetown: VER Inc., 2009, p. 48.
29. Greene CE, Descaro N, Canine viral enteritis. In: Greene CE, ed. Infectious Diseases of the Dog and Cat. St Louis: Elsevier, 20012, pp. 67–80.
30. Balter S, et al. Three years of emergency department gastrointestinal syndromic surveillance in New York City: what have we found. Morbidity and Mortality Weekly Report 2005; 54: 175–180.