READ THESE TERMS AND CONDITIONS CAREFULLY BEFORE USING THIS WEBSITE. https://nrc-publications.canada.ca/eng/copyright
Vous avez des questions? Nous pouvons vous aider. Pour communiquer directement avec un auteur, consultez la première page de la revue dans laquelle son article a été publié afin de trouver ses coordonnées. Si vous n’arrivez pas à les repérer, communiquez avec nous à [email protected].
Questions? Contact the NRC Publications Archive team at
[email protected]. If you wish to email the authors directly, please see the first page of the publication for their contact information.
NRC Publications Archive
Archives des publications du CNRC
This publication could be one of several versions: author’s original, accepted manuscript or the publisher’s version. / La version de cette publication peut être l’une des suivantes : la version prépublication de l’auteur, la version acceptée du manuscrit ou la version de l’éditeur.
Access and use of this website and the material on it are subject to the Terms and Conditions set forth at
Quantifying the effectiveness of cathodic protection in water mains
Kleiner, Y.; Rajani, B. B.
https://publications-cnrc.canada.ca/fra/droits
L’accès à ce site Web et l’utilisation de son contenu sont assujettis aux conditions présentées dans le site LISEZ CES CONDITIONS ATTENTIVEMENT AVANT D’UTILISER CE SITE WEB.
NRC Publications Record / Notice d'Archives des publications de CNRC:
https://nrc-publications.canada.ca/eng/view/object/?id=7913659e-6272-4b15-8c48-099cae5e7928 https://publications-cnrc.canada.ca/fra/voir/objet/?id=7913659e-6272-4b15-8c48-099cae5e7928
Quantifying the effectiveness of cathodic protection in water mains
Kleiner, Y.; Rajani, B.
NRCC-45721
A version of this document is published in / Une version de ce document se trouve dans : NACE International Seminar, Northern Area, Montreal Section, Quebec City, Aug. 2002, pp. 1-10
Quantifying the effectiveness of cathodic protection in water mains
Yehuda Kleiner and Balvant RajaniNational Research Council of Canada Institute for Research in Construction
Abstract. Cathodic protection (CP) of metallic water mains has been proven in many
cases to be an effective method of reducing breakage frequency and extending the useful life of pipes, however, the effectiveness of CP can vary with specific conditions of water mains. The effectiveness of CP can ultimately be expressed in terms of economic benefits obtained as a result of reduction in breakage frequency and deferral of pipe replacement. Quantifying CP effectiveness can prove to be challenging because there are many factors contributing to variability in water main breaks while few water utilities have sufficient data to support credible research efforts.
In this paper we present an approach that was developed in collaboration with 12 Canadian water utilities from Quebéc, Ontario, Saskatchewan and Alberta. Breakage patterns, before and after implementation of CP, are statistically analysed. Contributing factors such as pipe and soil characteristics, climatic changes and the type of CP (retrofit or hotspot) are explicitly considered. Once the parameters of these breakage patterns are extracted, a thorough economic analysis is performed.
A computer application is being developed to facilitate the usage of this approach for the long-term planning of water main management and renewal.
Time-dependent factors affecting water main breaks
Kleiner and Rajani (2000) have proposed a multi-variate exponential (or an alternative power) model to consider time-dependent cyclical and operational factors in predicting water main breaks.
t x a t N x e x N( )= ( ) ⋅ 0 t (1)
where t = time elapsed from year of reference to,
xt = row vector of time-dependent covariates prevailing at time t,
a = column vector of parameters corresponding to covariates x, and 0
t
x = vector of baseline x values at year of reference to.
Time-dependent covariates (or “explanatory variables”) could be environmental
(climatic conditions, soil moisture, etc.) or operational (proportion of pipes protected by CP, pressure regimes, etc.). Parameters N
( )
xt0 and a can be found by least square regression (with or without linear transformation) or by using the maximum likelihood (ML) method.Three climatic covariates were examined for the case studies presented here. Freezing index (FI) is a surrogate measure for the severity of winter, and rain deficit (RD) is a surrogate measure for soil moisture. RD is considered in two separate forms. Cumulative
RD, which is a measure of the average soil moisture over a given time period,
corresponds to the effects described by Rajani et al. (1996). Snapshot RD, which is a measure of the soil moisture during winter, when the soil is mostly frozen, corresponds to the effects described by Rajani and Zhan (1996). In equation (1) FI and RD are expressed as Z-scores, which are the normalised forms of these variables.
Hotspot cathodic protection (HS CP)
Hotspot cathodic protection is the practice of installing a protective anode at the location of a pipe failure, right after the failure has been repaired. These anodes are typically installed without any means of monitoring and stay in the ground until total depletion, usually without replacement. The following assumptions are made in
assessing the effect of HS CP on the breakage rate of a (relatively homogeneous) group of pipes:
• A hotspot anode has an effective life of tLF years in the ground.
• A hotspot anode provides full protection after a time lag of tLG from time of anode
installation.
• When a HS CP program commences at year THS for a given group of pipes, every
break repair reported from year t onwards includes a hotspot anode. This anode provides active protection starting at time t + tLG and ending at time t + tLF.
• The exact location of a break (and a HS anode) along a pipe is assumed to be random. It is also assumed that a higher breakage frequency is likely in pipe segments that are more deteriorated than others. Consequently, the effectiveness of the active HS anodes (in terms of reducing breakage frequency) is expected to be higher at the beginning of a HS CP program, because many of these anodes will be placed in the more deteriorated parts of the network. Conversely, as new anodes are continually added, some are likely to be placed close to existing active anodes, reducing their impact. Consequently, as more breaks occur over time, more anodes are placed, likely to create a local “crowding effect”.
• For the time-dependent, multivariate analysis of breakage history, the HS CP covariate is taken as the number of active anodes per unit length of pipe in a given group of water mains, multiplied by the effectiveness factor fe. The HS CP covariate
is thus dependent both on the total length of the water mains at year t and the number of breaks in previous years.
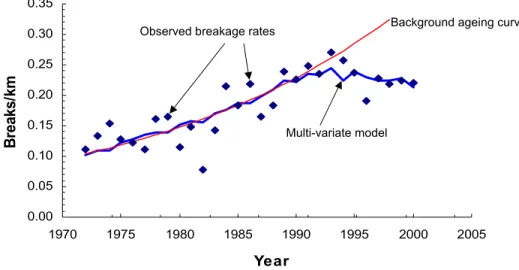
A case history is presented to illustrate the effect of HS CP on the breakage rate of water mains in an Eastern Ontario water utility (Utility A). The group of pipes in this case comprises 634 km of cast iron water mains, 6” (150 mm) to 12” (300 mm) in diameter, installed between 1946 and 1970. Utility A commenced a hotspot cathodic protection program in 1990, in which every pipe breakage repair was followed by an installation of a 32 lb. magnesium anode. These anodes typically provide adequate protection for 15 years and the time lag from installation to full protection was assumed to be one year. Figure 1 shows how the multi-variate model fits the observed historical breaks. The effect of the HS CP program is clearly visible as the multi-variate model begins to deviates from the background ageing curve (indicating theoretical breakage rate if no time-dependent factors were present) in the early 1990’s.
0.00 0.05 0.10 0.15 0.20 0.25 0.30 0.35 1970 1975 1980 1985 1990 1995 2000 2005 Year B rea ks /km
Observed breakage rates
Multi-variate model
Background ageing curve
Figure 1. Effect of HS CP on CI pipes in Utility A
The coefficient of determination for this regression is r2 = 0.73, while the adjusted coefficient of determination is ra2 = 0.68. It should be noted that in this case history,
climatic effects on historical breakage rate appear to be minimal and cannot explain the deviations of the observed breaks from the background ageing in the period prior to the HS CP program.
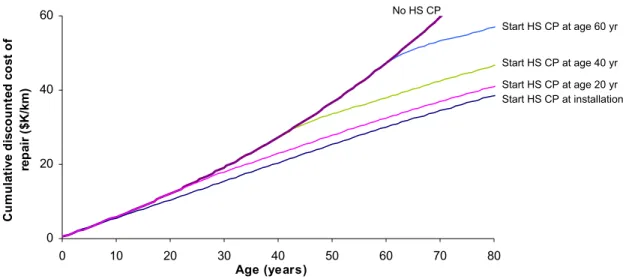
Once the model parameters are found, breakage rate can be predicted and economic analysis can be performed. Figure 2 shows how expected breakage repair costs are affected by the time at which the HS CP program is initiated. It shows that there is relatively little cost saving when HS CP is implemented very early in the life of a pipe. This is expected because at an early deterioration stage the number of breaks is relatively small and the number of HS anodes will thus be small, resulting in a very small
difference in breakage rates with or without HS CP. As the pipe deteriorates further, the cost savings in implementing HS CP become increasingly more significant. It can also be seen that the difference in costs are approximately constant (e.g., the cost curves of HS CP commencing at 0, 20, 40, and 60 years are nearly parallel). Cost of one breakage event (repair + water loss + social costs) was taken as $5000, and installation cost of each HS CP anodes was taken as $300. Discount rate was taken as 3%.
0 20 40 60 0 10 20 30 40 50 60 70 80 Age (years) C u m u la ti ve d isco u n te d co st o f re p a ir ( $ K /k m ) No HS CP Start HS CP at age 60 yr Start HS CP at age 40 yr Start HS CP at age 20 yr Start HS CP at installation
Figure 2. Cumulative cost of pipe breaks at different HS CP starting times – Utility A.
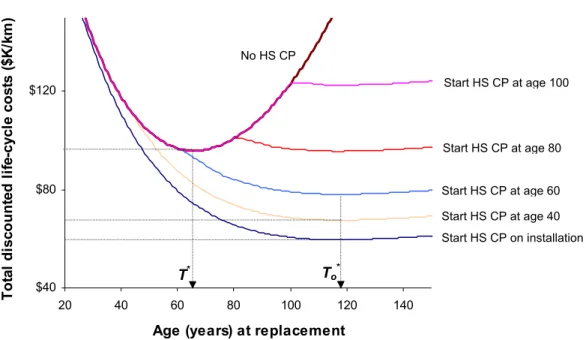
As we delay the time of replacement, the cost of breakage repair increases because of deterioration but at the same time the deferred cost of replacement decreases because of discounting. The total cost curve, as is shown in Figure 3, is typically convex, with a minimum cost denoting the optimal time for replacement T*. Under certain conditions HS CP can delay the optimal time of pipe replacement. In this case study T* = 67 years represents the optimal time for replacement of an unprotected pipe, which would result in a discounted life-cycle cost of approximately $96 K/km (cost of replacement pipe was taken as $300 K/km). If HS CP commences at pipe installation, its optimal time of replacement is expected to be deferred to year To* =118 with a total life-cycle cost of $60
K/km. If HS CP commences at year 40, its optimal time of replacement to is also expected to be deferred to year T40* =118 with a total life-cycle cost of $68 K/km. It can be
seen that if HS CP commences much later than T* it will have little or no effect on the optimal time of replacement.
$40 $80 $120
20 40 60 80 100 120 140
Age (years) at replacement
Tot a l di s c ount e d l if e -c y c le c os ts ( $ K /k m ) Start HS CP at age 100 Start HS CP at age 80 To * T* No HS CP Start HS CP at age 60 Start HS CP at age 40 Start HS CP on installation
Figure 3. Effect of HS CP on the life-cycle costs of pipes – Utility A.
It is interesting to note that the magnitude of this ‘life extension’ does not depend on how early HS CP commences. This is because the breakage rate of HS protected pipes in this model will tend to the same steady state regardless of when HS CP starts.
Retrofit cathodic protection (Retrofit CP)
Retrofit CP refers to the practice of systematically protecting existing pipes with galvanic cathodic protection. If the existing water main is electrically discontinuous (e.g., bell and spigot with elastomeric gaskets and no bridging) then an anode is attached to each pipe segment (typically 6 m or 20’ length). If the water main is electrically continuous then usually a bank of anodes in a single anode bed can protect a long stretch of pipe. In assessing the effect of retrofit CP on the breakage rate of a (relatively homogeneous) group of pipes the following is assumed.
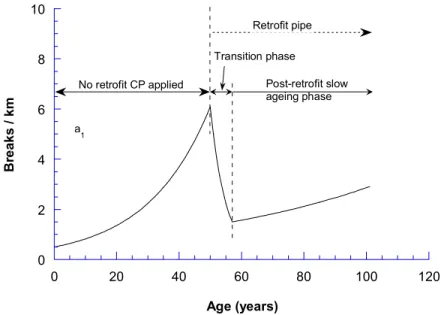
• Subsequent to CP retrofitting, the pipe breakage rate reduces exponentially over a transition period ttr. This is because the pipe is likely to have some deteriorated parts,
which will suffer imminent breakage. The CP can thus delay those breaks but not prevent them altogether.
• Once the protected pipe is “purged” of these imminent breaks, a new phase begins, in which the pipe continues to age (exponential growth of breakage rate) albeit at a lower rate than before protection.
• Retrofit anodes are monitored and replaced when fully depleted, thus the slow ageing rate is maintained through the rest of the pipe’s life.
Figure 4 illustrates the schematics of this ageing pattern.
0 2 4 6 8 10 0 20 40 60 80 100 120 Br ea ks / km Age (years)
No retrofit CP applied Post-retrofit slow
ageing phase Transition phase Retrofit pipe = 0.05 a' 1 = -0.20 N(t o) = 0.5 a" 2 = 0.015 a 1
Figure 4. Phases in breakage pattern when pipe is retrofitted at year 50.
Figure 5 shows how the multi-variate model, including retrofit CP, fits the observed historical breaks in 86 km of ductile iron mains, 6” (150 mm) to to 12” (300 mm) diameter, installed between 1970 and 1987 in a Southern Ontario water utility. The percentage of pipes retrofitted over the years was as follows.
1970-1983 1984 1985 1986 1987 1988 1989 1990 1991 1992 1993 1994 1995 1996 1997
0.0% 1.5% 3.7% 1.2% 5.2% 1.1% 4.2% 4.1% 6.2% 3.5% 2.3% 0.0% 0.7% 1.9% 0.0%
The effect of the retrofit CP program is clearly visible in the downturn of the multi-variate model in the mid 1980’s. The coefficient of determination for this regression is
0.00 0.10 0.20 0.30 0.40 0.50 0.60 0.70 0.80 1970 1975 1980 1985 1990 1995 2000 Year B rea ks /km
Figure 5. Effect of retrofit on ductile iron mains in Utility B.
Once the parameters of the model were determined, the impact of retrofit CP on the life cycle cost of pipes could be assessed as illustrated in Figure 6. The costs of pipe
replacement and breakage repair were taken, as in the previous example, $300 K/km and $5 K respectively. The cost of retrofitting the pipe with anodes was taken as $30 K per km, and the life expectancy of the anodes was assumed to be 15 years (thus retrofitting would be renewed every 15 years). The discount rate was taken as 3%.
In this case study, T* = 44 years represents the optimal time for replacement of an unprotected pipe, which would result in a discounted life-cycle cost of approximately $144 K/km. This early optimal time of replacement is due to the relatively rapid growth in breakage rate observed in the pre-retrofitted ductile iron pipes in Utility B. If retrofit CP commences at pipe installation, its optimal time of replacement to is expected to be deferred to later than 150 years, with a total life-cycle discounted cost of about $86 K/km. If retrofit CP commences at year 20, its optimal time of replacement to is also expected to be deferred to later than 150 years, with a total discounted life-cycle cost of $69 K/km. It appears that it is more economical to retrofit at age 20 rather than earlier because early retrofit results also in early cash disbursements. In some instances retrofitting at installation may be cheaper that retrofitting an existing pipe but this instance is not considered here.
50 100 150 200
20 40 60 80 100 120 140
Age at replacement (years)
D is c ount e d l if e -c y c le c os t ( K $ /k m ) Retrofit at age 70 yr Retrofit age 20 yr T* No retrofit Retrofit at age 60 yr Retrofit age 40 yr Retrofit on installation
Figure 6. Effect of retrofit CP on the life-cycle costs of pipes – Utility B.
It can also be seen that in Utility B, the effect of retrofit CP is so dramatic that if it commences much later than T* (e.g., at age 60) it will still help to extend the economic life of the pipe by deferring the optimal time of replacement.
Summary and discussion
Two separate models were introduced, one for the effect of hotspot cathodic protection and the other on the effect of retrofit cathodic protection on the breakage rate of water mains. The parameters for these models can be extracted for time series that include historical breakage rates of water mains. The accuracy of extracting these parameters can be improved by using a multi-variate model for the historical breakage rate, which allows the consideration of dependent covariates in the regression analysis. These time-dependent covariates may include factors such as temperature and soil moisture, which often have significant impact on water main breakage rates.
Once the parameters of the cathodic protection models are determined, an economic analysis can be performed to determine the strategy that would minimise the life-cycle cost of the pipes.
Two case studies have been presented to demonstrate the concept. In Utility A, hotspot CP emerged as an effective means to reduce life-cycle cost as well as to defer pipe replacement, provided the protection program does not start too late in the life of the pipe. In Utility B, retrofit cathodic protection proved to be very effective in reducing life-cycle costs and deferring pipe replacement.
It should be noted that the multi-variate model and the cathodic protection models assume that the population of pipes to which they are applied is relatively homogeneous with respect to breakage patterns. At the same time, it is often not practical to apply the analysis to very small, homogeneous groups because of the loss of statistical significance. One must always exercise good engineering judgement in balancing these two
considerations.
Further, one should be aware that some results could be biased because of various factors beyond one’s control. For example, some utilities have a strategy, thereby those pipes with the highest breakage rate are retrofitting first. Conversely, other utilities retrofit first those pipes which are in the best shape (pipe ‘worth’ saving). In either case, the
population of pipes should be separated into separate groups comprising ‘good’ pipes and ‘bad’ pipes, to conduct an unbiased regression analysis.
Acknowledgement
This research was supported by the water utilities of Halifax (NS), Gatineau (QC), Ottawa (ON), Peterborough (ON), Markham (ON), Toronto (ON), Niagara falls (ON), Hamilton-Wentworth (ON), Windsor (ON), Saskatoon (SK), Calgary (ALTA), Edmonton (EPCOR) (ALTA) and by CorrPro Inc. We wish to thank also the Regional Municipality of Durham, ON., for providing data.
References
Kleiner, Y., and Rajani, B.B. (2000). “Considering time-dependent factors in the statistical prediction of water main breaks.” Proc., American Water Works Association Infrastructure Conference, Baltimore. Rajani, B., and Zhan, C. (1996). “On the Estimation of Frost Load.” Canadian Geotechnical J., 33(4),
629-641.
Rajani, B., Zhan, C., and Kuraoka, S. (1996). “Pipe-soil Interaction Analysis for Jointed Water Mains.” Canadian Geotechnical J., 33(3), 393-404.