HAL Id: hal-01951720
https://hal.laas.fr/hal-01951720
Submitted on 11 Dec 2018
HAL is a multi-disciplinary open access
archive for the deposit and dissemination of
sci-entific research documents, whether they are
pub-lished or not. The documents may come from
teaching and research institutions in France or
abroad, or from public or private research centers.
L’archive ouverte pluridisciplinaire HAL, est
destinée au dépôt et à la diffusion de documents
scientifiques de niveau recherche, publiés ou non,
émanant des établissements d’enseignement et de
recherche français ou étrangers, des laboratoires
publics ou privés.
Double stub resonant biosensor for glucose
concentrations quantification of multiple aqueous
solutions
Thomas Chretiennot, David Dubuc, Katia Grenier
To cite this version:
Thomas Chretiennot, David Dubuc, Katia Grenier. Double stub resonant biosensor for glucose
con-centrations quantification of multiple aqueous solutions. IEEE MTT-S International Microwave
Sym-posium (IMS2014), Jun 2014, Tampa, United States. �hal-01951720�
Double stub resonant biosensor for glucose concentrations
quantification of multiple aqueous solutions
Thomas Chretiennot
1,2, David Dubuc
1,2and Katia Grenier
1,21
CNRS, LAAS, 7 avenue du colonel Roche, F-31400 Toulouse, France
2
Univ de Toulouse, UPS, LAAS, F-31400, Toulouse, France
Abstract — This paper presents a miniature double-stub resonant-biosensor and associated technique to quantify the glucose concentrations of two aqueous solutions localized over the sensing area of each stub. A specific procedure and the behavior of the sensor have been developed, calibrated and validated experimentally. Seven blind filling configurations have been characterized for glucose concentrations ranging from 15 to 80 mg/L and our technique predicts the glucose concentration in each channel with a root-mean-square error of 3.2 g/L. Such a level of accuracy is the tolerance range for commercial glucometer, which outlines that the microwave technique can be used for accurate glucose analysis of multiple aqueous solutions.
Index Terms — Resonators, biosensor, multichannels, microstrip, liquids, glucose.
I. INTRODUCTION
Medical diagnostics mainly rely on the dosing of chemical species in aqueous solutions. For instance, anemia monitoring is based on the measurement of iron concentration in blood ; immunologists quantify the reaction of human body against infections by dosing leukocytes in a blood sample, and diabetes monitoring requires the measurement of glucose concentration in blood.
Such examples show the numerous needs in term of fluid dosing for medical applications. Techniques rely on chemical dosing, which are said destructive in a sense that the chemical under investigation is not dosed directly. A further chemical reaction involving the species is used and enables to set photometric dosing on a colored product of the reaction or amperometric dosing if an electron exchange is at stake. For instance, glycaemia determination requires a reduction-oxidation reaction between glucose and an oxidizing agent [1].
These chemical techniques for fluid dosing have demonstrated high accuracy and strong reliability [1]. Yet, destructivity limits these techniques to a single measurement on each liquid sample. RF and microwave techniques offer here an interesting improvement. Indeed, unlike chemical dosings, RF and microwave techniques are non-destructive.
Thus, RF and microwave techniques constitute a complementary way to the measurement of bio liquids. The numerous dielectric characterization methods that have been already developed on fluids [2]-[3] can be extended to bio liquids in order to investigate their electrical properties. RF
and microwave biosensors have consequently been proposed [4]-[7], notably for glucose concentration measurements [8]. These devices capitalize on the non-destructivity of the measurement principle to submit new biosensors with innovative features, which for instance enables simultaneous characterizations of several liquid’s samples [8]-[10].
This paper presents a microwave and microfluidic biosensor able to simultaneously quantify the concentration of glucose in two aqueous samples. We demonstrate a level of accuracy in accordance with glucose sensor requirements. Next section presents the architecture of the sensor. Section 3 presents the simulated and experimental results as well as the post-processing procedure to extract the glucose concentrations. Final section discusses the accuracy of the results regarding glucose sensor requirements.
II. DOUBLE STUB RESONANT MICROFLUIDIC SENSOR
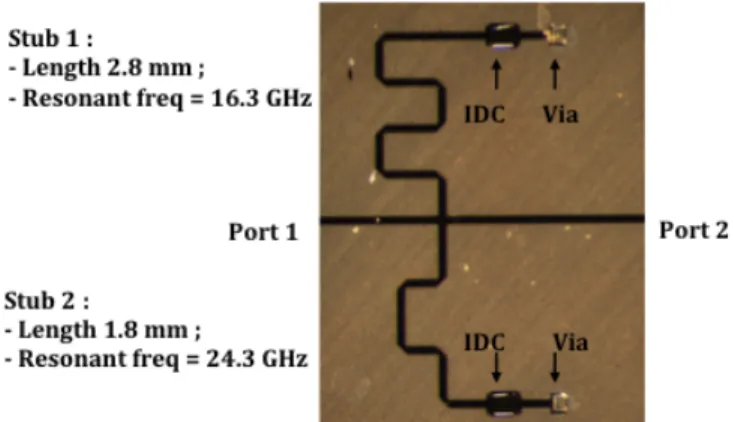
The structure is constituted by two parallel stubs ended by a connected-to-ground InterDigitated Capacitor (IDC), as illustrated in Fig. 1. The stubs are integrated in thin microstrip technology with gold metallization.
Fig. 1. Photograph of the thin film microstrip double stub sensor.
Each stub features a specific length (1.8 and 2.8 mm) and then a related resonant frequency (24.3 and 16.3 GHz). The two IDCs, which correspond to the sensing areas, are equipped by a microfluidic channel in charge of the conveying
of the fluid in interaction with the electromagnetic fields (see Fig. 2).
Fig. 2. Microfluidic channel located over the two IDCs.
Microfluidic channels are implemented in PDMS and connected to a syringe with appropriate millimeter-sized tubes.
III. RESULTS AND DATA PROCESSING
The structure is measured on wafer. First measurement is performed when the two channels are empty and S21 in dB is presented in Fig. 3, which also includes simulation obtained with HFSS software.
Fig. 3. Measured and simulated transmission parameter in dB of the double resonant structure.
The two resonant frequencies of the two stubs can be clearly distinguished in Fig. 3: 16.3 GHz, which corresponds to the resonance of stub 1 and 24.3 GHz for stub 2. This result could suggest that the monitoring of the two resonant frequencies could simply give access to the corresponding fluid. Nevertheless, when the channels are filled, the high losses due to aqueous solutions cancel both resonant phenomena and further data processing is consequently required.
The proposed data processing is the following.
1. Injection of water in both channels and measurement of the corresponding S21 parameter, which becomes the reference: S21ref.
2. Injection of the liquid under test in both channels, measurement of the corresponding S21 parameter and normalization with the reference:
S21N=S21/S21ref (1)
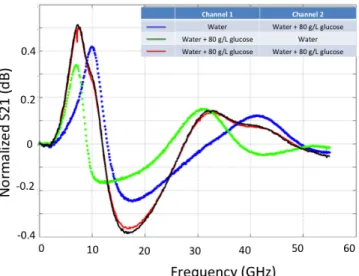
Fig. 4 presents the S21N parameter versus frequency for three filling configurations:
1. (channel 1, channel 2)=(Water,Water +80 g/L glucose)
→S21W,G
2. (channel 1, channel 2)=(Water +80 g/L glucose, Water) →S21G,W
3. (channel 1, channel 2)=(Water +80 g/L glucose, Water +80 g/L glucose) →S21G,G.
Fig. 4. Normalized to water/water configuration of the measured transmission parameter in dB versus frequency, for various fluid filling configurations.
Specific spectral signature can be clearly identified for each filling configuration. This means that each channel brings its own and complementary contribution to the spectral signature. Moreover, we have proved that the red curves can be deduced from the sum of the blue and green curves, which is illustrated in black in the Fig. 4. This shows that the superposition principle may be applied:
S21G,G= S21W,G+ S21G,W (2)
Finally, we have also demonstrated that doubling the glucose concentration translates into a doubling of S21N. This shows that the approach is linear:
S21W,80% G=2× S21W,40% G (3)
where S21W,X% G corresponds to the configuration : (channel 1, channel 2)=(Water,Water +X g/L glucose).
We exploit these two principles to deduce the glucose concentrations of blind aqueous solutions under investigation.
S2 1$(dB )$ Frequency$(GHz)$ 0$ 510$ 520$ 0$ 10$ 20$ 30$ 40$ Measurement$ Simula?on$ Resonant$frequency$$
For that, we need preliminary characterization of two known filling configurations:
1. (channel 1, channel 2)=(Water,Water +80 g/L glucose) 2. (channel 1, channel 2)=(Water +80 g/L glucose, Water) Then we deduce the two blind glucose concentrations through the regression of :
S21G1,G2= G1/80×S2180% G,w + G2/80×S21w,80% (4) in order to determine both G1 and G2 : the two glucose concentrations in channels 1 and 2 respectively.
IV. PERFORMANCES AND DISCUSSIONS
We performed such an investigation for 7 filling configurations for glucose concentrations ranging from 15 to 80 mg/L. Results are summarized in Table I. It includes the real glucose concentrations employed in channels 1 and 2, as well as the extracted concentrations in both channels after the application of the procedure described above.
Table I. Real and extracted glucose concentrations in both channels for 7 filling configurations.
Qualitatively, the extracted glucose concentrations in each channel are quite close from the real ones with a root-mean-square error of 3.2 g/L.
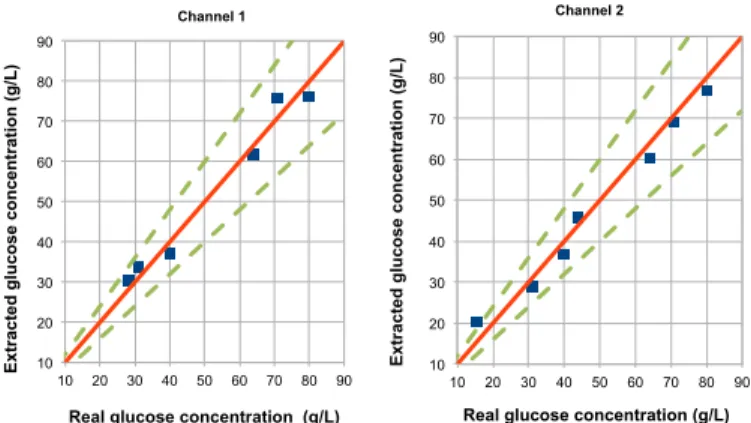
In order to evaluate the sensor reliability, measured glucose concentrations are plotted using the Clarke error grid. The Clarke error grid has been worked out in 1987 by the so-called biologist Clarke in order to evaluate the reliability of the commercial glucometers [12]. This chart is classically used with glucose concentration measurements in serum or even in blood, it can nevertheless point out the potential of emerging techniques even for well-controlled bio-samples of glucose in DI water.
The Clarke error grid with our measurements is given in Fig. 5. X-axis provides the real glucose concentrations, whereas Y-axis provides the measured glucose concentrations. The ideal characteristic, in red in Fig. 5, corresponds to identity line, whereas the two green dashed lines correspond to the tolerance range of deviation of +/- 20%.
Fig. 5. Extracted glucose concentration for both channels versus real glucose concentration.
One can see that all the measured configurations are in the tolerance range, which, in complement to the low root-mean-square deviation, demonstrates that the technique for the simultaneous glucose concentration quantification of multiple aqueous solutions is achieved with high accuracy.
V. CONCLUSIONS
This paper presents a miniature double-stub resonant-biosensor able to quantify the glucose concentrations of two different aqueous solutions. A specific procedure has been developed, calibrated and validated experimentally and features a high level of accuracy, as extracted glucose concentrations feature a root-mean-square error of only 3.2 g/L for glucose concentrations ranging from 15 to 80 mg/L.
These results outline that microwave technique can be used for non-destructive, accurate and parallelizable glucose analysis.
REFERENCES
[1] J. Hönes, P. Müller and N. Surridge, “The technology behind glucose meters : test strips”, Diabetes Technology & Therapeutics, vol. 10, 2008.
[2] National Physical Laboratory, “A guide to characterization of dielectric materials at RF and microwave frequencies”, London, 2003.
[3] T.P. Marsland and S. Evans, “Dielectric measurements with an open-ended coaxial probe”, IEEE Proceedings, vol. 34 , n° 4, pp. 341-349, 1987.
[4] B. Kapilevich and B. Litvak, “Microwave sensor for accurate measurements of water solution concentrations”, Asia-Pacific
Microwave Conference, 2007.
[5] L. Li and D. Uttamchandani, “A microwave dielectric biosensor based on suspended distributed MEMS transmission lines”, IEEE
Sensors Journal, vol. 9, n° 12, 2009.
[6] G. Gennarelli, S. Romeo, M. Rosaria Scarfi and F. Soldovieri, “A microwave resonant sensor for concentration measurements of liquid solutions”, IEEE Sensors Journal, vol. 13, n° 5, 2013.
[7] H.J. Lee et J.G. Yook, "Biosensing using split-ring resonators at microwave regime", Applied Physics Letters, vol. 92, 2008
Real%Glucose% concentra.on%in%g/L% in%channel%1% Real%Glucose% concentra.on%in%g/L% in%channel%2% Extracted%Glucose% concentra.on%in%g/L% in%channel%1% Extracted%Glucose% concentra.on%in%g/L% in%channel%2% 40% 40% 36.8% 36.8% 80% 80% 76.3% 76.8% 28% 15% 30.4% 20.4% 31% 44% 33.8% 46% 64% 31% 62% 29% 40% 71% 37.3% 69% 71% 64% 76% 60.2% 10 20 30 40 50 60 70 80 90 10 20 30 40 50 60 70 80 90 Ex tr ac te d g lu co se c o n ce n tr ati o n (g /L )
Real glucose concentration (g/L)
Channel 1 10 20 30 40 50 60 70 80 90 10 20 30 40 50 60 70 80 90 Ex tr ac te d g lu co se c o n ce n tr ati o n (g /L )
Real glucose concentration (g/L)
[8] M. Hofmann, G. Fischer, R. Weigel, D. Kissinger, “Microwave-Based Noninvasive Concentration Measurements for Biomedical Applications”, IEEE-Trans. on MTT Vol. 61, N°5, May 2013, pp. 2195-2204.
[9] W. Withayachumnankul, K. Jaruwongrungsee, C. Fumeaux et D. Abbott, "Metamaterial-inspired multichannel thin-film sensor", IEEE Sensors Journal, vol. 12, n°5, mai 2012
[10] M. Puentes, C. Weiss, M. Schüssler et R. Jakoby, "Sensor array based on split ring resonators for analysis of organic tissues", International Microwave Symposium, 2011
[11] M. Puentes, M. Maasch, M. Schüssler et R. Jakoby, "Frequency multiplexed 2-dimensional sensor array based on split-ring resonators for organic tissue analysis", IEEE Transactions on Microwave Theory and Techniques, vol. 60, n°6, juin 2012
[12] W.L. Clarke, D. Cox, L.A. Gonder-Frederick, W. Carter and S.L. Pohl, “Evaluating clinical accuracy of systems for self-monitoring of blood glucose”, Diabetes Care, vol. 10, n° 5, pp. 622-628, 1987.