Characterization of an Iodine-Based Ionic Liquid
Ion Source and Studies on Ion Fragmentation
by
Timothy Peter Fedkiw
Submitted to the Department of Aeronautics and Astronautics
in partial fulfillment of the requirements for the degree of
Master of Science
at the
MASSACHUSETTS INSTITUTE OF TECHNOLOGY
August 2010
@
Massachusetts Institute of Technology 2010. All rights reserved.
(r7
Author ...
. . . . .,V . . - . . . .Department of Aeronautics and Astronautics
August 19, 2010
Certified by...
Paulo Lozano
Associate Professor
Thesis Supervisor
/I/
Accepted by ...
Associate Professor of
. . . . . ..Eytan H. Modiano
A ronautics and Astronautics
Chair, Graduate Program Committee
MASSACHUF [T
OC
V.
LK
t
Characterization of an Iodine-Based Ionic Liquid Ion Source
and Studies on Ion Fragmentation
by
Timothy Peter Fedkiw
Submitted to the Department of Aeronautics and Astronautics on August 19, 2010, in partial fulfillment of the
requirements for the degree of Master of Science
Abstract
Electrosprays are a well studied source of charged droplets and ions. A specific subclass is the ionic liquid ion source (ILIS), which produce ion beams from the electrostatically stressed meniscus of ionic liquids. ILIS have several applications, two of which include space propulsion and focused ion beam technologies.
An ILIS using the 1-butyl-3-methylimidazolium iodide (BMI-I) is characterized with a focus on those properties that would impact its performance in a focused ion beam (FIB) system. The currents obtained in the negative mode from this ILIS are on the order of 100 nA, and composed of nearly 50% pure iodine ions with the remainder composed of solvated ions. The energy deficit of the ion beam is seen to be on the order of 15 eV, with full width at half maximum of about 12 eV. The angular intensity is estimated to be 0.65 tA sr-1.
The energy signal from the BMI-I ILIS contained several features that suggested a significant amount of ion fragmentation in the acceleration region. This prompted a secondary study using the the ionic liquid 1-methyl-3-methylimidazolium tetrafluo-roborate (EMI-BF4). The amount of fragmentation was seen to be up to 25% of the
ion beam. The impact of such fragmentation on the performance of an ILIS thruster is examined. The effects are integrated into the definition of the polydispersive ef-ficiency by characterizing the fragmentation products as two discrete populations of ions and neutrals. This adjusted polydispersive efficiency is seen to be about 88%, about 6% lower than values not taking into account the fragmentation.
Thesis Supervisor: Paulo Lozano Title: Associate Professor
Acknowledgments
I would like to thank Professor Paulo Lozano for providing me with this opportunity,
as well for his support and instruction. His experience and knowledge have been a great help for my work.
I would also like to acknowledge my funding, particularly the Department of
Aero-nautics and AstroAero-nautics and the Department of Defense (DoD) through the National Defense Science Engineering Graduate Fellowship (NDSEG) Program.
Thank you to my fellow graduate students in the Space Propulsion Lab. Your help with experimental equipment and suggestions were invaluable.
Finally I would like to thank my parents, Sharon and Peter. Their support and encouragement of my education throughout my life ensured that I was well prepared to continue to a graduate level.
Contents
1 Introduction
13
1.1 Electrospray Basics . . . . 13
1.2 Ionic Liquids . . . . 14
1.3 The Prototypical Ionic Liquid Ion Source . . . . 15
2 Electrospray Physics and Applications 17 2.1 Electrospray Physics . . . . 17
2.1.1 Taylor Cone Formation . . . . 17
2.1.2 Current Emission in the Cone-Jet Regime . . . . 18
2.1.3 Field Evaporation of Ions . . . . 19
2.2 Electrospray Applications . . . . 20
2.2.1 Space Propulsion . . . . 20
2.2.2 Focused Ion Beam Applications . . . . 22
3 Experimental Techniques
25
3.1 Ion Source .. ... ... . .... ... 253.2 Time of Flight Mass Spectrometry . . . . 27
3.3 Retarding Potential Analyzer . . . . 30
3.4 Vacuum Chamber and Electronics . . . . 33
4 Development of an Iodine ILIS
35
4.1 M otivation . . . . 354.2.1 Beam Composition . . . ... 4.2.2 Energy distribution . . . ... 4.3 Estimated Performance in a FIB Column . . . ...
5 Full Beam Measurements
5.1 Full Beam Time of Flight . . . ...
5.2 Full Beam Retarding Potential Analyzer . . . ...
6 Ion Fragmentation
6.1 Signs of Fragmented Ions . . . 6.2 Causes . . . .
6.2.1 Collisions . . . .
6.2.2 Internal Energy . . . .
6.3 Effects of Ion Fragmentation .
6.3.1 Performance of an ILIS
6.3.2 FIB . . . .
7 Conclusions and Future Work 7.1 BMI-I ILIS . . . . 7.2 Ion Fragmentation . . . . . .. .. .. .. ... . .. .. .. .. ... . .. .. .. .. ... . .. .. .. .. ... . . . . . . . . . . . .
Based Thruster
...
. . . .
. .
.
..
.
. . . .
. .
.
.
.
.
.
. . . .
. .
.
.
.
.
.
List of Figures
1-1 The configuration of a basic capillary electrospray source. . . . . 14
1-2 The configuration of a basic ionic liquid ion source. . . . . 15
2-1 Diagram of a Taylor cone . . . . . ... . . . . 18
2-2 Simplified FIB column . . . . 23
3-1 Scanning electron microscope image of an emitter tip . . . . 26
3-2 ILIS assembly with a copper block for temperature control . . . . 26
3-3 ILIS assembly using polyethylene blocks . . . . 27
3-4 Schematic view of the interleaved comb-type ion gate . . . . 28
3-5 Example TOF-MS Signal for an ILIS with two ion species . . . . 29
3-6 Schematic of the TOF-MS setup . . . . 29
3-7 Sample RPA output for a monoenergetic source . . . . 31
3-8 Sample RPA output for a nonideal source . . . . 31
3-9 Schematic of the RPA setup... . . . . . . . . 32
3-10 Vacuum chamber . . . . 33
4-1 Current emitted from a BMI-I ILIS in the negative mode . . . . 37
4-2 TOF-MS signals for a BMI-I ILIS operating at several different conditions 38 4-3 Mass spectra for a BMI-I ILIS operating at (a) -1900 V and (b) 1900 V 40 4-4 RPA energy spectra results for applied voltages of -1.5, -1.6, and -1.7 kV 41 4-5 RPA energy spectrum results for applied voltages of -1.5 kV . . . . . 42
4-6 Estimated angular intensity for a BMI-I ILIS . . . . 43
5-2 Full beam TOF collector assembly . . . . 47
5-3 Schematic of the full beam TOF assembly . . . . 48
5-4 Non-inverting amplifier with a shunt resistor... . . . .. 49
5-5 Full beam TOF output with the original amplifier . . . . 50
5-6 Transimpedance amplifier . . . . 51
5-7 Optional caption for list of figures . . . . 52
5-8 Schematic of the full beam RPA assembly . . . . 53
5-9 Output of the full beam RPA with an EMI-BF4 ILIS operating at -1650V 54 5-10 Idealized energy distribution for an EMI-BF4 ILIS . . . . 55
5-11 Effect of beam divergence on an RPA current signal for an EMI-BF4 IL IS . . . . 55
6-1 RPA energy spectrum and current signal for a BMI-I ILIS operating at -1.5kV . . . . 58
6-2 Mean free path of non-solvated ions in an EMI-BF4 ILIS at 1500V . . 60
6-3 Effect of ion fragmentation on the polydispersive efficiency for an EMI-BF4 ILIS operating in the positive mode . . . . 63
A-1 Full beam TOF front plate . . . . 67
A-2 Full beam TOF secondary electron grid . . . . 68
A-3 Full beam TOF collector . . . . 68
List of Tables
1.1 Properties of Selected Electrospray Source Media . . . . 15
3.1 Electronic equipment . . . . 34
4.1 Expected flight times for a BMI-I ILIS operating at +/- 2kV . . . . . 39
Chapter 1
Introduction
1.1
Electrospray Basics
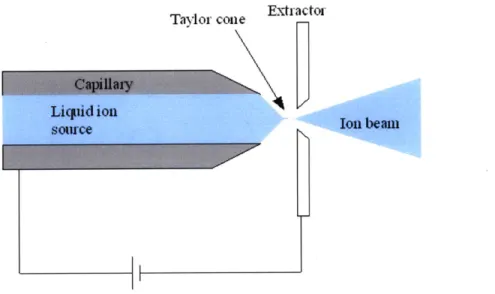
Electrospray has been studied as a source of charged particles for applications ranging from materials analysis to space propulsion. The basic electrospray configuration is composed of a capillary tube filled with a conducting fluid facing an electrode plate, as shown in Fig. 1-1. Briefly, the source is operated by applying a voltage difference between the extractor plate and the capillary. The strong electric field at the liquid-insulator (commonly air or vacuum) interface causes the meniscus to deform into a conical shape, referred to as a Taylor cone after G.I. Taylor [21]. At the tip of the cone, the electric field is intense enough to cause the emission of ions or charged droplets, which are then free to accelerate to the extractor electrode. A more detailed description of the physics of an electrospray source is contained in Chapter 2.
The conducting fluid used in the electrospray source can be of several different varieties. Some commonly used liquids are doped solvents, liquid metals, and ionic liquids. In addition to the previously mentioned capillary tube emitters, externally wetted emitters can be used. In this configuration the liquid coats an electrochemi-cally sharpened metallic (usually tungsten) needle. Capillary and electric forces cause the liquid to flow to the sharp tip, where the Taylor cone formation can occur. This thesis is concerned with the use of ionic liquids as the source media for an electrospray using an externally wetted emitter.
Taylor cone Extractor
Liquid ion V Inba
souce Inbe
Figure 1-1: The configuration of a basic capillary electrospray source.
1.2
Ionic Liquids
Ionic liquids (ILs) are a type of salt that are in the liquid state at room temperature (sometimes specifically referred to as room temperature ionic liquids)[19]. Being a salt, these ILs are composed purely of positive and negative ions, with no solvent.
Many ionic liquids have properties that make them an attractive choice for the use in an electrospray. Specifically, it is common for these ILs to have conductivities on the order of 1 S/m at room temperature and have negligible vapor pressures, which makes them ideal candidates for an externally wetted electrospray source operating in vacuum. The two ILs addressed in this thesis are 1-ethyl-3-methylimidazolium
tetrafluoroborate ([C2-mim][BF4] or EMI-BF4) and 1-butyl-3-methylimidazolium
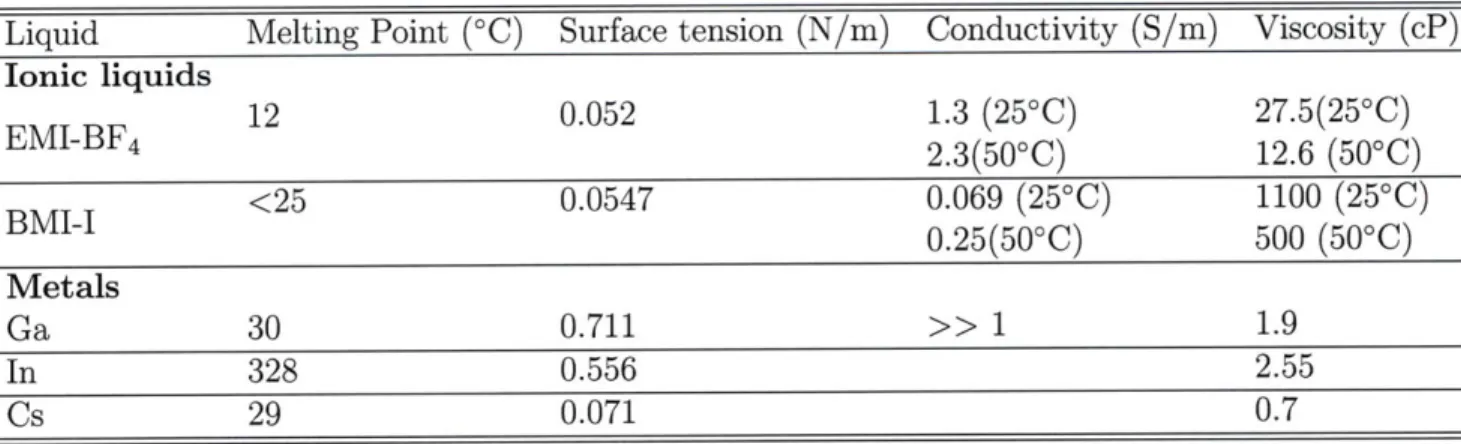
io-dide ([C4-mim][I] or BMI-I). Properties of these two ionic liquids are listed in Table
1.1 along with several other liquid ion sources. Notice the very large viscosity and
low conductivity of BMI-I as compared to the other liquids. The ability to obtain significant currents from this liquid is something that does not mesh with current theories regarding the behavior of electrically stressed ionic liquids [10].
Liquid
Melting Point (
0C) Surface tension (N/m) Conductivity (S/m) Viscosity (cP)
Ionic liquidsEMJ-BF
412
0.052
1.3 (25
0C)
27.5(25
0C)
2.3(50
0C)
12.6 (50
0C)
BMI-J
<25
0.0547
0.069 (25
0C)
1100 (25
0C)
0.25(50
0C)
500 (50
0C)
MetalsGa
30
0.711
>> 1
1.9
In
328
0.556
2.55
Cs
29
0.071
0.7
Table 1.1: Properties of Selected Electrospray Source Media
1.3
The Prototypical Ionic Liquid Ion Source
When an ionic liquid is used as the source media for an electrospray device and
oper-ated in a purely ionic mode, it can be referred to as an Ionic Liquid Ion Source (ILIS).
The basic ILIS consists of an externally wetted needle emitter (normally fabricated
from tungsten) coated with the ionic liquid. A high voltage is applied between the
needle and a planar electrode with an aperture in it, referred to as the extractor.
This causes charged particles to emit from the tip, and pass through the extractor. A
diagram of this setup is shown in Fig. 1-2. The extracted ion beam is then able to be
used for whatever application is required. It may be used in some sort of diagnostic
equipment for characterization (Ch. 3 and Ch. 5), some propulsive application (Sec.
2.2.1), a focused ion beam application (Sec 2.2.2), or some other application.
Figure 1-2: The configuration of a basic ionic liquid ion source.
.. ... . -_V- I- -=-W '_' --- ., - -- ... ...Chapter 2
Electrospray Physics and
Applications
2.1
Electrospray Physics
2.1.1
Taylor Cone Formation
When the meniscus of an electrically conductive liquid is subject to a strong electric field, the liquid surface becomes unstable and forms into a conical shape called a Taylor cone, as shown in Fig. 2-1. Details of the processes behind the formation of this feature can be found elsewhere [7, 21]. A simplified analysis of this structure can be performed if it is assumed to be static. In this case, the electrostatic traction must balance the surface tension at all points along the cone, given by
1
22-1 oE = (2.1)
where E, is the normal component of the electric field, -y is the surface tension of the liquid, and Rc is the radius of curvature of the liquid surface, which is related to the distance from the tip by Rc = r cot aO. The conducting liquid surface is assumed static, and therefore an equipotential. The general solution to the Laplace equation in spherical coordinates for this geometry, assuming axial symmetry, is
00
4(r, 0) = Zr'Pi(cos 0) (2.2)
1=0
where P is the Legendre function of order 1. However, the restriction of Eq. 2.1
requires that the electric field at the cone surface to be proportional to r-, therefore
the potential must be proportional to
r.For the cone surface at 6
=
1800
-a to be
an equipotential, P1i(cos(1800 - aT)) must be zero. This requires 1800 - aT = 130.70,
resulting in the half angle of the Taylor cone being aT = 49.3'.
Elecho4atic Pressurfe E
Siuface Tension 2
Figure 2-1: Diagram of a Taylor cone
However, in this model of a perfectly conical surface, the electric field will approach
infinity as r goes to zero due to the r-2 dependence. This is obviously a nonphysical
solution, and something must break down. There are several possibilities for what
occurs near the tip, two of which are the cone-jet mode, discussed in Sec. 2.1.2, and
ion evaporation, discussed in Sec. 2.1.3.
2.1.2
Current Emission in the Cone-Jet Regime
In the region near the tip, the electric field becomes strong enough to overcome the
liquid surface tension, and the static approximation breaks down. The details of
what happens near the tip depend upon the exact operating parameters, but one
possibility is called the cone-jet mode, which is characterized by the formation of a
jet extending from the tip of the cone. This jet breaks up into droplets, which then
form the spray of charged particles. This cone-jet is perhaps the most studied of electrospray modes, with a large amount of literature focused on the regime [7, 2, 6]. The current produced in this regime has been found to depend on the flow rate
Q,
as well as the liquid's surface tension -y, conductivity K, and permittivity E,f E)-KQ) 1/2(23
(E
The size of the jet at the tip of the Taylor cone has been seen to decrease in size as the conductivity of the liquid increases. When the conductivity of the liquid is high enough, it is possible for the cone to operate in a purely ionic regime, as seen with liquid metals [17] and certain ionic liquids [7, 14].
2.1.3
Field Evaporation of Ions
In an electrospray source with a high conductivity liquid source, such as a liquid metal or certain ionic liquids, it is possible for the tip of the Taylor cone to develop electric fields strong enough to cause the direct evaporation of ions. The current emitted in this manner can be characterized by Schottky's field-enhanced thermionic emission relation,
j = EoEnk e_ ( \T /G- (2.4)
h
where
j
is the current density, 6o is the permittivity of free space, k is the Boltzmann constant, T is the liquid temperature, h is Planck's constant, q is the ion charge, G is the solvation energy of the bound ion, and E, is the electric field normal to the liquid surface. Copious ion emission will occur when the electric field satisfies the condition47reoG'0
E, >
q3 (2.5)Typical values of G fall in the range of 1-3 eV [15], meaning that for extraction of singly charged ions, the electric field needs to approach 1 V/nm.
2.2
Electrospray Applications
2.2.1
Space Propulsion
Electrosprays have found applications in space propulsion in several different forms. Field Emission Electric Propulsion (FEEP) thrusters use an ion beam produced from an electrospray from a liquid metal (the previously mentioned LMIS). Colloid thrusters use a capillary source to spray droplets of ionic liquids or doped solvents [8]. Finally, ILIS based thrusters are being actively developed. ILIS sources can generally provide on the order of up to 1 pA and 0.1 pLN per emitter. Therefore, current re-search into ILIS thrusters has been focusing on microfabrication of very dense arrays of emitters, in order to achieve higher thrust densities [4, 3, 12]. With these types of arrays, it is possible to approach thrust densities on a level with conventional ion engines [12].
An ILIS based thruster offers several attractive advantages as a means of space propulsion. The ionic liquid is composed of both positive and negative ions, which allows for the extraction of either type. This means that it is possible to simulta-neously operate one ILIS in the positive mode and another in the negative mode in order to maintain electrical neutrality, eliminating the need for an external cathode neutralizer. They have been demonstrated to be operated with a variable specific impulse [4, 20], which would allow for flexible mission design. The propellant feed system for these thruster can be greatly simplified by using a porous substrate to fabricate the tips, and relying on capillary flow to move the liquid to the emitters [3]. Finally, the ILIS thrusters are able to operate at high thrust efficiencies, estimated to be up to 85%.
The details of the efficiency have been examined elsewhere [13], but are briefly mentioned here. The definition of thrust efficiency, r, is the thrust power divided
by the supplied electric power
PT !F F2/mh
rT - P/- (2.6)
where F is the thrust, rh is the mass flow rate, I is the power supply current and Vo is the power supply voltage. The expression for the efficiency in Eq. 2.6 can be modified
by defining several other terms. The ionization efficiency, qjj, is defined to be the mass
fraction of ions emitted over the total mass flow rate (ions and neutrals). Ionic liquids have extremely low vapor pressure, so the neutral flux is almost zero, meaning Th ~~ 1. The transmission efficiency, 7tr, is defined as the mass ratio of ions leaving the device and producing thrust to the ions being emitted from the liquid. This term is less than one if any of the ions hit the extraction electrode on the way out. By properly aligning the emitter and extractor electrodes, the intercepted current can be reduced to below 1%, giving transmission efficiencies of lt, > 99%. The ions emitted from an ILIS will have some angular distribution,
f(0),
about the axis. Previous studies have shown that the distributions can be approximated by a quadratic function given byEq. 2.7 [13, 14].
f(2)
=[1
-- (0/60)2] (2.7)Only the portion of momentum from these particles that is directed along the axis will contribute to thrust, which is expressed through the angular efficiency. The angular efficiency qo is
00
27o =
0f (0) cos(0)
d6
(2.8)
where 0 is the beam envelope. For a typical ILIS divergence angle of about 200, Eq. 2.8 gives
ro
~ 0.98, and for a less ideal case of 42' divergence the efficiency is still relatively high at 7o ~ 0.90. The energy efficiency, 7)E, takes into account thecon-version of electrical power into kinetic energy of the particles, and for ILIS thrusters it is generally very high, approximately 71E 0.98 [13]. The final contribution to
the efficiency is the polydispersive efficiency, 77u, which takes into account the energy wasted accelerating charged particles of different specific charges. An ILIS operating in the purely ionic regime will have ion species of the form A+(AB), or B-(AB)" where n is the degree of solvation. For many ionic liquids, the n = 0 and n = 1 ions
will dominate the emitted beam. For this case of two ionic species, the polydispersive efficiency can be expressed as
[1( fo] (2.9)
1 -(1 -)
fo
where ( and fo are the specific charge ratio and the current fraction of non-solvated ions in the beam,
-(q/m)1 _ Io
and
fo
= 10(2.10) (q/m)o a o + I1The polydispersive efficiency tends to be the most limiting factor in the efficiency of an ILIS thruster, but still be relatively high. For example, an EMI-BF4 ILIS will
typically produce an ion beam composed of approximately 50% pure ion and 50% singly solvated (n = 1) ion, with masses of 111.2 amu and 309.1 amu, respectively.
With these values, Eq. 2.9 gives the polydispersive efficiency to be , = 0.94.
The total efficiency is expressed in terms of the individual efficiencies as
7T- 2 (2.11)
77T= Oi7tr?7077E?7P
and for an ILIS can have values greater than 80%. This particular expression for the efficiency fails to take into account the effects of ion fragmentation, which is discussed in Ch. 6.
2.2.2
Focused Ion Beam Applications
Liquid metal ion sources, in particular the gallium LMIS, have been used extensively in the field of focused ion beams (FIB) [17]. FIB technology uses an ion beam focused to sub-micrometer dimensions to either examine or modify the surface of a target material. Applications include milling, material deposition, microscopy, and others
[17, 9]. A basic FIB setup, as shown in Fig. 2-2 will have an ion source (typically a
LMIS), some beam defining aperture, a lens to focus the beam, a method of deflecting the beam, and then the target. More practical systems often include multiple lenses,
filters, and more aberration corrections. As mentioned previously, the operations of an ILIS is very similar to that of an LMIS. For this reason, ionic liquid ion sources have been proposed to be used in FIB applications [24, 23, 18]. ILIS have several properties that make them very attractive for FIB applications, including low starting voltages, room temperature operation, and perhaps most importantly, the hundreds of available ionic liquids. Initial studies into using ILIS in FIB have been promising, and it is still an ongoing research subject.
Extractor
W
Einzel Lens
Target
Deflection
Aperture Assembly
Figure 2-2: Simplified FIB column
One of the figures of merit of the performance of a focused ion beam system is the beam probe size (the size of the focused ion beam on the target). To be useful for FIB applications, the ion beam must be focusable down to micron or sub-micron levels
[17]. There are many parameters that can affect the quality of the beam probe, but in
general they can be split between properties of the ion source, and properties of the FIB system. The important parameters of the ion source are the angular intensity, the relative energy spread, and the source size. The angular intensity is defined to be the current per unit solid angle, dI/dQ, and can be related to the beam current
by I =
f
- dQ. In a FIB column, the aperture angle ao is normally small, meaningthe angular intensity can be approximated as a constant, and the current is obtained from
dI dI 2dI
I = AQI 27(1 - cos ao) ~ad . (2.12)
dQ
dQ
dQ'
The energy spread of the ion beam is characterized by the full width at half
maximum of its energy spectrum, AWi/2. The size of the source, D, may be on the
order of nm, and the FIB optics may act to magnify or demagnify this.
The parameters of the FIB optics are the spherical aberration, Cs, the chromatic aberration, Cc, and the magnification, M. Each of these terms will contribute to the spot size of the focused ion beam. The contribution of the magnification is simply to magnify the source size, giving an effective spot size of
d9 = MD (2.13)
The spherical aberration causes particles farther from the central axis to be focused more strongly than those that are closer. The effect of this term is that a point source will focus to a disc, rather than a point, with the size being given by
13
ds = -aOZ Cs (2.14)
2
The chromatic aberration causes ions of differing energies to be focused onto different spots along the optical axis, with the minimum size of the focused spot being
AW
1
/
2
de = aoCc . (2.15)
W
The combined effects of these effects on the focused spot size can be combined by summing in quadrature, to give
d2
=d
+d2 +d2
(2.16)which can be expressed in terms of the beam current and brightness by using Eq. 2.12
d2
7M3
(
)]
+
1/2
cW2+ M
2D
2(2.17)
Chapter 3
Experimental Techniques
In order to characterize an ILIS device, several standard experimental techniques were employed. All of the described experimental setups described in this chapter were designed to be mounted on the Kimball Physics eV Parts system and then attached to a vacuum chamber flange, allowing for simple construction and alignment.
3.1
Ion Source
The ILIS used in all experiments described in this thesis is based on the externally wetted emitter design. The emitters were fabricated from a 0.5 mm DIA tungsten wire. The fabrication process is composed of several steps, based on the process described in Ref. [14]. The oxide layer on the wire is removed by an electrochemical etch in a 2 N NaOH solution using 5VAC for several seconds. The wire is then lowered into the solution by about 3 mm, and a 50 VDC etch is performed until the submerged portion of the wire is completely etched away. The needle tip is then shaped by etching under 15-25 VDC for 30-90 seconds. The surface of the emitter is then roughened by submerging it in a saturated solution of K3Fe(CN)6 in 1 N NaOH
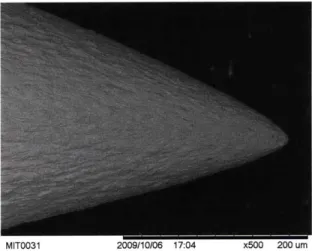
at 90 C. The resulting emitter has a roughened surface to promote wetting, and a tip radius on the order of 10 pm. An SEM image of an example tip can be seen in Fig.
3-1.
ar-Figure 3-1: Scanning electron microscope image of an emitter tip
rangement consists of attaching the needle to a copper block. The copper serves
as a point of electrical contact, as well as a heat sink. An electrical heater is
at-tached to the block, with the temperature monitored by a K-type thermocouple. The
block-emitter assembly is mounted on a 2-axis translational stage, which allows for
alignment with the 1.5 mm diameter hole in the stainless steel extractor plate. A
schematic of this setup is shown in Fig. 3-2. A tungsten crossbar is spot welded
to the emitter a few mm from the tip, in order to allow a place for a liquid droplet
reservoir to rest. Wetting is achieved by placing a drop of ionic liquid at the emitter
tip, and allowing it to fall to the crossbar.
Extactor
Cu
Ion beam
V
aFigure 3-2: ILIS assembly with a copper block for temperature control
The second ILIS configuration consists of two polyethylene (PE) blocks. The first
block has a small hole in the center, which allows an emitter to be held by a friction fit.
The second block has a stainless steel cylinder in the center, which holds a reservoir of ionic liquid. The extractor plate is placed after the second block. Alignment of all of the parts is ensured by mounting on alumina rods. Wetting of the emitter is performed by placing it into the first PE block, then sliding the emitter through the cylinder full of liquid in the second block.
PE Blockl Extractor
. ... --. 5 .' Ion bean
SS Cylinder
a
Figure 3-3: ILIS assembly using polyethylene blocks
The current passing through the emitter in either of these configurations is mon-itored by using a multimeter to monitor the voltage drop across a 1OOkQ resistor.
3.2
Time of Flight Mass Spectrometry
A charged particle of mass m and charge q accelerated through a potential, 'a will
have a kinetic energy given by
1
-mv 2 = qga. (3.1)
2
Thus, for a beam of charged particles of unknown specific charge, accelerated through the known potential, the velocity will allow for the determination of the value of q/m. The velocity is determined by measuring the time, t, it takes for a particle to travel a known flight distance, L. The time is determined by gating the ion beam, and measuring the time it takes for the beam front to reach a collector plate. The gating is performed by an interleaved comb-type gate (also referred to as a Bradbury Nielsen
-Gate or BNG). This type of gate consists of two sets of parallel wires which are set to ground potential when in the "off" mode, and equal in magnitude but opposite in sign potentials while in the "on" mode. The strong electric fields present between the wires when the gate is turned on cause the ion beam to deflect, but the fields decay quickly (within a few wire spacing distances) along the beam path. A schematic view of such a gate is shown in Fig. 3-4.
0
O
Gate On
Ion Trajectory
0
®
Gate Off
0
0
Figure 3-4: Schematic view of the interleaved comb-type ion gate
The gate is used to deflect the beam, and once the gate is switched off, allowing the beam to continue, the current at the collector plate is monitored. The time it takes the ions to reach the collector plate after the gate is switched off is given by
t = L
.M
(3.2)
2 q
p
aHowever, as mentioned previously, the ion beam produced by an ILIS generally contains several species of ions with masses, m, mi, etc. and unit charge. Each of these ions will have a different flight time, given by Eq. 3.2. An example of the
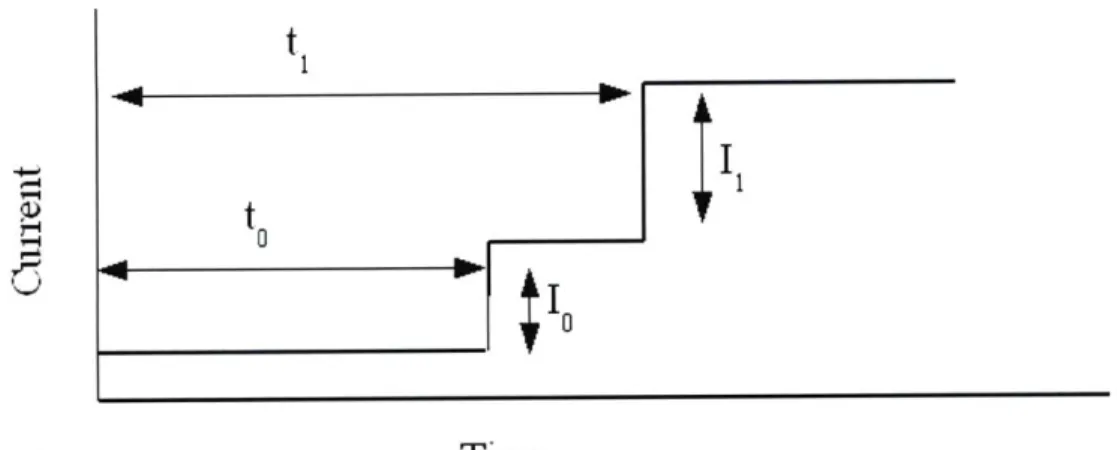
expected collector plate current signal is shown in Fig. 3-5. As seen in the figure, there are two distinct steps at times to and ti corresponding to the masses of the ion species. The step size gives the relative amount of each ion in the beam. If there are
any droplets present in the beam, there will also be a continues distribution of q/m
values, showing up as a gradually sloped region in the TOF output.
t
P t
Time
Figure 3-5: Example TOF-MS Signal for an ILIS with two ion species
The actual setup used for several experiments in this thesis is based on the design
by Lozano [15, 16]. A schematic of the setup is shown in 3-6. In addition to the ion
source and gate described previously, there is also an einzel lens. This lens serves
to focus the ion beam, allowing for a longer flight distance, and therefore a higher
resolution. Before the collector plate there are two grids. The first is grounded, while
the second is biased to -30V in order to suppress secondary electrons at the collector.
Gate
Einzel Lens
L = 757 nni
Ion Beam
a
7
A-30 V
3.3
Retarding Potential Analyzer
An ion that has mass m and charge q that has been accelerated from rest through a potential
#,,
will have an energy q#,,. In order to prevent this particle from passing through a given region, an equal potential barrier of#a
must be applied. In the case of an ILIS, the actual acceleration potential the ion sees is different than the applied extraction potential,#ext.
It is of interest to find the actual energies of the ion beam in order to determine performance parameters of the ILIS, such as thrust efficiency in propulsive applications or the effects of chromatic abberation in focused ion beam applications, both of which were discussed in Sec. 2.2. In order to measure the energy, the ion beam is passed through a region with a controllable retarding potential, with a collector plate beyond the potential barrier. Such a device is referred to as a retarding potential analyzer (RPA). As the RPA voltage,#RPA,
is varied, only those particles that satisfy the following equation will be collected, assuming#a,
q, and#RPA
all have the same sign.1mv2
# = 2#al
q
IRPAI (3.3)q
So, for a completely monoenergetic ILIS ion beam, the current collected by the
RPA as the voltage is swept from zero to
#et
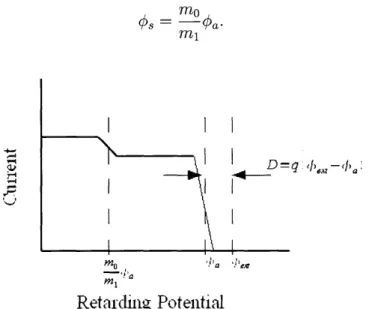
will be that shown in Fig. 3-7. As seen in the figure, the current is constant until the retarding potential reaches the beam potential, at which point all of the current is prevented from reaching the collector plate. The energy deficit D, assuming unit charge as with most ILIS, is given by the difference between the extraction potential and the stopping potential,D = (ext - #a) (3.4)
For a nonideal ILIS, the RPA signal will not actually look like that as shown in Fig. 3-7, instead it will look more similar to that shown in Fig. 3-8. The step corresponding to the acceleration potential will have finite width about the ideal location. There will also be secondary features in the signal, such as a secondary step
a :11ev Retarding Potential
Figure 3-7: Sample RPA output for a monoenergetic source
at a lower voltage. This step is due to the fragmentation of solvated ions after being
extracted. For example a singly solvated ion of mass mi may break up into an ion
of mass mo and a neutral. Only the ion will be detected by the RPA, and it will be
traveling at the same speed as before the breakup, meaning that it will be stopped
by a potential given by
#3
= Oa.(3.5)
I
I
pnml
Retarding Potential
Figure 3-8: Sample RPA output for a nonideal source
In order to obtain the energy distribution from an RPA signal, the derivative of
the curve as shown in Fig. 3-7 can be taken.
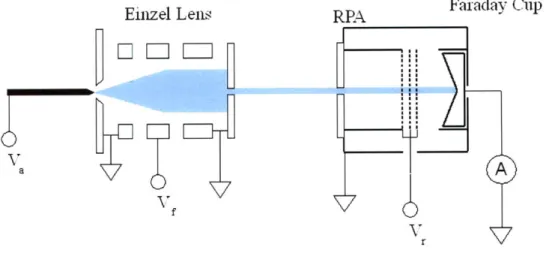
The experimental setup used for the RPA is based on the design in Ref. [16].
As with the TOF-MS, an einzel lens is positioned 8.8 mm from the extractor. The
lens serves to collimate the beam, in order to eliminate energy spread due to beam
divergence. After the lens is a grounded aperture and a shielded drift region of 12
mm. The RPA itself is at the end of the drift region. The basic form of the instrument
is taken from Ref. [25], and consists of a 25 mm inner diameter and 25 mm length
stainless steel cylinder placed within a grounded enclosure. Immediately prior to the
cylinder is a grounded plate with an entrance aperture of 3 mm diameter. At the
other end of the cylinder are a series of grids composed of 76 pm diameter tungsten
wire with spacing of 0.76 mm, giving a transparency of 90 % for each grid. The
collector used in the RPA is a Faraday cup connected to an oscilloscope through a
high impedance electrometer. The RPA is operated by applying a low frequency (33
mHz) high voltage triangular wave to the grids and cylinder. Postprocessing of the
collected signal involves low-pass filtering to eliminate noise, followed by a
second-order finite difference scheme to obtain the energy distribution.
Eizel Lens
RPA
Faraday Cup
OA
fVr
Figure 3-9: Schematic of the RPA setup
3.4
Vacuum Chamber and Electronics
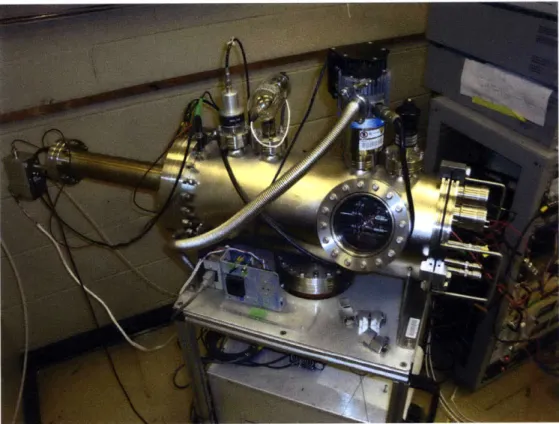
All experiments took place in a vacuum chamber at pressures below 5 x 10⁻⁶. The
chamber itself, shown in Fig. 3-10, is a cylinder constructed of stainless steel. The
main portion of the chamber has a 19.7 cm inner diameter and a length of 49.5 cm.
Attached to the back of the chamber is an extension tube of inner diameter 5.6 cm and
length of 36.5 cm. The chamber is evacuated using two Varian V-70 turbopumps, with
a Varian SD-40 mechanical pump providing the necessary back pressure. Pressure
inside the chamber is measured using either a Varian IMG-100 cold cathode gauge or
a Varian 571 Bayard-Alpert type ionization gauge.
Figure 3-10: Vacuum chamber
The electronics used in all the experiments are listed in Table 3.1
Table 3.1: Electronic equipment
High Voltage Power Supplies 2 x Matsusada AMS-5B6 Bertan 205B-05R
Bertan 205B-10R Lab Power Supply Tenma 72-6615
Oscilloscope Agilent Infiniium 54835A Electrometers Keithley 6517
Keithley 6514 Pulse Generator BNC-555
Chapter 4
Development of an Iodine ILIS
4.1
Motivation
As mentioned previously, the use of ILIS in FIB is very appealing partially due to the incredible variety of ionic liquids that are available. The choice for the study of this particular ILlS, using the ionic liquid 1-butyl-3-methylimidazolium iodide is motivated by the possibility of creating a beam of iodine ions. Though there may be many uses for such an ion beam, there are two particular applications that are in mind when investigating this ILIS.
The first is the use of an iodine beam to etch type III-V semiconductors, a class of material including GaAs, InP, InSb and several others. The reactivity of iodine with several of the component elements in the III-V group make it an attractive choice for etching. The concept of using iodine for this purpose is nothing new, as it is commonly used assist to FIB etching by injection of iodine gas in a process called gas assisted etching (GAE) [11]. There have also been studies of directly using a positive iodine ion beam for etching III-V materials [5], which showed it to be effective when milling indium-containing semiconductors. This history of using iodine for milling
and GAE of these semiconductor materials is a strong motivation for this study. The second application in mind is for the use in secondary ion mass spectrometry
(SIMS). In SIMS, the surface of some sample is bombarded with ions, resulting in
techniques. There are several ion sources that can be used in SIMS, but only a few different sources are available using negative ions. An iodine source is attractive for this application because the relatively massive iodine particles would have a good yield of secondary ions. A negative iodine source using surface ionization of iodine gas has been previously constructed for this application [22], however the simplicity of an ILIS makes it an attractive option.
4.2
Beam Characterization
With the guidelines from Sec. 2.2.2 in mind, the ion beam produced by a BMI-I ILIS is investigated to determine the properties relevant to operation in a FIB system. The experimental techniques discussed in Chapter 3 are used for this characterization, with the ion source configuration being that shown in Fig. 3-2. Two different emitters were used during the testing of the BMI-I ILIS, hereafter referred to as emitter A and emitter B. The majority of experiments were performed with the ILlS operating in the negative mode, due to the desire to create a beam of iodine ions as discussed in Sec. 4.1, however some data on the positive mode is included for completeness.
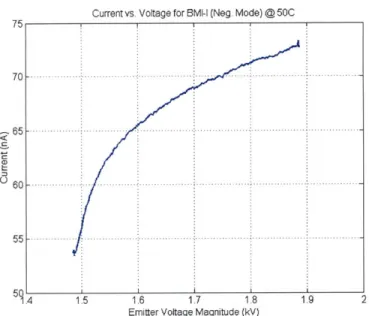
Previous studies with this particular ionic liquid [23] were unable to achieve stable current emission at room temperatures. In order to perform the experiments described in this chapter, the ILIS had to be heated to 50'C to achieve stable emission. Unless otherwise mentioned, all data presented was collected at this operating temperature. After successfully achieving stable current, initial tests were performed to simply measure the emitted current versus the applied extraction voltage. An example I-V curve obtained is shown in Fig. 4-1. Emission began at voltages lower than shown, but was stable only in the range of about -1.5 to 1.9 kV for this particular emitter (emitter B). Other emitters have been operated at both lower and higher voltages, therefore the curve shown in the figure should be taken only as an example.
Perhaps the most significant implication from this measured current is that it was obtained at all. As seen in Table 1.1, the viscosity of BMI-I is about 20 times larger than EMI-BF4 and its conductivity is about 5 times smaller. Despite these significant
Current vs. Voltage for BMI-I (Neg. Mode) @50C
50C
1 4 1.5 1.6 1!7 1 8 1.9 2
Emitter Voltage Magnitude (kV)
Figure 4-1: Current emitted from a BMI-I ILIS in the negative mode
difference, the current obtained from this BMI-I ILIS was only about 4 times lower
than those seen with the well studied EMI-BF
4. This result is something that should
be investigated further in the future.
4.2.1
Beam Composition
The composition of the ion beam was determined by using the time of flight mass
spectrometry technique described in Sec. 3.2. Two sets of experiment studying the
beam composition were performed. The first, with emitter A, varied the operating
temperature and observed the mass spectra. The second, performed with emitter B,
varied the operating voltage. Several plots of the current signal collected from the
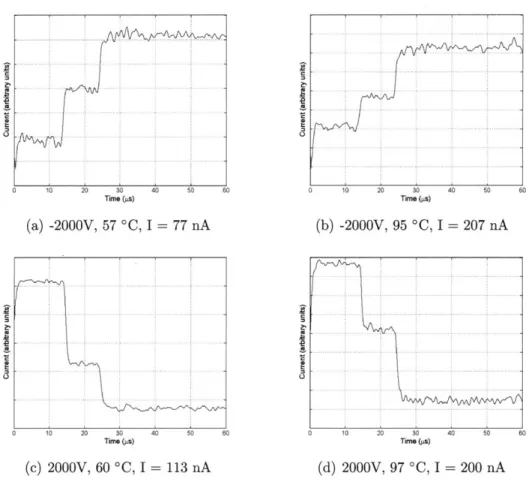
TOF-MS instrument for the BMI-I ILIS operating at
+/-
2kV are shown in Fig. 4-2.
A summary of the species observed can be seen in Table 4.1. As seen with prior
studies of ILIS, the charged species contained in the beam are found to be singly
charged ions attached to a number of neutrals, being of the form (BMI-I)"BMI+ in
the positive mode and (BMI-I)I- in the negative mode. There is a strong presence
of degree of solvation n
=
0, 1 species, and signs of a small amount of n
=
2 in some
of these signals.Of particular interest in the figures are the plots for the ILIS in the
negative mode, where nearly half of the current signal is composed of I ions, without any sign of droplets.
Time (ps) (a) -2000V, 57 'C, I 77 nA 0 10 20 30 40 50 6( Time (ps) (c) 2000V, 60 'C, I = 113 nA (b) -2000V, 95 *C, I = 207 nA Time (ps) (d) 2000V, 97 -C, I = 200 nA
Figure 4-2: TOF-MS signals for a BMI-I ILIS operating at several different conditions
A second set up TOF-MS tests were performed for a second emitter (emitter B)
operating in the range of 1.5 to 1.9 kV in both the positive and negative modes. The output data was subjected to a postprocessing scheme to convert the horizontal axis from time to mass using Eq. 3.2, followed by low-pass filtering and a finite difference differentiation to obtain the mass spectrum of-the ILIS, showing "peaks" rather than a current signal. Results of this are shown in Fig. 4.2.1. There are distinct peaks corresponding to the non-solvated and singly solvated ions in both the positive and negative modes. Again, nearly half of the signal is composed of pure iodine ions in the negative mode.
Polarity Ionic Species Ion Mass (amu) Time of flight (Is) BMI+ 139 to + (BMI-I)BMI+ 404.9 ti (BMI-I)2BMI+ 670.8 t2 I- 126.9 to - (BMI-I)I- 392.8 ti (BMI-I)21 658.7 t2
Table 4.1: Expected flight times for a BMI-I ILIS operating at +/- 2kV
4.2.2
Energy distribution
The energy distribution of the ion beam operating in the negative mode was deter-mined by the use of the RPA as described in Sec. 3.3. Representative energy spectra for applied potentials of -1500, -1600, and -1700 V are shown in Fig. 4-4.
These show distinct peaks at potentials slightly below the applied extraction volt-age. The energy deficit, D, ranges from 9 to 15 eV in these case. The full width at half max (FWHM) in these cases are about 12 eV. These values are significantly higher than those seen with previous studies on the energy distributions of ion beams from an ILIS. For example, a study with the ionic liquid EMI-Im found deficits of about 6 eV and FWHM of about 7 eV [16].
In addition to the primary signal in the energy spectrum, some secondary features are also present as seen in Fig. 4-5. There are two secondary peaks, located at potentials corresponding to the breakup of the n = 2 ion into n = 1 and of the n = 1 ion into n = 0. As described by Eq. 3.5, the locations of these peaks correspond
to the mass ratios of the initial and final ions, whose values are listed in Table 4.2. Other than the primary peak and the two secondary peaks, there is also a slight, more or less constant signal contained between the n = 1 -+ 0 and primary peaks. A
continuous energy distribution can sometimes be due to droplets, but the TOF-MS showed only ions. Also, the containment of this continuous signal between the two peaks suggests that it is due to ion fragmentation in the region between the emitter and extractor. This fragmentation is discussed in more detail in Ch. 6.
(Bmp)r .. ... ... r. ... ... .... 100
~~
200.0.40 .. .50 .00 70 100 200 300 400 500 600 700 Mass (amu) (a) 500 600 Mass (amu) (b) 800 900 1000Figure 4-3: Mass spectra for a BMI-I ILIS operating at (a) -1900 V and (b) 1900 V
4.3
Estimated Performance in a FIB Column
With the BMI-I ILIS well characterized for operation in the negative polarity, it is
possible to use Eq. 2.17 to make an estimate of the performance in a FIB column. The
values that are required from the ILIS are the current, the angular intensity Jth
beam energy spread,
AW1/2, and the beam energy, W. The aberration coefficients,
C, and Cc, and the magnification, M, are properties of the FIB column, and not
dependent on the ion source used. If the angular distribution of the beam is assumed
to be parabolic with a half-angle of 180 as with other ILIS [14], then the angular
d
0.6-FWHM= 12eV 12eV 11eV
N E o 0.4 -z 0.2- -0 1200 1300 1400 1500 1600 1700 1800 Retarding potential (-V)
Figure 4-4: RPA energy spectra results for applied voltages of -1.5, -1.6, and -1.7 kV Initial -+ final degree of solvation
#,stop/#Oa
1 - 0 0.32 2-± 1 0.60 2 a0 0.19 #,tp for #k = -1490 V -477 -894 -283
Table 4.2: Stopping potentials for products of ion fragmentation
intensity for the BMI-I ILIS operating at a total current 10 can be determined by relating the total current to the angular distribution, then taking the derivative with respect to the solid angle. First of all, the relationship between the half angle, ao,
and the solid angle, Q, for an axisymmetric layout is
Q = 27r(1 - cos ao) (4.1)
Therefore, the angular intensity can be written as
dI _ dI daO = 1 dI (4.2)
dQ dao dQ 27r sin ao dO
0.8 0-6 0 0.4 0.2 0 -0 200 400 600 800 1000 1200 1400 1600 1800 Retarding Potential (-V)
Figure 4-5: RPA energy spectrum results for applied voltages of -1.5 kV
determined by integrating the distribution function,
f(0),
through the appropriate solid angle.1ao _ f 0
f(0)
sin(6) dO (4.3)
Io fOO f(6) sin(0) d6
Thus the angular intensity at angle a0 is found to be
dI
10f(a)
(44)
dQ 2,rf f(o sin(0) do
A plot of the angular intensity versus the aperture angle is shown in Fig. 4-6. It
can be seen that for the small angles typical of a FIB system (less than 10 mrad), the angular intensity is just below 0.65 pA sr-1.
Consider the performance of this BMI-I ILIS as compared with a LMIS operating in an optical column at unity magnification with spherical and chromatic aberrations of 1000 and 10 mm, respectively. The beam limiting aperture will be a small angle, so the relation between the current and angle can be simplified to
dI
dI
2dII = AG
dQ
= 27r(1 - cos ao)dQ
~ OraldQ
(4.5)
For the sake of comparison, assume the half angle of the aperture is sized to allow
100 pA of current through, corresponding to ao
=
7 mrad. Under these conditions
and operating at a beam potential of 1500 V, the spot size would be approximately
300 nm, giving a current density of 0.15 A cm
2. A typical Ga LMIS, for example,
has brightness of 20 pAsr-
1, an energy spread of about 5 eV, an operation energy
on the order of
104eV, and source size of around 50 nm [17]. This example LMIS
would produce a spot of about 50 nm, with current density of 5 A cm
2under the
same conditions.
0.65 064 063 13 0.62 C 0 0.61 0.6 a 0 10 20 30 40 50 60Aperture Half-Angle, ot (mrad)
70 80 1
Figure 4-6: Estimated angular intensity for a BMI-I ILIS
rjg 1 i -. . .. .- . . . . .--. -. --. . . . .-. -.- -. . . . . . .. . . .-. . -. . . .. . . . -.--. .- .- .- ..--. . . . .- - - . - -. .. - - - - -. .. .-. --. . .. .. . . . ... . . . . -.- --. .. . . .. . . .-. -. - - - -. .. . .-. -. . . . .--. -. .. -.-.- --. -. . . . . . -. . .. .- - --. -.-.-.- .-.-. .-.-.-. .-.-- .- ..-.-.- ---.-.-.-.-.--.-.--.-.---.-
Chapter 5
Full Beam Measurements
The experimental techniques described in Chapter 3 are designed to analyze only a portion of the ion beam from an ILIS. In order for this information to be used to characterize the ILIS itself, the ion beam needs to be assumed to be uniform, or the instrument needs to be scanned through the entire beam. It is desirable to have information on the entire beam, especially when looking at certain phenomena, such as the ion fragmentation briefly mentioned in Ch. 4. An alternative to these previously described techniques is to take measurements on the entire ion beam simultaneously, rather than just a portion. This chapter explores the design and testing of such an instrument, as well as the issues with taking such measurements.
5.1
Full Beam Time of Flight
The time of flight mass spectrometry setup described in Sec. 3.2 has a flight length of
757 mm. This long distance allows for a higher resolution TOF, but requires the use
of an einzel lens to collimate the beam, in order to have a good signal at the collector plate. An issue with the use of an electrostatic lens is that it has a significant amount of chromatic aberration [17]. The effect is that only a certain range of energies are focused properly onto the collector plate. In the ideal situation, where there are only a few ionic species in a very narrow energy range, this does not cause any problems. However, for broad energy distributions, this may be an issue.
127
Figure 5-1: Cross section view of the vacuum chamber (dimensions in inches)
In order to address this issue, a full beam time of flight collector was designed. The design was limited by two main considerations. The first was that the instrument must fit into the current vacuum system, which is shown in cross-section view in Fig.
5-1. The second was that the half angle of collection should be about 200 to maximize
the portion of the beam collected, which is based previous studies of ILISs [14]. Based on these two parameters, the design shown in Fig. 5-2 was created. More detailed drawings are contained in Appendix A.
This design has two grids of 70% transparency (8.66 holes per cm, wire thickness of 0.19 mm) followed by a collector plate. The first grid is grounded to serve as a shield, while the second grid is biased to -30 V to suppress secondary electrons. Following the two grids is a collector plate, which is connected to an amplifier. After the collector is a grounded back plate, which provides structural support as well as additional shielding. The distance between all plates is set to 6.35 mm using alumina spacers. With this setup, and a flight distance of 198.1 mm between the gate and collector as shown in Fig. 5-3, a half-angle of about 18 0 is collected. The collector
assembly can be moved to decrease the flight distance (to have a larger collection
Book Plote,
Ground G\
'\Alumina Rods
Figure 5-2: Full beam TOF collector assembly
angle) or to increase the distance (to have less beam spreading).
The collection half-angle of 180 will cause the TOF signal to have some spread due to the difference in time it takes ions at different angles to reach the collector. For a flight distance L and accelerating voltage V, an ion of mass m and charge q will have a flight time given by
too = L
.
(5.1)V2 q V*
if it has a trajectory that is parallel the axis of symmetry as shown in Fig. 5-3. However, if the ion's trajectory is inclined to an angle 0 with respect to the axis, the flight time will be increased to
L
1 m 1
to = . (5.2)
cosO 2 q V
Therefore, the TOF signal will have a spread given by the difference between Eqs.
5.2 and 5.1. For example, an EMI-BF4 ILIS operating in the positive mode at 1500
V will have an expected spread of about 0.2 ps.
Initial tests of the full beam TOF were performed by connecting the collector .. . ... ... gmw l
200 nun
off-axis ion
V
x
-30V
Figure 5-3: Schematic of the full beam TOF assembly
plate to ground through a shunt resistor, and amplifying the voltage drop across the resistor using a non-inverting amplifier with output to an oscilloscope, as shown in Fig. 5-4.
An example of the output from the amplifier, as recorded by an oscilloscope is shown in Fig. 5-5 for an EMI-BF4 ILIS operating in the negative mode at -1500V,
with a flight distance of approximately 266.7 mm. Under these conditions, the flight times of BF4 and (EMI-BF4)BF4 are calculated to be 4.6 ps and 8.4 ps, respectively.
As can be seen in the figure, there aren't any discrete steps as are expected for a TOF signal. However, at the expected locations of the steps are "shoulders" on the curve, followed by a region that appears to be an exponential decay. The fact that there are features that correspond to the expected step locations, and that there is an apparent exponential region suggests that the issues are due to increased capacitance in the circuit, when changing from the configuration described in Sec. 3.2.
In order to properly operate the full beam TOF, several different amplification
R
2R
1out
R2
R.
VOW.i,.Ri
1 +R2Figure 5-4: Non-inverting amplifier
with a shunt resistor
circuits were considered, finally settling on a transimpedance amplifier as shown in Fig. 5-6. The op-amp chosen for the circuit was a Texas Instruments OPA637, paired with a 1OOkQ feedback resistor and a 2pF feedback capacitor. These components give the circuit a gain of 10' V/A, or in more relevant figures, 1 mV
/
10 nA. Thebandwidth of the circuit will be given by the RC time constant, which in this case is r = 0.2ps corresponding to about 0.8 MHz.
A EMI-BF4 ILIS was used to test the setup, with representative signals shown
in Fig. 5-7. The steps corresponding to BF4 and (EMI-BF4)BF4 are present in the
negative mode, and those corresponding to EMI+ and (EMI-BF4)EMI+ are present
in the positive mode. The steps have a spread on the order of 0.2 ps, which could be due either to beam spreading or to the limited bandwidth of the amplifier. Also present in these plots, particularly in the negative mode, is a gradually sloped region after the initial steps, which may indicate the presence of droplets.