https://doi.org/10.4224/8913774
READ THESE TERMS AND CONDITIONS CAREFULLY BEFORE USING THIS WEBSITE.
https://nrc-publications.canada.ca/eng/copyright
Vous avez des questions? Nous pouvons vous aider. Pour communiquer directement avec un auteur, consultez la Questions? Contact the NRC Publications Archive team at
[email protected]. If you wish to email the authors directly, please see the first page of the publication for their contact information.
NRC Publications Archive
Archives des publications du CNRC
For the publisher’s version, please access the DOI link below./ Pour consulter la version de l’éditeur, utilisez le lien DOI ci-dessous.
Access and use of this website and the material on it are subject to the Terms and Conditions set forth at
Fully Automatic Camera Calibration Using Self-Identifying Calibration
Targets
Fiala, Mark; Shu, Chang
https://publications-cnrc.canada.ca/fra/droits
L’accès à ce site Web et l’utilisation de son contenu sont assujettis aux conditions présentées dans le site LISEZ CES CONDITIONS ATTENTIVEMENT AVANT D’UTILISER CE SITE WEB.
NRC Publications Record / Notice d'Archives des publications de CNRC: https://nrc-publications.canada.ca/eng/view/object/?id=2ba89a82-10e2-4d80-b79f-da89e0981fd5 https://publications-cnrc.canada.ca/fra/voir/objet/?id=2ba89a82-10e2-4d80-b79f-da89e0981fd5
National Research Council Canada Institute for Information Technology Conseil national de recherches Canada Institut de technologie de l'information
Fully Automatic Camera Calibration Using
Self-Identifying Calibration Targets*
Fiala, M., and Shu, C. November 2005
* published as NRC/ERB-1130. November 2005. 26 pages. NRC 48306.
Copyright 2005 by
National Research Council of Canada
Permission is granted to quote short excerpts and to reproduce figures and tables from this report, provided that the source of such material is fully acknowledged.
National Research Council Canada Institute for Information Technology Conseil national de recherches Canada Institut de technologie de l'information
Fully Aut om a t ic Ca m e ra
Ca libra t ion U sing Se
lf-I de nt ifying Ca libra t ion
T a rge t s
Fiala, M., and Shu, C. November 2005
Copyright 2005 by
National Research Council of Canada
Permission is granted to quote short excerpts and to reproduce figures and tables from this report, provided that the source of such material is fully acknowledged.
TECHNICAL REPORT
NRC 48306/ERB-1130 Printed Nov 2005
Fully Automatic Camera
Calibration Using Self-Identifying
Calibration Targets
Mark Fiala and Chang Shu
Computational Video Group
Institute for Information Technology National Research Council Canada Montreal Road, Building M-50 Ottawa, Ontario, Canada K1A 0R6
NRC 48306/ERB-1130 Printed Nov 2005
Fully Automatic Camera Calibration
Using Self-Identifying Calibration Targets
Mark Fiala and Chang Shu
Computational Video Group
Institute for Information Technology
National Research Council Canada
Abstract
Determining camera calibration parameters is an essential step in most com-puter vision endeavors; it is a time-consuming task despite the availability of calibration algorithms and software. A set of point correspondences between points on the calibration target and the camera image(s) must be found, usually a manual or manually guided process. Two commonly used calibration tools are implementations of Zhang’s (OpenCV) and Tsai’s algorithms, however, these assume that the correspondences are already found. A system is presented which allows a camera to be calibrated merely by passing it in front of a panel of self-identifying patterns. This calibration scheme uses an array of ARTag fiducial markers which are detected with a high degree of confidence, each de-tected marker provides one or four correspondence points. The user prints out the ARTag array and moves the camera relative to the pattern, the set of cor-respondences is automatically determined for each camera frame, and input to the OpenCV calibration code. Experiments were performed calibrating several cameras in a short period of time with no manual intervention. This system was implemented in a program for co-planar calibration, results are shown from several calibration tests with different cameras. Experiments were performed comparing using either the four ARTag marker corners or a single marker cen-ter as correspondences, and the number of image frames necessary to calibrate a camera was explored. This ARTag based calibration system was compared to one using the OpenCV grid finder cvFindChessBoardCornerGuesses() function which also finds correspondences automatically. We show how our new ARTag based system more robustly finds the calibration pattern and how it provides more accurate intrinsic camera parameters.
Contents
1 Introduction 4
1.1 Camera Calibration and Currently Used Automatic Routines . . . 5 1.2 Self-identifying patterns: ARTag . . . 7
2 Automatic Calibration 9
2.1 Using Marker Centers versus Using Marker Corners . . . 11 2.2 Image Set Size . . . 11 3 Comparison of ARTag System and OpenCV Grid Finder 13
3.1 Comparing Accuracy with ARTag Corners, ARtag Centers, OpenCV Grid Finder, and Circular Dots . . . 16 3.2 Sensitivity to Lighting and Focus . . . 17
1
Introduction
Camera calibration is considered a solved problem but is still a difficult and time consuming process, due to the first step of finding correspondences which is often performed manually. Available calibration algorithms take as input a list of corre-spondences between points on a calibration target and their projections in one or several images. In general the problem of finding the correspondences themselves is overlooked. A reliable fully automatic system would help researchers and industry alike. Ideally a camera should be automatically calibrated only from a set of images captured rapidly from unknown poses.
Finding the intrinsic parameters of focal length, scale factor (aspect ratio), radial distortion parameters, and optionally thin prism distortion parameters for a camera are necessary to achieve high accuracy for vision tasks such as stereo reconstruction, etc. Addressing radial distortion is especially important for use with low cost NTSC cameras and webcams with their low cost lenses as the field of view is typically quite curved. Two used algorithms to determine these intrinsic calibation factors are Zhang’s [15] and Tsai’s [13] algorithms, the popular OpenCV software functions cvCalibrateCamera() and cvCalibrateCamera 64d() implements the former. Zhang’s algorithm requires a list of correspondences from multiple viewpoints. Locating 20-100 correspondences for each of 20+ camera images is a tedious and error prone task if performed manually. Having even one incorrect point can be sufficient to cause the calibration calculations to not converge.
Automatic methods to find these correspondences do exist, such as the the OpenCV grid finder cvFindChessBoardCornerGuesses() function. However, they have limita-tions of how much distortion or clutter the images can have, and how much of the pattern must be seen.
This paper introduces a way to use the recently developed ARTag fiducial marker system [4] as a more robust method to find these correspondences. A self-identifying pattern consisting of an array of ARTag markers is presented to the camera-under-test in various poses and these correspondences automatically generated. These are in-put to the OpenCV cvCalibrateCamera() or cvCalibrateCamera 64d() function which implements Zhang’s plane-based calibration routine.
The benefit of this system is that a camera can be calibrated in a matter of minutes since the correspondences are determined robustly and automatically, the camera is simply moved around to several views in front of a planar array of ARTag markers and the calibration is performed completely automatically. In this paper 17 cameras were calibrated, with over 2000 images with about 20-60 correspondences found automatically in each image frame, for a total computation time of less than an hour. The whole process for a given camera takes under 5 minutes (Fig. 1). Typically about 10-15 images are needed from different angles to accurately calibrate
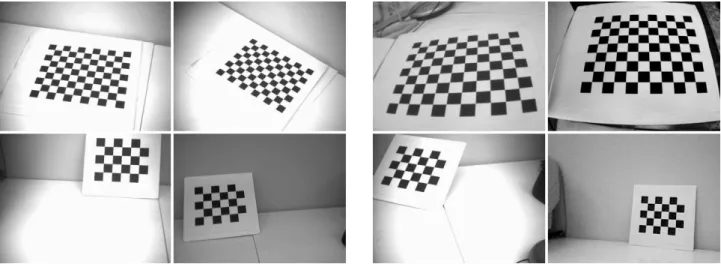
Figure 1: (Left) Camera-under-test is moved around to different views of self-identifying pattern. Examples of captured images used for calibration (right). Typi-cally 10-15 images are needed.
the camera.
1.1
Camera Calibration and Currently Used Automatic
Rou-tines
Camera calibration typically involves finding parameters for a camera model given world-point correspondences. Photogrammetry’s bundle adjustment is highly accurate and has complex models with dozens of parameters. At the other end of the spectrum of complexity is the two parameter model of focal length and scale, or horizontal and vertical focal lengths (Fx, Fy). The horizontal Fx and the vertical Fy focal lengths in
pixels can be simply calculated by measuring the image width and height of a known object at a known distance. This assumes a pinhole projection model with the center of projection (uo, vo) as being the image center, this is sufficient for many projects.
The next step in complexity is to calculate the entire camera matrix K containing Fx, Fy, uo, vo and possibly the skew factor s. Most cameras, especially low cost ones
with lenses of small curvature, require going beyond this pinhole model to address the “barrel” or “pincushion” effect of radial distortion. Radial and thin prism distortion is typically modeled by polynomials with 1 or 2 term coefficients. Zhang’s model [15, 14] finds these, which this paper labels as Fx, Fy, uo, vo for the focal lengths and
image center, k1, k2 for the radial distortion, and the thin prism parameters p1, p2. To calibrate a camera with Zhang’s or other methods, one needs to have a list of corresponding image points and world points (either co-planar 2D points, or 3D points). Gathering these has usually been a manual task, which is slow and tedious and prone to errors that adversely affect the results. If the camera is moved or jarred, its focus or zoom changed, it must be recalibrated. Ways to do it automatically would find much use. Soh et al. [12] and Shu et al. [11] describe this mostly ignored problem. Auto-calibration attempts to find a camera’s intrinsic parameters from a series
of images of natural scenes, relying on rigid motion [10, 8]. However, this produces sparse and/or erroneously matched correspondences and the results of autocalibration are seldom sufficient for applications demanding accuracy. Some sort of marker based calibration is normally performed when accuracy is needed.
There are some tools to help, ARToolkit [7] is a software environment for Aug-mented Reality that has a calibration program where the user clicks on an array of circular dots in a special order, a sub-pixel estimate is made automatically by finding the centroid of a thresholded connected group of pixels in the region of each user click.
The OpenCV software package [1] is a useful collection of computer vision al-gorithms and source code, including the cvCalibrateCamera 64d() function which is used herein for the camera calibration after the correspondences are found. OpenCV provides a grid finder function cvFindChessBoardCornerGuesses() which attempts to locate the corners in a chess-board/checkerboard pattern. It is typically followed by the cvFindCornerSubPix() function to provide better corner accuracy.
The cvFindChessBoardCornerGuesses() function requires the user to provide the dimensions (number of rows and columns) of the checkerboard. It attempts to order corners in a grid to find correspondences. One disadvantage of this method is its lack of robustness in that all points must be fitted into the grid for any correspondences to be reported. It was found that the function did not work in the majority of our test images, especially those from some highly radially distorted low cost NTSC cameras and webcams which had lower quality lenses.
Also, even when FOV and distortion criteria were met, many images failed to have their grids located, many images with low distortion, clearly visible grids, and uncluttered backgrounds could not be used in calibration. Fig. 2 shows sample images which were detected (left four images) and images which were not (right four images). Shu et al. [11] have a system called CAMcal which uses corner detectors and topological operators to find checkboard squares to order the corner points, it however can fail when false corners get detected or when the pattern is viewed from an oblique angle such that the triangulation step does not correctly link corners. CAMcal is quite sensitive to imperfections in the image. However, it does not require that an entire pattern is in view.
Soh et al [12] use a pattern of 16 squares which are found with thresholding and blob analysis. The centroids of the squares are arranged to fit a regular grid using attributed relational graph matching. The use of structural knowledge of the grid could potentially improve the robustness of the pattern detection algorithm, though little detail was given in the paper, nor is the software based on their method freely available.
The ARToolkit and OpenCV programs require the full visibility of the entire pattern, which makes it difficult to take several views and have enough sample points
Figure 2: Examples of patterns successfully and unsuccessfully recognized by OpenCV’s cvFindChessBoardCornerGuesses() function. The interior corners are detected and ordered by the function, the upper row show images with the checkerboard with 8 rows and 10 columns, the lower row are images with a checkerboard of 4 rows and 5 columns. All interior corners need to be visible and the camera cannot have too steep an angle from straight on. The grids in the left four images were successfully detected, while the function failed on the right four images.
near the periphery of the image where they are needed most, one must always keep all points inside the field of view.
None of these appears to provide consistent and trouble free robust automatic calibration scheme, motivating the development of our ARTag based system.
1.2
Self-identifying patterns: ARTag
Self-identifying patterns are special marker patterns that can be placed in the en-vironment and automatically detected in camera images. Also known as fiducial marker systems, a library of these patterns and the algorithms to detect them help to solve the correspondence problem. Self-identifying marker systems such ARToolkit and ARTag are typically used for applications such as calculating camera pose for augmented reality and robot navigation.
ARTag was chosen because of its robustness to lighting variation, its very low false positive detection rate, and its very low inter-marker confusion rate (falsely identifying the marker ID). ARTag is more robust than the popular ARToolkit in these respects [5]. ARTag fiducials are square planar bi-tonal patterns which have a square border and internal 36 bit digital pattern (Fig. 3).
Figure 3: (Left) ARTag markers. (Right) ARTag markers detected in an image (white border and ID number overlaid). ARTag markers are bi-tonal planar marker patterns consisting of a square border and a 6x6 interior grid of cells representing logic ’1’ or ’0’. 12 out of the library of 2002 markers are shown.
square border and an interior region filled with a 6x6 grid of black or white cells. 1001 of ARTag markers have a black square border on a white background, and vice versa for the other 1001. The algorithm for detecting the markers in an image first locates quadrilaterals which may be perspective views of the marker border, then the interior is sampled into 36 binary ’1’ or ’0’ symbols. Further processing is in the digital domain providing a non-linear response giving very low false positive and inter-marker confusion rates. With ARTag, the probability of falsely identifying one marker for another, or a piece of the background as a marker, is vanishingly low. Fig. 3(left) shows ARTag markers being detected in an image.
The ARTag [2, 3] self-identifying pattern system was employed in our system to find correspondences in images of a uniplanar calibration object. The calibration object is an array pattern of ARTag fiducials at known locations.
Fig. 3(right) shows the markers being automatically located in an image. ARTag has some robust features that allow it to detect markers when partly occluded, how-ever this “incomplete marker detection” can be turned off so that only completely seen markers are used as correspondence points.
The correspondences are the centers of each ARTag marker located in the image (Fig. 4). Both the usage of the four corners, and just the marker center were investi-gated with the conclusion being that the best accuracy is obtained using the marker center. This is detailed later herein.
Figure 4: Stages of autocalibration. Input image (left) is searched for ARTag markers, detected markers are shown (middle) and their corners or centers and the matching world coordinate point used as correspondences (right). (note: right image shows “ARTag corner” method where the marker corners are used providing 4 correspon-dences per marker).
2
Automatic Calibration
A system was created by combining the ARTag marker detection with OpenCV’s cvCalibrateCamera() function.
An array of 19 x 9 ARTag markers was printed and mounted on a table top size 60“ x 30” meddite panel and was used for most of the experiments in this paper. Two smaller ARTag arrays patterns were printed on 8.5“x11” pages for the experiments in Section 3.1. Table 1 shows results using the meddite panel.
Fig. 5 shows the calibration pattern, Fig. 1 show an Intel CS120 webcam being calibrated by capturing views of the meddite panel.
The OpenCV cvCalibrateCamera 64d() function is a double precision implemen-tation of Zhang’s uniplanar algorithm.
The quality of each calibration is evaluated by computing the reprojection error, which is the Euclidean distance between the identified marker point and the projection of its corresponding pattern point onto the image. Sometimes the calibration run fails due to cvCalibrateCamera 64d() not managing to reach convergence. Usually with larger sets of images this problem is avoided, however, the causes for these failure cases is not clear. When the points were examined in failed calibration runs, they turned out to not be matching failures, they were not outliers in the traditional sense of being a false match between camera and world point. The ARTag marker detection did not fail, rather it seemed that the convergence of Zhang’s algorithm (or the implementation in OpenCV) seemed to be sensitive to the inclusion or exclusion of some correct calibration points. It was decided to not remove points to obtain a better calibration in our system, since unless a mismatch occurs every data point
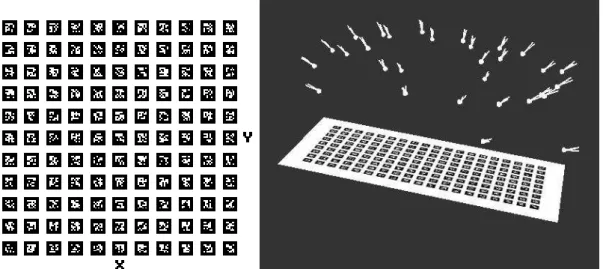
Figure 5: (Left) Self-Identifying array of ARTag markers used as a co-planar calibra-tion target. Only a few markers need be seen, there are no constraints on what part of the pattern needs to be visible. The wide pattern makes it possible to have many views with inclined views. (Right) automatically recovered camera positions relative to ARTag array.
should be used.
Nineteen different cameras or camera/frame-grabber configurations were calibrated ranging from low cost webcams with resolutions 320x240 pixels, NTSC cameras, to high resolution (1280x1024) digital cameras. A Camedia Olympus E20 digital camera with a 9-36mm zoom lens and a Powershot S60 digital camera with zoom lens were both used in 640x480 mode. The Powershot S60 was put into three zoom settings; fully zoomed out (short focal length), in between (medium) and fully zoomed in (long focal length). A Pixelink 654A IEEE-1394 camera provided 1280x1024 images with a fixed 16mm lens. Two IEEE-1394 Dragonfly cameras from Point Grey Research were used; a greyscale 640x480 camera and a “HICOL” color 1024x768 camera. The greyscale 640x480 camera was tested with 5 different lenses; two 4mm lenses, a 6mm lens, and two 8mm lenses. Three USB webcams and 2 NTSC cameras with 2 differ-ent framegrabbers were used. Three differdiffer-ent NTSC video cameras were used; a high quality SONY XC 999 with 6mm lens, Sharp VL-AH150U camcorder, and a low cost hobby surveillance camera. These NTSC video streams were captured with a an ATI PCI All-in-Wonder frame grabber providing 640x480 images. Finally, the webcams were: an Intel CS120 Easycam (320x240 pixels), a WC/50 Telemax webcam (320 x 240 pixels), and an Intel Pro (640x480), a Creative “Live Ultra for Laptops” USB 2.0 webcam (640x480), and a Logitech Quickcam Pro 4000 (640x480).
ARTag array.
2.1
Using Marker Centers versus Using Marker Corners
The ARTag fiducial marker system software found markers in each image and reported the ID along with the image locations of the four corners. The marker ID and corner number was matched to an a priori 2D coordinates providing four correspondence points per marker. A decision had to be made to use all four, or just use the marker center found by intersecting lines connecting opposite corners. Both methods were tested; the “ARTag corner” method and the “ARTag center” method, the latter proving to be more accurate.
The ARTag system reports the corners of the square outline, found by intersecting line equations calculated over the marker border sides. Due to blurring and other un-desirable effects of the lens and aperture size, the brighter areas can expand affecting the corner position. Usually the ARTag markers with the black square border are used, and so the white background can expand shrinking the border, thus providing an image measurement of the corners that shrinks towards the center. When calcu-lating the marker center, the movement of the corners tend to mostly cancel each other out and we expect better accuracy of the correspondence points obtained, at the cost of having less of these points per frame. The effect of lighting is explored in Section 3.2. Using the marker center is analoguous to using the center of round calibration dots used in most (non-automatic) calibration setups.
The intrinsic parameters are shown for the “marker center” approach and eval-uated by calculating statistics on the reprojection error, the standard deviation and maximum reprojection error are shown. Also shown (last column of Table 1) are the reprojection error statistics using the “marker corner” method.
2.2
Image Set Size
A practical question asked by one wishing to calibrate a camera is how many images are necessary. Assuming the images were taken from varying distances and angles relative to a calibration pattern, how many images should one capture?
We performed an experiment on eight of the camera configurations where we cali-brated using image set sizes varying from 3 to 30 image frames per set. The accuracy of the intrinsic parameters extracted was evalulated by measuring the reprojection error when projected back to the full set of all frames. We randomly chose a subset of images from the full set, calibrated the camera using them using the ARTag cen-ter method, and then evaluated these intrinsic paramecen-ters. The intrinsic paramecen-ters were evaluated by using the full set of images, calculating only the extrinsic param-eters (using the OpenCV cvFindExtrinsicCameraParams 64d()), and observing the
reprojection error and number of times the calibration run failed. A calibration run was deemed a failure if the standard deviation reprojection error was greater than 3.0 pixels, or the maximum reprojection error was greater than 20.0 pixels. The stan-dard deviation and maximum reprojection error was averaged over all the successful calibration runs. 10 iterations were performed for each set size. For example, for the Camedia camera we have 66 frames in the full set. We started by randomly selecting 2 frames and calibrated the intrinsic parameters, followed by calibrating only the ex-ternal parameters against the full set (all 66 frames) providing the standard deviation and maximum reprojection error. If either of these exceeded its threshold we labeled the run a failure (outlier), otherwise we included the standard deviation error in the average for a set size of 2 and likewise included the maximum error in the average for a set size of 2. After performing 10 such tests, we incremented the set size to 3, 4, 5, etc up to a set size of 30.
For all six cameras set sizes of 2-30 frames were tested. The full set size was 66 frames for the Camedia camera, 44 frames for the Dragonfly with an 8mm lens, 47 frames for the Intel Pro webcam, 68 frames for the Powershot at the longest focal length setting, 49 frames for the medium focal length, and 63 frames for the short focal length. The ARTag marker centers were used for correspondence points, there were an average of 57, 56, 35, 21, 29, and 50 points/frame respectively for these full sets.
These results are shown in Figs 6 and 7. The x-axis is the number of frames in a set, the top plot for each camera is the average standard deviation error, the middle is the average maximum error, and the bottom is the number of outlier (failed) calibration runs. Note the correspondence with the longer focal length (narrower FOV) and the number of frames required.
Table 2 demonstrates this, three different cameras were calibrated with only 10 image frames and the calibration results analyzed. Five or six runs of 10 frames each were conducted with each camera, using entirely different images. Firstly, one can see qualitatively the consistency of calibration parameters between runs. Secondly the reprojection error, in standard deviation and maximum form, is displayed for only the points in the 10-frame set (first error column) and with the full set (second error column). The results for the Dragonfly (8mm lens#1) camera are slightly consistent, but that is to be expected from the longer focal length and the results shown in Fig. 7.
Figure 6: Camedia and Intel Ipro cameras: calibration accuracy vs set size.
3
Comparison of ARTag System and OpenCV Grid
Finder
The OpenCV grid finder function cvFindChessBoardCornerGuesses() can be used to automatically find correspondences between image and calibration plane coordinates for camera calibration.
The function starts with converting the input image into a gray scale image fol-lowed by thresholding to obtain a binary image. It then finds contours from the binary image and extracts all the contours with exactly four sides. The corners of those four-side contours are considered to be the corners of the chessboard. They are ordered into a grid based on their geometric proximity.
The function often does not recognize all the points as discussed earlier. The images must have low radial distortion, the grids must be completely visible, the lighting has to be good for the thresholding step to succeed, and other factors have to be right. In general, the detection can be unreliable and we found many images had to be captured so that enough grids could be found for calibration. Fig. 2 shows eight sample images. Table 3 shows some sample results of how often grids are located, images are taken with 12 cameras of a 8x10 pattern. The pattern was well in the middle of the view and close to perpendicular to the camera axis, however, the grids are not detected in all the images. The average number of corners found (should be 80 for a 8x10 array) and percentage of successful grid extractions are shown.
Figure 7: Dragonfly IEEE-1394 and Powershot S60 digital camera: calibration accu-14
where correspondences are found in all images, there is no requirement to see the full pattern. With our ARTag-based system, every image taken with reasonable lighting, focus, and lack of motion blur produces at least some correspondences. The ARTag markers have a very low false detection rate, compared to the many false corners detected by cvFindChessBoardCornerGuesses() if the scene around the pattern is cluttered. Also, ARTag markers can be detected to almost 85◦ from the normal
whereas we could not get cvFindChessBoardCornerGuesses() to find markers past 60◦ from the normal.
The necessity of having the entire grid visible for any correspondences to be found limits the potential accuracy of calibration. Zhang’s method requires multiple views with different perspectives and it is difficult to get too many views where the points stretch well into the image corners, where the distortion is greatest and in most need of calibration. In contrast, our method allows the pattern to be larger than the field of view so that any view has pattern points seen throughout the image.
A possible problem with cvFindChessBoardCornerGuesses() and similar checker-board schemes such as [11] is a probable intrinsic weakness in using intersections corners. As discussed in Section 2.1, blurring and other lens and aperture effects can cause the brighter image areas to expand causing bridges of white or black pixels to cross the intersection point for bright and dim lighting respectively, this can result in two corners being detected instead of one (see experiments of Section 3.2). Pho-togrammetrists, being more concerned with accuracy, prefer circular dot fiducials to corners. Under perspective projection, a circle projects to an ellipse, and the center of ellipse can be estimated with subpixel accuracy [9].
People are using cvFindChessBoardCornerGuesses() to find correspondences for calibration and other applications such as finding correspondences between multiple cameras to calibrate extrinsic parameters [6], find fundamental matrices, tensors, etc. Users of cvFindChessBoardCornerGuesses() tend to keep the pattern dimensions down to a small number of corners, such as a 4×5 array; this increases the probability of the grid being detected since the odds of all corners being found and aligned is higher with a smaller number of corners. However, this reduces the number of correspondence points available per image frame.
Also, users of cvFindChessBoardCornerGuesses() often keep the array small in the camera view, occupying about 1/3 of the image width. This reduces the chance that the radial distortion will curve the corners from appearing in straight lines, increasing the probability of detection. The pattern can be imaged in different parts of the camera image to cover different parts of the field of view. The drawback is that correspondences in these different areas of the field of view cannot be found simultaneously, unlike with our ARTag-based system where markers
Calibrating a camera by imaging the checkerboard pattern confined to 1/3 of the image width does provide calibration results, however they are not as accurate as our
system can provide. Tables 4 and 5 show some calibration results using a checker-board with 8x10 interior corners and 4x5 interior corners respectively. The intrinsic parameters are found using the points from these images, the reprojection error is calculated using both these points (second last column titled “subset”) and when evaluated using the full set of points from previous experiments (last column titled “full set points”). Attempts were made to calibrate five cameras with the 8x10 and 4x5 checkerboard patterns. With the 8x10 patterns, the calibration grids were only detected in images from the Pixelink and Camedia cameras and only those could be calibrated (Table 4). More grids were detected with the 4x5 patterns and calibration grids were found with 4/5 of the cameras tested, the grids were not detected in images from the CS120 webcam only.
Looking at Tables 4 and 5 we see superior calibration results (lower “full set points” reprojection error) in the 8x10 array. The downside is of course that it could only calibrate 2/5 of the cameras.
When comparing the results of Tables 4 and 5 to Table 1 we see our ARTag-based method produces superior accuracy.
3.1
Comparing Accuracy with ARTag Corners, ARtag
Cen-ters, OpenCV Grid Finder, and Circular Dots
Another experiment was performed to directly compare the ARTag corner and center methods, the OpenCV grid finder (cvFindChessBoardCornerGuesses() function), and the traditional circular dot array used in calibrating cameras. The planar array of dots was used as a benchmark to compare the ARTag and cvFindChessBoardCorner-Guesses() methods against, the dots were painstakingly identified in the images with manual techniques and the centroid found 1 for a thresholded image of each dot.
This allows comparison against what is likely the most common camera calibration method.
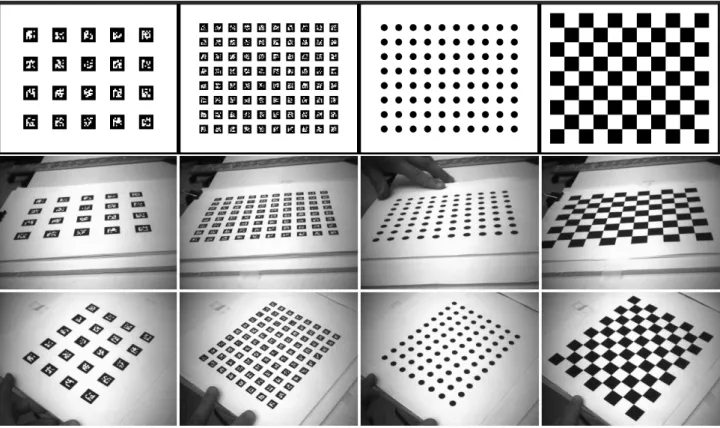
To fairly compare the four methods, identical poses were captured for each method. The cameras were mounted on tripods and the four calibration patterns were hinged together so they could be changed without changing the pose. The same number of images were taken for each method, for each of 6 cameras. The marker points are in the same positions in each image locations, all have 8 rows of 10 columns of points. Each point corresponds to a marker corner in the ARTag corner method, to a marker center in the ARTag center method, to a dot center in the circular dot method, and to an inner corner in the checkerboard pattern for detection by cvFindChessBoardCornerGuesses(). The experiment setup is shown in Fig. 8.
The results are shown in Table 6. The circular dots were all found manually and
so have a 100◦ detection rate of grid, and the full 80 points found in each image. The
ARTag markers were detected in all the frames with varying number of correspon-dence points. With all the four array types, the reprojection error was calculated by projecting onto a larger set of points as described above - the error within the points found for a calibration run can give deceptively low error. The ARTag system achieved equal or better accuracy than the circular dot method but was performed in seconds as opposed to several hours for manually locating and verifying the dot centroid locations. The cvFindChessBoardCornerGuesses() function provided infe-rior calibration results, this could be due to the less number of calibration grids that were found, and/or a possible intrinsic weakness in using intersections corners.
3.2
Sensitivity to Lighting and Focus
With all these methods each correspondence’s location is determined by the position of borders or corners which can be susceptible to the effects of the non-ideal prop-erties of real cameras and lenses with respect to lighting change and blur. With an ideal pinhole a bright point in the scene maps to a single image plane point, how-ever with a finite aperture size and defocus the image plane point expands. With increasing irradiance and binary theshold decisions to find lines, corners and circu-lar blobs, light/dark edges tend to move towards the darker side, corners on dark ARTag markers move inwards, and dark circular blobs shrink. Lighting and focus thus affect the image coordinates in the correspondence points used for calibration. With the greyscale Dragonfly camera ARTag marker corners moved by up to 1.5 pix-els between light and dark exposures. The centroid of circular dots and the centers of ARTag markers move less due to the cancelling effects of the different sides and corners. Also, the intersection point at the checkerboard corners will turn into two corners as either the opposite white or black squares merge due to bright or dim lighting. The OpenCV CheckerBoardGuesses() function averages the distance be-tween these two nearby corners found as endpoints of sides of closed quads, however it is not clear how the following sub-pixel corner find operation will affect the reported position.
Therefore we would expect to see the calibration results to be affected by increasing light and lens/aperture non-ideal properties. We expect to see the ARTag corner positions move more than the centers, and we are unsure of how the OpenCV grid finder will respond. This was examined in an experiment where calibrations were performed at different exposure settings. With the Dragonfly IEEE-1394 camera it is possible to turn off the automatic shutter control and override it with a manual setting from 0.25 to 60ms. We took 16 different exposure settings in this range at each of 20 camera-pattern poses and separated the images into 16 separate calibration runs. This experiment was performed both with the meddite ARTag array and a 4x5
Figure 8: Comparison of calibration using ARTag corner, ARTag center, circular blobs, and checkerboard method using identical poses and locations of correspondence points. An array was made for each method and used to calibrate each camera, each array has 10 x 8 points located in the same position, the first row shows the array patterns. 10-30 images were taken of each array maintaining the camera pose (the array patterns were hinged together) between imaging the four arrays. The second and third rows above show all images for a single pose using the Dragonfly 8mm cam-era. The first column shows ARTag marker corners being used as the correspondence points, the second column shows ARTag marker centers being used, the third column shows circular blobs being used, and the fourth column shows interior corners in the checkerboard pattern used with the OpenCV CheckerBoardGuesses() function. The results are shown in Table 6.
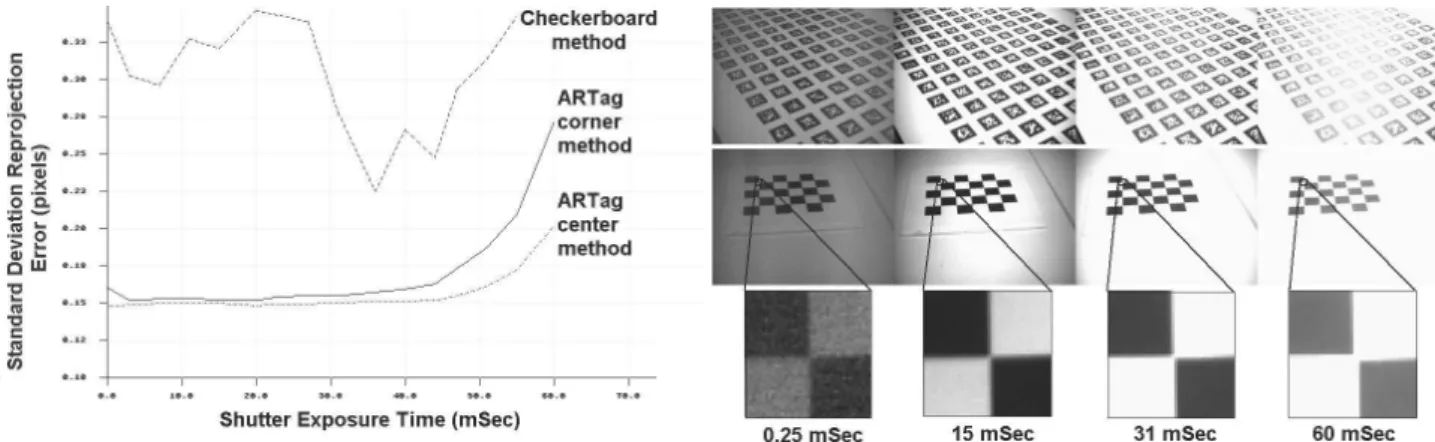
checkerboard image. We also took 35 images with the normal auto-shutter of the ARTag meddite array and used the marker centers as the “full set” for evaluating the 16 calibration runs with each system. Fig. 9 shows some images from the ARTag and checkerboard image sets. Four images from a single pose are shown for both the ARTag and checkboard array, some close-ups of a corner as it changes with shutter setting is shown.
This provided us with two groups of images, one for the ARTag array and one for the checkerboard array. Each group contains 16 sets of 20 images, each set being from a different shutter setting. Correspondences in the checkerboard group are found with the OpenCV CheckerBoardGuesses() function. For the ARTag array, correspondences are found for both the center and corner methods. The intrinsic parameters are found for each of the three methods for each shutter setting and the accuracy evaluated by reprojecting to the “full set” of points.
Fig. 9 shows a plot of the results, the ARTag center method shows a flatter, i.e. less sensitive response to lighting than the ARTag corner approach. The bottom of the ARTag corner curve is in the region of the 18ms which the automatic shutter chose with the lighting reflected off the ARTag array when auto-shutter was turned back on. The OpenCV grid finder provides a more erratic response, possibly due to only about 50% of images having the grid extracted, but the accuracy does seem to be higher closer to the 30ms shutter setting chose by the auto-shutter mode. Our hypothesis of the ARTag center method being less sensitive to the ARTag corner method was verified, and both were found to be less sensitive than the checkerboard method.
4
Conclusions
Calibrating cameras is a time consuming task despite the availability of calibration algorithms and software. This paper introduced a system where a camera can be calibrated fully automatically by simply taking images aimed at a self-identifying pattern. A system was created to robustly find correspondences using the ARTag self-identifying fiducial markers, this was input to the OpenCV implementation of Zhang’s coplanar calibration algorithm. Experiments were performed calibrating sev-eral cameras in a short period of time with no manual intervention.
It was found that when using ARTag markers for a calibration target, the best calibration results are achieved by using the marker center instead of each corner, thus providing only one correspondence per marker instead of four. This is assumed to be analoguous to using the centroid of a circular dot, the center will move less with blooming and defocus than will a marker or dot’s edges.
Figure 9: Sensitivity of calibration accuracy due to lighting and non-ideal lens and aperture qualities. The camera shutter was manually controlled in 16 settings from 0.25ms (dark exposure) to 60ms (bright exposure) at each of 20 pose positions for both the ARTag and checkerboard array. Due to the point spread function) corners move with increased lighting and defocus, the results show that the ARTag center method is less sensitive to the lighting (shutter setting) than either the ARTag corner or OpenCV grid finder.
as suitable for automatic accurate calibration since it functions well only when the array is small compared to the size of the image, and cannot fill the full extent of the image as is needed for accurate calibration as that the non-linear radial and thin prism distortion effects manifest themselves with greatest magnitude away from the image center. It was shown that the grid was often not detected when the pattern filled the image, and the grid had to be small relative to the image for repeatable enough detection to allow calibration. Both arrays with 8x10 and 4x5 intersection points were tested, both had inferior accuracy relative to our ARTag-based system. The 8x10 checkerboard grid provided better accuracy than the 4x5 grid however the grid was detected less often so that less camera types were successfully able to be calibrated.
A summary of the comparison between the OpenCV grid finder and the new ARTag based system is that the ARTag system provides more accurate intrinsic pa-rameters, verified by several experiments. We hypothesize that the increased accuracy is due to two reasons; more calibration points are found due to a more robust pattern detection, and these points extend further into the image corners. The ARTag system can use a pattern that extends beyond the camera view so that correspondences more completely fill the image, and utilizes all the input images (with reasonable lighting and focus/blur conditions). The OpenCV grid finder’s “all or nothing” approach where all points in the calibration grid must be recognized causes many images to be unusable with zero correspondences provided.
A comparison was performed with identical numbers of images, points and their locations with identical camera-pattern poses for four methods; the ARTag center method, the traditional circular dot method with manually located points, and a 8x10 checkerboard pattern. Equivalent accuracy was achieved with the ARTag center method relative to the manual circular dot method, and the checkerboards detected with cvFindChessBoardCornerGuesses() provided the poorest calibration results.
Experiments were performed to evaluate the sensitivity of calibration to effects of lighting variation and non-ideal lens and aperture properties, the ARTag center method was less sensitive to the ARTag corner method, and both were found to be less sensitive than the checkerboard method.
Regarding how many frames are necessary for a good calibration, it was deter-mined experimentally that reasonable calibration results can be obtained with as 10 frames for most cameras, but that a recommended number of frames is 15 or 20.
Our system showed how an array of ARTag self-identifying patterns can be used for a fully automatic camera calibration system. With this system, a camera can be calibrated automatically with a high degree of accuracy in a few minutes.
References
[1] Open source comptuer vision library. In http: // www. intel. com/ research/
mrl/ research/ opencv.
[2] M. Fiala. Artag, an improved marker system based on artoolkit. In National Research Council Publication NRC 47166/ERB-1111, 2004.
[3] M. Fiala. Artag revision 1, a fiducial marker system using digital techniques. In National Research Council Publication 47419/ERB-1117, November 2004. [4] M. Fiala. Artag, a fiducial marker system using digital techniques. In CVPR’05,
volume 1, pages 590 – 596, 2005.
[5] M. Fiala. Fiducial marker systems for augmented reality: Comparison between artag and artoolkit. In MIRAGE 2005 :Computer Vision/Computer Graphics Collaboration for Model-based Imaging, Rendering, image Analysis and Graphical special Effects, INRIA Rocquencourt, France, Mar 2005.
[6] S. Gilbert, R. Laganire, and G. Roth. Stereo motion from feature matching and tracking. In IEEE Instrumentation and Measurements Technology Conference, pages 1246–1250, Ottawa, Canada, 2005.
[7] I. Poupyrev H. Kato, M. Billinghurst. ARToolkit User Manual, Version 2.33. Human Interface Technology Lab, University of Washington, 2000.
[8] R. Hartley and A. Zisserman. Multiple view geometry in computer vision. Cam-bridge, UK, 2000. Cambridge University Press.
[9] Janne Heikkil¨a. Geometric camera calibration using circular control points. IEEE Transactions on Pattern Analysis and Machine Intelligence, 22(10):1066–1077, October 2000.
[10] Q. Luong and O. Faugeras. Self-calibration of a moving camera from point correspondences and fundamental matrices. 22(3):261–289, 1997.
[11] Chang Shu, Alan Brunton, and Mark Fiala. Automatic grid finding in calibra-tion patterns using Delaunay triangulacalibra-tion. Technical Report NRC-46497/ERB-1104, National Research Council of Canada, Institute for Information Technol-ogy, 2003.
[12] L. Soh, J. Matas, and J. Kittler. Robust recognition of calibration charts. In IEE 6th International Conference on Image Processing and Its Applications, volume 2, pages 487–491, 1997.
[13] R. Tsai. An efficient and accurate camera calibration technique for 3d machine vision. In CVPR, pages 364–374, 1986.
[14] O. Faugeras Z. Zhang, R. Deriche and Q. Luong. A robust technique for matching two uncalibrated images through the recovery of the unknown epipolar geometry. Artificial Intelligence, 78(1-2):87–119, 1995.
[15] Z. Zhang. A flexible new technique for camera calibration. IEEE Transactions on Pattern Analysis and Machine Intelligence, 22(11):1330–1334, November 2000.
Sequence K matrix Distortion Parameters Re-projection Error Std. Dev / Maximum # Avg. Fx Fy uo vo k1 k2 p1 p2 Center Corner
Frms Pts/Frm Set Points
Camedia Olympus E20 with 9 - 36 mm zoom lens (640 x 480 pixels)
66 57 1329.63 1330.01 317.42 235.81 -0.0613 0.3790 -0.0005 0.0006 0.14/1.97 0.30/10.40 Pixelink A-654 with 16mm lens (1280 x 1024 pixels)
22 84 2165.72 2203.61 658.13 517.77 -0.1128 -0.3241 -0.0032 0.0016 0.27/2.72 0.39/5.99 Powershot S60 Long focal length (640 x 480 pixels)
68 20 1796.56 1795.39 309.09 241.11 0.0689 -0.6264 0.0008 -0.0019 0.19/2.55 0.49/7.67 34 37 1784.63 1775.58 317.31 238.10 0.0480 0.0479 -0.0014 -0.0005 0.19/2.02 0.41/5.79
Powershot S60 Medium focal length (640 x 480 pixels)
49 27 1159.63 1158.63 315.94 237.93 -0.0512 0.1691 -0.0009 -0.0013 0.17/2.13 0.31/6.1 Powershot S60 short focal length (640 x 480 pixels)
63 48 531.70 531.46 322.45 243.19 -0.1448 0.1090 0.0005 0.0006 0.14/1.64 0.25/4.64 Point Grey Research Dragonfly IEEE-1394 camera with 4mm lens #0 (640 x 480 pixels)
49 66 525.86 525.84 339.19 261.77 -0.3872 0.1325 0.0005 0.0004 0.18/3.47 0.30/8.72 Point Grey Research Dragonfly IEEE-1394 camera with 4mm lens #1 (640 x 480 pixels)
74 51 530.58 530.74 332.03 273.24 -0.3871 0.1320 0.0005 -0.0004 0.16/2.20 0.29/9.04 Point Grey Research Dragonfly IEEE-1394 camera with 6mm lens (640 x 480 pixels)
50 38 885.06 888.99 344.80 260.17 -0.1814 0.1978 0.0013 0.0016 0.17/2.26 0.37/6.61 Point Grey Research Dragonfly IEEE-1394 camera with 8mm lens #0 (640 x 480 pixels)
44 55 1097.63 1100.41 327.69 256.40 -0.0523 -0.0883 -0.0023 -0.0019 0.13/1.62 0.35/7.28 Point Grey Research Dragonfly IEEE-1394 camera with 8mm lens #1 (640 x 480 pixels)
51 43 1098.57 1098.72 328.52 253.92 -0.0677 -0.0473 -0.0021 -0.0007 0.15/2.80 0.28/6.6 Point Grey Research Dragonfly IEEE-1394 HICOL camera with C-mount 16mm lens #1 (1024 x 768 pixels)
23 60 3502.10 3503.28 539.43 362.55 -0.1690 1.6502 -0.0006 -0.0032 0.44/4.78 0.85/20.50 Creative Webcam Live Ultra For Laptops USB 2.0 Webcam (640 x 480 pixels)
35 62 520.90 521.24 332.92 277.33 -0.2968 0.0903 -0.0006 -0.0020 0.16/1.97 0.25/6.66 Logitech Quickcam Pro 4000 USB 2.0 Webcam (640 x 480 pixels)
25 31 795.39 793.86 373.12 255.62 0.1260 -0.0840 -0.0006 0.0043 0.30/1.86 0.73/13.13 25 37 786.26 789.44 373.26 271.22 0.1227 -0.0660 0.0028 0.0049 0.29/2.62 0.63/5.8 50 34 790.89 791.27 372.97 262.95 0.1238 -0.0722 0.0010 0.0046 0.30/2.59 0.68/13.4
Intel CS120 Easycam (320x240 pixels)
40 16 435.33 442.29 157.82 172.09 0.6612 -2.9329 0.0076 -0.0034 17.1/146.7 0.40/7.5 25 17 461.61 465.96 160.79 124.00 0.6531 -2.8174 -0.0031 -0.0014 0.34/2.28 0.53/9.1 29 17 26.66 121.13 -90.57 505.78 -0.0022 0.0000 0.0005 0.0105 1010 /1010 0.48/5.00 47 22 453.48 457.55 163.71 130.80 0.6222 -2.4422 -0.0039 0.0017 0.22/1.85 0.35/4.53
Intel Pro webcam (640 x 480 pixels)
47 33 846.85 847.53 322.42 232.31 -0.0060 -0.1462 0.0020 -0.0017 0.22/1.77 0.42/5.11 48 29 848.54 847.28 322.44 228.40 -0.0162 -0.0767 0.0024 -0.0018 0.25/2.46 0.54/8.62
SONY 999 NTSC camera captured with ATI PCI framegrabber (640 x 480 pixels)
40 59 633.87 620.20 304.13 240.31 -0.2034 0.1060 -0.0002 -0.0003 0.13/1.25 0.27/5.06 Single-board X10 greyscale NTSC camera captured with ATI PCI framegrabber (640 x 480 pixels)
27 31 632.60 616.31 346.58 239.30 -0.4231 0.1764 -0.0002 0.0000 0.19/1.21 0.39/4.72 26 32 632.04 616.23 347.64 240.47 -0.4198 0.1750 -0.0007 -0.0001 0.20/1.64 65.45/901.98
NTSC camcorder Sharp VL-AH150U captured with ATI PCI framegrabber (640 x 480 pixels)
29 32 745.73 726.79 306.63 231.89 -0.2151 0.3351 0.0000 0.0013 0.25/2.77 0.57/10.62 47 22 864.01 753.82 384.74 140.92 -0.3158 0.0152 0.0756 -0.0002 30.8/356.3 26.3/381.3
Table 1: Calibration Using OpenCV cvCalibrateCamera() function with points ex-tracted automatically using the ARTag pattern array (mounted on the meddite panel) with two methods; using the marker center as a correspondence point, or using all four corners (2nd last and last column show respectively show error). Calibration pa-rameters are shown for the center method, only error is shown for the corner method.
Sequence K matrix Distortion Parameters Re-projection Error Std. Dev / Maximum # Avg. Fx Fy uo vo k1 k2 p1 p2 Subset Full Set
Frms Pts/Frm Points
Camedia Olympus E20 with 9 - 36 mm zoom lens (640 x 480 pixels) - ARTag center method
10 64 1331.02 1331.32 315.63 234.32 -0.0745 0.5360 -0.0003 0.0002 0.12/1.19 0.14/1.99 10 58 1323.99 1318.46 324.40 239.69 -0.0375 0.0705 -0.0002 0.0029 0.12/1.19 0.15/1.89 10 46 1319.20 1328.02 316.48 259.98 -0.0822 0.5427 -0.0011 0.0004 0.13/1.68 0.15/1.88 10 60 1324.77 1322.48 322.81 240.47 -0.0543 0.3123 -0.0009 0.0023 0.14/1.85 0.15/1.90 10 70 1334.85 1332.93 315.55 223.41 -0.0474 0.2750 -0.0004 -0.0000 0.16/2.03 0.15/2.04 10 43 1334.30 1321.36 297.01 210.90 -0.0284 -0.2354 -0.0014 -0.0040 0.16/1.00 0.16/2.10
Dragonfly IEEE-1394 camera with 8mm lens #1 (640 x 480 pixels) - ARTag center method
10 42 1076.85 1117.15 327.68 310.38 -0.0506 -0.1185 -0.0067 -0.0001 0.19/2.88 0.52/5.22 10 54 1094.95 1097.97 330.77 259.02 -0.0733 0.0056 -0.0029 -0.0003 0.16/2.77 0.15/2.77 10 41 1099.22 1098.37 335.90 251.96 -0.0884 0.0630 -0.0017 0.0001 0.11/0.98 0.17/2.71 10 37 1099.71 1098.79 322.86 258.59 -0.0729 0.0912 -0.0004 -0.0027 0.13/1.26 0.16/2.93 10 44 1096.88 1102.26 323.20 260.42 -0.0692 -0.0500 -0.0026 -0.0017 0.15/1.10 0.16/2.88
Intel Pro webcam (640 x 480 pixels) - ARTag center method
10 30 853.47 856.51 324.55 231.07 0.0005 -0.1876 0.0032 -0.0018 0.18/1.24 0.23/1.23 10 39 847.71 846.36 319.60 228.48 0.0034 -0.2178 0.0022 -0.0024 0.21/1.18 0.22/1.18 10 34 845.40 853.41 323.09 239.31 -0.0058 -0.1064 0.0019 -0.0012 0.22/1.41 0.22/1.41 10 28 838.42 841.23 325.08 241.79 -0.0143 -0.1237 0.0010 -0.0005 0.23/1.65 0.23/1.65 10 35 851.01 848.67 326.89 223.14 -0.0330 0.0075 0.0032 0.0001 0.25/2.13 0.25/2.64 10 26 855.75 848.68 328.14 212.26 -0.0501 0.1393 0.0013 -0.0001 0.29/2.20 0.25/2.39
Table 2: Accuracy of calibration with only 10 frames. The first column of reprojection error is that seen within just those 10 frames, the second column is the reprojection error when the intrinsic parameters were evaluated over the full set of frames. All runs were performed with 10 different frames and used the ARTag marker center method. The consistency of parameters between runs can be seen.
Camera average % Grids Camera average % Grids Camera average % Grids corners located corners located corners located Pixelink A-654 80 100 HICOL Dragonfly 53 40 Intel Pro 76 80 Dragonfly 4mm 67 0 Creative Ultra 80 60 X10 NTSC 75 80 Dragonfly 6mm 70 40 Logitech 4000 56 40 SONY 999 NTSC 61 40 Dragonfly 8mm 70 0 Intel CS120 66 60 Telemax WC/50 63 40
Table 3: Grid detection results using OpenCV CheckerBoardGuesses() function. Im-ages with the complete checkerboard visible are captured for each of 12 cameras. The average number of corners found, plus the percentage of the five for which the entire grid is found are shown. Some of the images are shown in Fig. 2.
Sequence K matrix Distortion Parameters Re-projection Error Std. Dev / Maximum # Avg. Fx Fy uo vo k1 k2 p1 p2 Subset Full Set
Frms Pts/Frm Points
Pixelink A-654 with 16mm lens (1280 x 1024 pixels) - cvFindChessBoardCornerGuesses() method 8x10 grid
12 80 2181.54 2172.08 659.57 499.60 -0.1501 -0.6800 0.0012 0.0007 0.13/1.20 0.54/1.32 Dragonfly IEEE-1394 camera with 8mm lens #1 (640 x 480 pixels) - cvFindChessBoardCornerGuesses() method 8x10 grid 22 80 1121.91 1119.69 363.06 234.38 -0.0411 -0.1045 -0.0034 0.0117 0.11/1.04 0.28/2.17
Table 4: Calibrating using the cvFindChessBoardCornerGuesses() method with a 8x10 grid where the checkerboard only fills 1/3 of the field of view. Only the Dragonfly 8mm camera produced images where sufficient frames where grids could be detected. With the CS120 webcam, no corners were detected despite a sharp image, with the Intel Pro webcam an average of 32 corners were found per frame but none with grids extracted. An average of 46 corners/frame were also found with the high resolution Pixelink A654, and grids were extracted in 12/51 frames. Thus of the four, only two could be calibrated.
Sequence K matrix Distortion Parameters Re-projection Error Std. Dev / Maximum # Avg. Fx Fy uo vo k1 k2 p1 p2 Subset Full Set
Frms Pts/Frm Points
Pixelink A-654 with 16mm lens (1280 x 1024 pixels) - cvFindChessBoardCornerGuesses() method 4x5 grid
25 20 2209.35 2203.71 668.56 437.21 -0.1785 -0.4815 -0.0043 -0.0032 0.12/0.89 0.84/9.90 Dragonfly IEEE-1394 camera with 8mm lens #1 (640 x 480 pixels) - cvFindChessBoardCornerGuesses() method 4x5 grid 22 20 1145.43 1136.73 310.62 162.15 -0.0084 -0.1572 -0.0171 -0.0053 0.08/0.44 0.42/3.10
Intel Pro webcam (640 x 480 pixels) - cvFindChessBoardCornerGuesses() method 4x5 grid
22 20 869.88 865.83 322.43 212.08 -0.0092 -0.0982 -0.0015 -0.0037 0.09/0.48 0.41/3.18 Logitech Quickcam Pro 4000 USB 2.0 Webcam (640 x 480 pixels) - cvFindChessBoardCornerGuesses() method 4x5 grid 11 20 804.14 801.39 357.00 226.49 0.1293 -0.0608 -0.0191 -0.0051 0.09/0.50 0.37/2.93
Table 5: Calibrating using the cvFindChessBoardCornerGuesses() method with a 4x5 grid where the checkerboard only fills 1/3 of the field of view. Checkerboard grids were found in 25/30 frames taken with the Pixelink A654, in 23/25 frames with Dragonfly (8mm lens #1), in 24/25 with the Intel Pro webcam, and in 11/25 frames taken with the Logitech 4000. None (0/25) were found with the CS120 webcam.
Camera ARTag corners ARTag centers Circular blobs checkerboards % avg. Reproj. % avg. Reproj. % avg. Reproj. % avg. Reproj. det. pts error det. pts error det. pts error det. pts error Pixelink A-654 100 80 79.4/865 100 77 1.30/9.03 100 80 5.24/48.9 92 79 1.12/7.81 Powershot S60 100 76 0.55/3.55 96 37 0.43/3.23 100 80 0.49/3.81 13 63 0.72/5.86 Dragonfly 8mm 100 79 0.18/2.00 100 68 0.32/2.43 100 80 0.27/1.99 6 69 46.1/477 HICOL Dragonfly 100 80 0.78/9.45 100 63 1.44/9.56 100 80 1.19/8.37 40 60 1.65/13.7 Creative Ultra 100 79 0.45/3.55 100 48 0.50/5.78 100 80 0.62/5.93 58 78 0.99/10.7 Intel Pro 100 78 0.46/3.54 100 45 0.51/3.92 100 80 0.47/3.65 14 60 20.2/301
Table 6: Comparison of calibration using ARTag corner, ARTag center, circular blobs, and checkerboard methods. An array was made for each method and used to cali-brate each camera. The ’% det.’ column is the percentage of frames for which the calibration grid could be extracted, the ’avg. pts’ column is the average number of points used in each successfully detected grid (maximum 80), and the reprojection error is shown as standard deviation / maximum in the ’error’ column. The arrays are aligned so that they have the same number of correspondence points (80) in the same locations. For each pose each array is placed in the same location without moving the camera, the cameras and each pose are chosen to give the best chances of the OpenCV CheckerBoardGuesses() function working. Several (15-40) poses are used to generate a set of correspondences for each camera and array. The instrinsic calibration parameters determined using each camera and array are evaluated for re-projection error using a larger set of correspondences (ARTag marker centers) from experiment 1 (Table. 1) Some of the images are shown in Fig. 8.