HAL Id: hal-01312469
https://hal.archives-ouvertes.fr/hal-01312469
Submitted on 6 May 2016
HAL is a multi-disciplinary open access archive for the deposit and dissemination of sci-entific research documents, whether they are pub-lished or not. The documents may come from teaching and research institutions in France or abroad, or from public or private research centers.
L’archive ouverte pluridisciplinaire HAL, est destinée au dépôt et à la diffusion de documents scientifiques de niveau recherche, publiés ou non, émanant des établissements d’enseignement et de recherche français ou étrangers, des laboratoires publics ou privés.
in the Southern Indian Ocean
K Delord, C Barbraud, C-A Bost, Y Cherel, C Guinet, H Weimerskirch
To cite this version:
K Delord, C Barbraud, C-A Bost, Y Cherel, C Guinet, et al.. Atlas of top predators from French Southern Territories in the Southern Indian Ocean. [Research Report] CNRS. 2014, http://www.cebc.cnrs.fr/ecomm/Fr_ecomm/ecomm_ecor_OI1.html. �hal-01312469�
Territories in the Southern Indian Ocean
K. Delord, C Barbraud, C-A Bost, Y Cherel, C Guinet & H Weimerskirch
Centre d’Études Biologiques de Chizé, UPR 1934 du Centre National de la Recherche Scientifique, UMS 3462 - PELAGIS, 79360 Villiers-en-Bois, France
Based on the tracking data base PELAGIS, data owners: C-A Bost: penguins
C Guinet : seals
H Weimerskirch: albatrosses, petrels, skuas
Fundings:
The long-term monitoring programs on seabirds and seals are funded by the French Polar Institute – Paul-Emile Victor (IPEV: programs n° 109 ORNITHOECO: Oiseaux et mammifères marins sentinelles des changements globaux dans l’océan Austral, resp. H Weimerskirch; and n°394 OISEAUX
PLONGEURS: Stratégie énergétique des prédateurs marins et variabilité physique et trophique de l’océan Austral: étude en mer, resp : C-A Bost).
This work integrates distribution data obtained as part of scientific programs funded by ANR 07 Biodiv "Glides - Distribution en mer et conservation des oiseaux antarctiques", resp: C-A Bost; ANR VMC 07 IPSOS-SEAL "Investigation of the vulnerability of the Productivity of the Southern Ocean Subsystems to climate change : the Southern Elephant seal Assessment from mid to high Latitudes", resp: C. Guinet; ANR REMIGE "Réponses comportementales et démographiques des prédateurs marins de l’océan Indien aux changements globaux environnementaux", resp: H. Weimerskirch ; Zones Atelier "Recherches sur l’Environnement Antarctique et Subantarctique", resp: M. Lebouvier ; the Prince Albert II de Monaco Foundation “Conservation des espèces menacées d’albatros et de pétrels de l’Océan Indien sud”, resp: H. Weimerskirch. The observatory Mammifères Explorateurs du Milieu Océanique, MEMO SOERE CTD 02). This work is also carried out in the framework of CNES-TOSCA program (‘Élephants de mer océanographes’) and Argonautica (CLS). This work also beneficiates from the Total Fundation for financial support (on elephant seals).
The Atlas work was supported by the French Southern Territories (TAAF), the French Marine Protected Areas Agency through the program of “bio-régionalisation en vue de l’établissement d’un réseau d’aires marines protégées dans l’océan Austral, les Kerguelen, Crozet, mer Dumont d’Urville”.
2
Analysis of spatial data: K Delord, D Pinaud
Analysis of habitat modeling:
M Louzao, C Péron, B Raymond, JB Thiebot With the contribution of:
C Bon, M Louzao, C Péron, B Picard, D Pinaud, P Pinet, A Prudor, B Raymond, JB Thiébot, L Thiers
Photography
Photographers that contributed images for the Atlas:
Y Charbonnier, C.A. Bost, G Dorémus, N Gasco, T. Jeanniard du Dot, T. Lacombe, A Prudor, JB Thiébot, P Tixier, Y Tremblay
Sections:
Diet and stable isotopes : Y Cherel Penguins: C-A Bost, K Delord
Albatrosses: K Delord, H Weimerskirch
Petrels: C Barbraud, K Delord, H Weimerskirch Skuas: C Barbraud
Seals: C Guinet
Citation
Delord K., Barbraud C., Bost C.A., Cherel Y., Guinet C. & Weimerskirch H. 2013. Atlas of top predators from French Southern Territories in the Southern Indian Ocean. CEBC-CNRS. Pp 252. DOI:
10.15474/AtlasTopPredatorsOI_CEBC.CNRS_FrenchSouthernTerritories.
Acknowledgements
We thank all fieldworkers involved in logger deployment or recovery: C. Alotto, E. Antoine, D. Aurès, F. Bailleul, M. Berlincourt, P. Blanchard, M.-H. Burle, B. Callard, A. Catard, Y. Charbonnier, C. Chauvel, J. Demay, Q. Delorme, G. Dorémus, N. El Ksaby, T. Guionnet, A. Jacquet, A. Jaeger, L. Gaillard, O. Gore, T. Jeanniard du Dot , S. Jeudi de Grissac, T. Guionnet, A. Knochel, M. Kriloff, V. Lecomte, A. Lescroel, F. Lebouard, A. Lewden, M. Loubon, M. Louzao, G. Mabille, H. Mahéo, C. Marteau, J. Martin, N. Mignot, S. Mortreux, J. Nezan, M. Nevoux, D. Pardo, S. Patrick, F. Pawlowsky, M. Pellé, C. Péron, Y. Perrot, B. Planade, R. Perdriat, D. Pinaud, J.-B. Pons, T. Powolny, A. Prudor, F. Théron, S.A. Shaffer, J.-B. Thiébot,
3 M. Viviant, and especially all the personel wintering in the French Southern Territories that helped the fieldworkers. We thank D. Besson for logistical help on all the monitoring programs. We acknowledge the IPEV logistical team, particularly R. Bellec, A. Lamalle, R. Pagny, H. Pérot, A. Pottier, N. Marchand, Y. Le Meur, N. Le Viavant. We acknowledge A. Goarant for her help in developing scripts in R.
4
Executive Abstract
Penguins, albatrosses, petrels, elephant seals and fur seals are marine top predators that have to come on land to reproduce. Therefore, they are the only marine top predators that can be studied from land base sites, making them the most accessible convenient models to study marine
ecosystems. Indeed, seabirds and seals are considered as good indicators of changes in ecosystems at differential spatial and temporal scales. However, current conservation measures, which comprise relatively few impact mitigation actions and restricted protection of the sole coastal areas, are insufficient, especially for the oceanic realm. Today, there is an urgent need to identify and protect the open sea environments where seabirds and marine mammals forage.
The first stage of most conservation planning is to identify areas that warrant protection (including areas that are already protected). The main criteria used to identify such areas are biological diversity (species richness), rarity, population abundance, environmental representativeness and site area. Where distribution data are both comprehensive and accurate, it is possible to identify areas of high species richness (hotspots), focusing on threat level (endangered species).
This Atlas of top predators from the French Southern Territories in the Southern Indian Ocean is a summary of information on the use of the southern Indian Ocean by 22 seabirds and seals species: king penguin, gentoo penguin, Adélie penguin, eastern rockhopper penguin, northern rockhopper penguin, macaroni penguin, Amsterdam albatross, wandering albatross, black-browed albatross, Indian yellow-nosed albatross, light-mantled albatross, sooty albatross, southern giant petrel, northern giant petrel, southern fulmar, Cape petrel, snow petrel, white-chinned petrel, grey petrel, brown skua, southern elephant seal and Antarctic fur seal.
The distribution map of each species was obtained by the use of tracking methods that allow
identifying important areas in the southern Indian Ocean. The determination of zones of high species richness suggests several important areas for top predators. First the breeding colonies and
surrounding zones: Amsterdam and Saint Paul Islands, Marion and Prince Edward islands and the Del Cano Rise, Crozet Islands, Kerguelen Plateau and East Antarctica (Adélie Land sector). Second, the upwelling-current zones: Benguela and Agulhas Currents Systems and third several the oceanic zones: the Southwest Indian Ridge (East Bouvetøya and the North Subtropical Front), the Mid-Indian Ridge (North of Kerguelen and the Eastern Indian Ocean, the Southeast Indian Ridge (Great Australian Bight and Tasmania, Ob and Lena Banks, and East Antarctica (Prydz Bay - Queen Maud Land sectors, Adélie Land sector).
The analysis of distribution indicates that some pelagic species have a much wider foraging range outside the breeding season than during the breeding season (some disperse over very large areas, i.e. wandering albatross). This highlights the urgent need to strengthen collaborations, namely between conservation and management organisms such as CCAMLR and the fisheries organisations (RFMOs), to ensure the protection of these species and the conservation of the ecosystem that will also be beneficial for many other species.
In conclusion, although this inventory of areas of key importance is preliminary because of the lack of data on several keystone species such as burrowing petrels which could not be studied in this work, the results presented here show an unprecedented improvement in the identification of priority areas within the Southern Indian Ocean, which should be the primary targets of site-based conservation efforts in the near future. The Southern Indian Ocean is not pristine. The most serious threats are linked to industrial fishing activities, including fishery discards, bycatch of seabirds and marine mammals, as well as, in a lesser extent, degradation of marine environments through global
5 and local pollution. On land, alien introductions and diseases are now the main threats. Despite much improvement in the conservation measures taken by several fisheries, especially in the southern part of the Indian Ocean, fisheries continue to exert an important negative influence on several seabirds, especially on the high seas. However climate change is now increasingly considered to have a negative impact on seabirds at some Antarctic and sub-Antarctic localities.
6
Contenu
Executive Abstract ... 4
The Atlas and the Conservation of the Southern Indian Ocean ... 8
INTRODUCTION ... 9
The GIS Dataset ... 10
Breeding cycle of the Species in the Atlas ... 17
Breeding Sites of the Species in the Atlas ... 17
Interpreting the maps in the Atlas ... 19
Use of the Southern Indian Ocean by seabirds and seals from French Southern Territories ... 21
Diet and stable isotopes ... 24
Threats to Biodiversity ... 28
PENGUINS ... 30
Penguins of French Southern Territories in the Southern Indian Ocean ... 32
Penguins/King penguin ... 34
Penguins/Gentoo penguin... 40
Penguins/Adelie penguin ... 45
Penguins/Eastern rockhopper penguin ... 49
Penguins/Northern rockhopper penguin ... 55
Penguins/Macaroni penguin ... 58
ALBATROSSES ... 65
Albatrosses of French Southern Territories in the southern Indian Ocean ... 67
Albatrosses/Amsterdam albatross ... 69
Albatrosses/Wandering Albatross ... 75
Albatrosses/Black-browed albatross ... 86
Albatrosses/Indian yellow-nosed albatross ... 92
Albatrosses/Light-mantled albatross ... 97
Albatrosses/Sooty albatross ... 103
PETRELS ... 109
Petrels of French Southern Territories in the southern Indian Ocean ... 111
Petrels/Southern giant petrel ... 113
7 Petrels/Southern fulmar ... 126 Petrels/Cape petrel ... 132 Petrels/Snow petrel ... 138 Petrels/White-chinned petrel ... 143 Petrels/Grey petrel ... 152 SKUAS ... 157
Skuas of French Southern Territories in the Southern Indian Ocean ... 159
Skua/Brown skua ... 160
PINNIPEDS ... 165
Pinnipeds of French Southern Territories in the Southern Indian Ocean ... 167
Pinnipeds/Southern elephant seal ... 168
Pinnipeds/Antarctic fur seal ... 172
IMPORTANT MARINE AREAS AND THREATS TO BIODIVERSITY ... 176
Important Marine Areas for Biodiversity ... 176
Foraging considerations for multispecies assemblages ... 194
CONCLUSION ... 201
ANNEXES: Methodological Notes – Tables – Additional Results ... 208
Annex I: Methodological Notes ... 208
Annex II: Tables ... 216
Annex III: Additional results ... 219
SOURCES ... 231
8
The Atlas and the Conservation of the Southern Indian Ocean
Seabirds and seals are marine predators that have to come on land to reproduce. Therefore, they are the only marine predators that can be studied from land base sites, making them the most accessible convenient models to study marine ecosystems. Indeed, seabirds and seals are considered as good indicators of changes in ecosystems at differential spatial and temporal scales (Piatt and Sydeman, 2007). The presence of diverse and abundant top predators is indicative of other taxa, such as their prey (Wilson et al., 1994); (Benoit-Bird et al., 2011) or other top predators with which they associate for feeding (Ballance et al., 1997). In addition, top predators tend to congregate in highly productive areas and habitats, such as shelf slopes, seamounts and upwelling systems (Hunt et al., 1999) (Lascelles et al., 2012;Nur et al., 2010).
Seabirds and seals are widely represented across ecosystems, and their global distribution makes them especially suitable to identify import areas that cover a variety of marine ecosystems. Many of these species are highly migratory and tracking data may reveal connectivity between sites. Seabirds and seals are readily surveyed, and therefore data issued from the monitoring of these top predators are often the most abundant or even the only biological data available for some open-ocean
ecosystems.
The present Atlas focuses on seabirds and seals which breed in the French Southern Territories and Adélie Land and forage in the entire Southern Indian Ocean. It represents the first comprehensive summary of information on how some species or communities of top predators of the Southern Indian Ocean use the habitats of this immense area.
9
INTRODUCTION
The present Atlas presents the distribution of 22 species of seabirds and seals that breed in the French Southern Territories and Adélie Land and forage in the entire Southern Indian Ocean. The aim of this work is to build a comprehensive document with the most recent information available for the 22 species in the section of the Southern Ocean located between 0° and 180°E.
For each species, information concerning the area of interest is given for the following sections: i) Taxonomy ; ii) Breeding cycle, identifies breeding and non-breeding periods; iii) Conservation status, refers to BirdLife International 2012 –IUCN Red List of Threatened Species (see Sources section); Regional Breeding Sites, presents breeding sites and estimates of breeding populations in the area; Population trends, gives information on populations trends at the present time (most up-to-date available data); iv) Diet and stable isotopes, describes the food and feeding ecology by conventional means and by stable isotopes ; v) Marine distribution, presents maps of distribution for all species based on remote tracking data, important areas, and outputs from models of habitat selection; vi) Threats, synthesizes threats faced by species in the marine environment and vii) Gaps and Stakes. For the species of albatrosses and petrels listed in the ACAP (Agreement on the Conservation of Albatrosses and Petrels) the following sections Regional Breeding Sites, Population trends, Threats, Gaps and Stakes are based on the documents produced by ACAP (see references listed in Sources section).
10
The GIS Dataset
The Atlas is based on remote tracking data of key top predator species of the Southern Indian Ocean, such as albatrosses, petrels, brown skua, penguins, Antarctic fur seals and southern elephant seals. Thanks to technological developments over the last 20 years, unforeseen aspects of the behaviour of individuals at sea, such as migrations, dives and selection of habitats, can now been successfully investigated.
Three types of instruments are used in the tracking of animals: recorders for global positioning systems (GPS), satellite transmitters (Platform Terminal Transmitters, PTT) and geolocators (GLS). GPS instruments are satellite linked loggers that can record information on the position of individuals at programmable intervals down to seconds and with accuracies of metres. PTT instruments allow up to 20 localisations per day according to the locality, which are transmitted to satellites of the Argos system, with a degree of accuracy of just a 100m to a few kilometres. GLS loggers measure changes in the level of atmospheric light, and allow estimating times of sunrise and sunset and thus the duration of the day. These data are used to calculate latitude and longitude twice per day with a low accuracy (a median error of 180 km), but at low cost and long viability. For further information on remote tracking devices see Annex I: Methodological Notes.
To date (January 2013), the GIS database of the CEBC-CNRS Chizé contains more than 500 000 locations of 800 individuals tracked for 22 species of seabirds and marine mammals (Table 3). Most of these data were obtained by satellite transmitters, although GLS and GPS instruments were also deployed. The majority of the locations are within the Southern Indian Ocean, with some species distributing more widely over other Ocean basins of the Southern Ocean (e.g. wandering albatrosses from Kerguelen Island during the inter-nesting period circumnavigate Antarctica, migrating eastward over the Pacific and Atlantic, with most important areas off our area of interest in the Atlas; see Map 31). It is noteworthy to stress that several important species (e.g. diving petrels, prions, storm-petrels, Pterodroma spp. and the subantarctic fur seal Arctocephalus tropicalis) are lacking in the Atlas. For most of these species, distribution data are not available since tracking devices are still inadequate given the small body size of the species.
The Atlas is based on tracking data from adult individuals from a limited number of breeding colonies (cf Table 1, 2, 3; Annex II Table A1, A2).
11 Table 1. Species of seabirds and seals breeding in the French Southern Territories (Subantarctic and subtropical islands and Adélie Land in Antarctica) and availability of data on at-sea
distribution (individual tracking), diet and isotopic signature. Coloured cells indicate that the species breeds at the site (green; Amsterdam-Saint Paul, Crozet, Kerguelen or Adélie Land) and the availability of distribution data (blue) for the Atlas. The availability of diet and isotopic data is indicated for each species/site (Ams: Amsterdam, St Paul: Saint Paul, Cro: Crozet, Ker: Kerguelen, TA: Adélie Land).
Species Amsterdam
- St Paul
Crozet Kerguelen Adélie Land
Distribution data
Diet data Isotopic data
Eaton’s pintail Anas eatoni NA Cro Ker
King penguin Aptenodytes patagonicus Cro, Ker Cro, Ker Cro, Ker
Emperor penguin Aptenodytes forsteri NA1 TA TA
Gentoo penguin Pygoscelis papua papua Ker Cro, Ker Cro, Ker
Adelie penguin Pygoscelis adeliae TA TA TA
Eastern rockhopper penguin Eudyptes chrysocome
filholi
Cro, Ker Cro, Ker Cro, Ker
Northern rockhopper penguin Eudyptes moseleyi Ams Ams Ams
Royal penguin Eudyptes schlegeli NA
Macaroni penguin Eudyptes chrysolophus Cro, Ker Cro, Ker Cro, Ker
Wandering albatross Diomedea exulans Cro, Ker Cro, Ker Cro, Ker
Amsterdam albatross Diomedea amsterdamensis Ams Ams
Black-browed albatross Thalassarche melanophrys Ker Cro, Ker Ker
12
Grey-headed albatross Thalassarche chrysostoma NA Cro, Ker
Indian yellow-nosed albatross Thalassarche carteri Ams Ams, Cro, Ker Ams
Sooty albatross Phoebetria fusca Cro, Ams Ams, Cro Ams, Cro
Light-mantled albatross Phoebetria palpebrata Cro, Ker Cro, Ker Cro, Ker
Southern giant petrel Macronectes giganteus Cro, Ker Cro Cro
Northern giant petrel Macronectes halli Cro, Ker Cro Cro, Ker
Southern fulmar Fulmarus glacialoides TA TA TA
Cape petrel Daption capense TA Cro, TA TA
Snow petrel Pagodroma nivea TA TA TA
Great-winged petrel Pterodroma macroptera NA Cro Ker, St Paul
White-headed petrel Pterodroma lessonii NA2 Cro, Ker Ker
Soft-plumaged petrel Pterodroma mollis NA Cro, Ker Ker
Kerguelen petrel Aphrodroma brevirostris NA Cro Ker
Blue petrel Halobaena caerulea NA2 Cro, Ker Ker
Salvin prion Pachyptila salvini NA Cro
Macgillivray prion Pachyptila macgillivrayi NA St Paul
13
Thin-billed prion Pachyptila belcheri NA2 Ker Ker
Fairy prion Pachyptila turtur NA Cro
White-chinned petrel Procellaria aequinoctialis Cro, Ker Cro, Ker Cro, Ker
Grey petrel Procellaria cinerea Ker Cro, Ker Ker
Flesh-footed shearwater Puffinus carneipes NA St Paul
Little shearwater Puffinus assimilis NA
Wilson's storm-petrel Oceanites oceanicus NA Cro, TA Ker, TA
Grey-backed storm-petrel Garrodia nereis NA Cro Ker
Black-bellied storm-petrel Fregetta tropica NA Cro Ker
White-bellied storm-petrel Fregetta grallaria NA
South Georgia diving-petrel Pelecanoides
georgicus
NA Cro, Ker Ker
Common diving-petrel Pelecanoides urinatrix NA Cro, Ker Ker
Crozet shag Phalacrocorax melanogenis NA Cro
Kerguelen shag Phalacrocorax verrucosus NA Ker Ker
Black-faced sheathbill Chionis minor NA Ker
Kelp gull Larus dominicanus judithae NA Cro Ker
14
Kerguelen tern Sterna virgata NA Cro
Brown skua Catharacta antarctica lonnbergi Ker Cro, Ker Ams, Cro, Ker
South polar skua Catharacta maccormicki NA1 TA TA
Southern elephant seal Mirounga leonina Ker Cro, Ker
Antarctic fur seal Arctocephalus gazella Ams Cro, Ker Cro, Ker
Subantarctic fur seal Arctocephalus tropicalis NA Ams, Cro Ams, Cro
1
Data not included in the analysis of distribution due to the range of the location (off the area of interest for South Polar Skua) or concerning only juveniles (Emperor Penguin); 2 Data under analysis (NA2) or not available (NA)
15
Table 2. Species included in the Atlas
Noms des espèces Species names
Noms scientifiques Scientific names
Français English
Manchots Penguins
Manchot royal King penguin Aptenodytes patagonicus
Manchot papou Gentoo penguin Pygoscelis papua papua
Manchot Adélie Adélie penguin Pygoscelis adeliae
Gorfou sauteur de l’Est Eastern rockhopper penguin Eudyptes chrysocome filholi
Gorfou sauteur du Nord Northern rockhopper penguin Eudyptes moseleyi
Gorfou macaroni Macaroni penguin Eudyptes chrysolophus
Albatros Albatrosses
Albatros d’Amsterdam Amsterdam albatross Diomedea amsterdamensis
Grand albatros Wandering albatross Diomedea exulans
Albatros à sourcils noirs Black-browed albatross Thalassarche melanophrys
Albatros à bec jaune de l’Océan Indien Indian yellow-nosed albatross Thalassarche carteri
Albatros fuligineux à dos clair Light-mantled albatross Phoebetria palpebrata
Albatros fuligineux à dos sombre Sooty albatross Phoebetria fusca
Pétrels Petrels
Pétrel géant antarctique Southern giant petrel Macronectes giganteus
Pétrel géant subantarctique Northern giant petrel Macronectes halli
Fulmar antarctique Southern fulmar Fulmarus glacialoides
Damier du Cap Cape petrel Daption capense
Pétrel des neiges Snow petrel Pagodroma nivea
Pétrel à menton blanc White-chinned petrel Procellaria aequinoctialis
Pétrel gris Grey petrel Procellaria cinerea Skuas
Skua subantarctique Brown skua Catharacta antarctica lonnbergi
Pinnipèdes Pinnipeds
Eléphant de mer du Sud Southern elephant seal Mirounga leonina
16
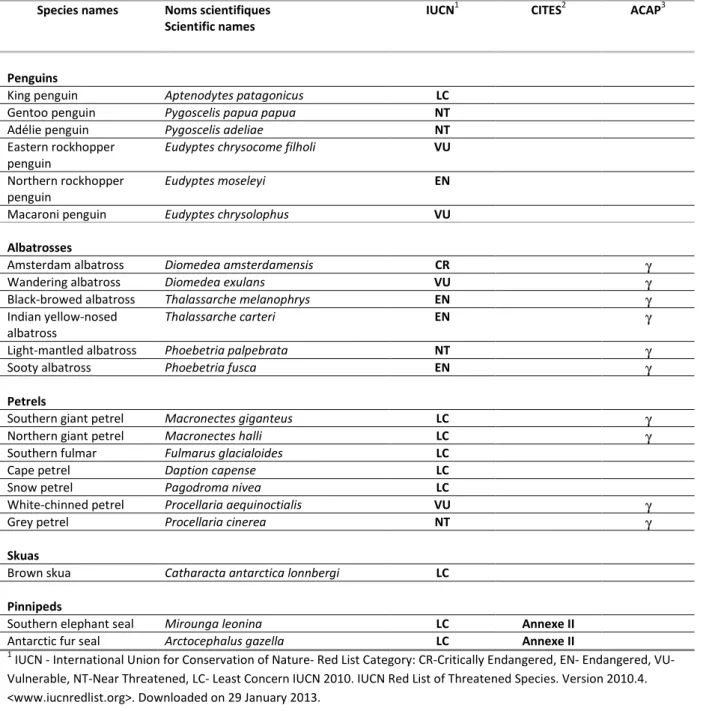
Table 3. Species included in the Atlas: conservation status and international listing
Species names Noms scientifiques Scientific names
IUCN1 CITES2 ACAP3
Penguins
King penguin Aptenodytes patagonicus LC
Gentoo penguin Pygoscelis papua papua NT
Adélie penguin Pygoscelis adeliae NT
Eastern rockhopper penguin
Eudyptes chrysocome filholi VU
Northern rockhopper penguin
Eudyptes moseleyi EN
Macaroni penguin Eudyptes chrysolophus VU Albatrosses
Amsterdam albatross Diomedea amsterdamensis CR γ
Wandering albatross Diomedea exulans VU γ
Black-browed albatross Thalassarche melanophrys EN γ
Indian yellow-nosed albatross
Thalassarche carteri EN γ
Light-mantled albatross Phoebetria palpebrata NT γ
Sooty albatross Phoebetria fusca EN γ
Petrels
Southern giant petrel Macronectes giganteus LC γ
Northern giant petrel Macronectes halli LC γ
Southern fulmar Fulmarus glacialoides LC
Cape petrel Daption capense LC
Snow petrel Pagodroma nivea LC
White-chinned petrel Procellaria aequinoctialis VU γ
Grey petrel Procellaria cinerea NT γ
Skuas
Brown skua Catharacta antarctica lonnbergi LC Pinnipeds
Southern elephant seal Mirounga leonina LC Annexe II
Antarctic fur seal Arctocephalus gazella LC Annexe II
1
IUCN - International Union for Conservation of Nature- Red List Category: CR-Critically Endangered, EN- Endangered, VU- Vulnerable, NT-Near Threatened, LC- Least Concern IUCN 2010. IUCN Red List of Threatened Species. Version 2010.4. <www.iucnredlist.org>. Downloaded on 29 January 2013.
2
CITES - Convention on International Trade in Endangered Species of Wild Fauna and Flora. <http://www.cites.org/index.php>. Downloaded on 29 January 2013.
3
ACAP - Agreement on the Conservation of Albatrosses and Petrels. <http://www.acap.aq/>. Downloaded on 29 January 2013.
17
Breeding cycle of the Species in the Atlas
The breeding cycle of each species is presented as below (Table 5). Breeding period (orange) and inter-breeding period (green) - or non-breeding period, are presented separately. Penguins and seals have to come on land to moult and this period is indicated (shaded orange). The availability of tracking data is indicated by a blue arrow for the corresponding period. Some species of albatrosses that fledged a chick take a sabbatical year of one year before starting a new breeding season.
J J A S O N D J F M A M J J A S O N D J F M A M Breeding period Inter-breeding period
Table 4. Breeding cycle and availability of tracking data (blue arrow) of M. leonina. Shaded cells (dark orange) indicates
moulting period on land.
Breeding Sites of the Species in the Atlas
The Atlas includes data on 22 species of marine top predators from 4 breeding localities in the French Southern Territories and Antarctica (Amsterdam, Crozet, Kerguelen and Adélie Land).
All the colonies are located within the targeted area defined as the Southern Indian Ocean (Map 1, Table 5), and including Amsterdam, Crozet, Kerguelen and Adélie Land.
Table 5. Breeding localities in the Southern Indian Ocean (see references in Map 1)
1- I. Marion - Prince Edward 4- I. Amsterdam - Saint Paul 2- I. Crozet 5- I. Heard - McDonald 3- I. Kerguelen 6- Adélie Land, Antarctica
-Breeding localities are located all along a latitudinal gradient, from subtropical islands (Amsterdam – Saint Paul), subantarctic islands (Crozet and Kerguelen) to polar site (Adélie Land).
18 Map 1. Breeding localities in the Southern Indian Ocean (see references in Table 5). Oceanographic frontal structures
delimit 3 distinct biogeographic domains: subtropical waters north of the South Subtropical Front (SSTF), Subantarctic waters between the SSTF and the Polar Front (PF) and Antarctic waters south of the PF (Belkin, 1988;Belkin, 1993;Belkin and Gordon, 1996); updated 2003. The area of interest is shown (red box)
19
Map 2. Number of species tracked per breeding locality used in the Atlas (see references in Annex II Table A1 & 2).
Interpreting the maps in the Atlas
Breeding localities in the French Southern Territories and Adélie Land
The location of breeding sites of seabirds and seals in the French Southern Territories is provided at the beginning of each species sheet (example: Map 3). The breeding sites situated in the area of interest but outside the French Southern Territories are not indicated. These maps show only the breeding sites (blue star) for the species included in the Atlas, and the percentage of the world population that each site represents.
A blue star and orange circle represents breeding sites from where individuals where tracked The maps were generated by using the geographic coordinate system WGS 1984 (World Geodetic System of 1984). 4 sp 9 sp 13 sp 3 sp Adélie Land Prince Edward
20
Map 3. Breeding localities of the wandering albatross in the French Southern Territories. The area of interest is shown
(red box). The breeding sites (blue star) for the species at French Southern Territories included in the Atlas, and the percentage of the world population that each site represents are reported. An orange circle represents breeding sites from where individuals where tracked.
15% 23%
21
Use of the Southern Indian Ocean by seabirds and seals from French Southern
Territories
The first stage of most conservation planning is to identify areas that warrant protection (including areas that are already protected). The main criteria used to identify such areas are biological diversity (species richness), rarity, population abundance, environmental representativeness and site area (Prendergast et al., 1999). Where distribution data are both comprehensive and accurate, it is possible to identify areas of high species richness (hotspots), focusing on threat level (endangered species). The simplicity of the species richness approach to reserve selection is both its strength and its weakness.
In a first step, we present in the Atlas, the distribution maps for each species and then the important areas identified using the species richness approach.
Distribution maps
The methodology used for creating the species distribution maps is briefly explained here. Details are given in Annex I: Methodological Notes.
First, the tracking data were standardised and validated. Second, using location data, the residence time was defined as the proportion of time spent by each individual within a 1° × 1° cell in the area of interest (10°E-180°E, 20°S-90°S). Then, the mean residence time spent per square was calculated by species. Residence time was calculated using the tripGrid function (trip package) in R, which
resamples each individual track at a higher temporal resolution by linear interpolation and calculates the time spent in each spatial unit. The corresponding percentage of time spent in relation to the total trip duration was then calculated to obtain the area distribution (Map 4). The area distribution was calculated for the breeding period, the inter-breeding period and for both periods combined when sufficient data were available. The 1° cell size was chosen according to the tracking devices with the lowest accuracy of geolocators.
The most commonly used areas do not necessarily indicate the zones where individuals feed, but do indicate areas of intense use, which are therefore important for the species.
It is possible to quantify the amount of relative time that the tracked individuals stayed in each cell visited, and to identify the areas where the animals remained for the longest time. In all the distribution maps presented in the Atlas, the darkest areas (dark red) identify the zones where individuals spend most of the time (see for example Map 4). The legend used for each of the three periods (complete: breeding and non-breeding, breeding and non-breeding) were as follow.
22 Diamonds mark the breeding localities of seabirds and seals for which distribution data are shown (see Map 4).
Map 4. Yellow-nosed albatross, Amsterdam Island. Observed distribution (satellite data; Time spent per square in each 1° cell) of adult birds (breeding and inter-breeding periods pooled). Oceanographic frontal structures are shown: the subtropical waters north of the South Subtropical Front (dark grey line; SSTF), and the Polar Front (light grey line; PF) (Belkin, 1988;Belkin, 1993;Belkin and Gordon, 1996; updated 2003). Boundaries of CCAMLR - Commission for the
Conservation of Antarctic Marine Living Resources (light blue lines) and of Exclusive Economic Zones (dark blue lines; EEZs) are also shown.
The spatial distribution values of residence time are normalized at each step (values between 0 and 1) such as to compare between stages, breeding localities and species.
We deduced from residence time data, the presence/pseudo-absence data (or occurrence data) for each species and stage. Top predators diversity was then evaluated across the Southern Indian Ocean at a 1° latitude-longitude grid cell scale. These cells are not proposed as the unit of
conservation, but rather that important sites might, in principle, be identified within such an area.
Hotspots identification
Biological diversity can be evaluated on the basis of single or multiple criterion indices. In this analysis of area evaluation, following (Hacker et al., 1998), four indices (species richness, rarity-weighted richness, threatened species richness, conservation-rarity-weighted rarity richness), two of each type, are used.
The first single-criterion index is “species richness”. It is directly deduced from the occurrence data of the species. Two alternative approaches can be used in multiple-criterion evaluation (e.g. (Williams, 1997)). The first is to devise an index which combines two or more single-criterion indices, where for
23 example species richness is weighted by the spatial range size of the species present to determine the “rarity-weighted richness” of an area. Range size is a common measure of rarity (Gaston, 1994). The rarity-weighted richness is calculated as the sum of rarity scores for all species present in a grid cell, where the rarity score for each species is the reciprocal of the number of cells in which it occurs (e.g. (Williams and Humphries, 1996); the cells with highest score value are therefore those which have a large number of restricted-range species.
The second approach to multiple-criterion indices is that of sequential filtering. This is used in an index in which species richness is combined with endangerment by discarding all the species which are not classified as threatened (following Stevenson et al. 1992; CR: Critically Endangered, EN: Endangered, VU: Vulnerable; Table 4), and then evaluating species richness for the remaining database of threatened species. This measure is called “threatened species richness”. Finally, we considered a weight score for the IUCN status (i.e. Critically Endangered: 5, Endangered: 4 and so on) which was combined to the threatened species richness to produce a final index called “conservation-weighted rarity richness”.
Hotspots were identified by overlapping the top-scoring 10% and 5% of grid cells (Prendergast et al., 1993) for species richness, rarity-weighted richness, threatened species richness and conservation-weighted rarity richness (example shown in Map 5).
Map 5. Spatial pattern of diversity: species richness. Observed distribution of the evaluation criteria species richness (Occurrence data obtained from time spent per square in each 1° cell, top-scoring 5% of grid cells) of adult birds (pooled breeding and inter-breeding periods). Oceanographic frontal structures are shown: the subtropical waters north of the South Subtropical Front (dark grey line; SSTF), and the Polar Front (light grey line; PF) (Belkin, 1988;Belkin, 1993;Belkin and Gordon, 1996; updated 2003). Boundaries of CCAMLR - Commission for the Conservation of Antarctic Marine Living Resources (light blue lines) and of Exclusive Economic Zones (dark blue lines; EEZs) are also shown.
For all indices, grid cells with maximum values are shown in dark red and grid cells with minimum values are shown in yellow.
24
Diet and stable isotopes
Each species sheet includes a short description of the food and feeding ecology including the main prey species and the trophic niche based on stable isotope analysis.
Diet
In birds, dietary analyses are restricted to the chick-rearing period, because adult birds return to the colony with significant amount of food in their proventriculus at that time only. Hence, prey items correspond to chick food, and not to the prey caught by the parent birds when they feed for themselves. Noticeable is the lack of dietary information on breeding adults during incubation, non-breeding adults during the non-breeding season, and on adults during the inter-non-breeding period. Analysis of stomach contents followed (Cherel et al., 2000b), meaning that special care was made to not pool fresh and accumulated items (Table 6). The dietary habits of Antarctic fur seals were determined from scat analysis (Cherel et al., 1997).
Stable isotopes
Measurement of stable isotopes is a powerful tool to complement the conventional ways to investigate the food and feeding ecology of consumers (e.g. stomach content and scat analysis, and bio-logging). The isotopic niche is used as a proxy of the ecological niche, with δ13C and δ15
N values reflecting the foraging habitats and trophic levels of the animals (Newsome et al., 2007). In birds, whole blood and feathers are the two most commonly targeted tissues, because they can be sampled easily in the field. Metabolically active blood represents a period of days to a few months before sampling, depending on animal size, whereas the metabolically inactive feathers reflect the diet at the time they were grown. Hence, blood and feathers from large chicks provide information on the foraging habits of parent birds during the breeding period. In contrast, adult feathers reflect the previous non-breeding period, because adult moult occurs primarily at that time. Here, we focused on feathers from chicks and adults of flying birds, and on blood of penguins and pinnipeds. The southern Indian Ocean is marked by a well-defined latitudinal (not longitudinal) baseline carbon isoscape that is reflected in the tissue of consumers (Cherel and Hobson, 2007;Jaeger et al., 2010b). Our isotopic seabird database allowed estimating the carbon position of the main oceanic fronts, and thus to delineate robust isoscapes of the main foraging zones for top predators, depending on the targeted tissues. Based on blood (feather) δ13C isoscapes, values less than -22.9 ‰ (-21.2‰), -22.9 to
-20.1 ‰ (-21.2 to -18.3 ‰), and greater than -20.1 ‰ (-18.3 ‰) were considered to correspond to the Antarctic, Subantarctic and Subtropical Zones, respectively (Jaeger et al., 2010b).
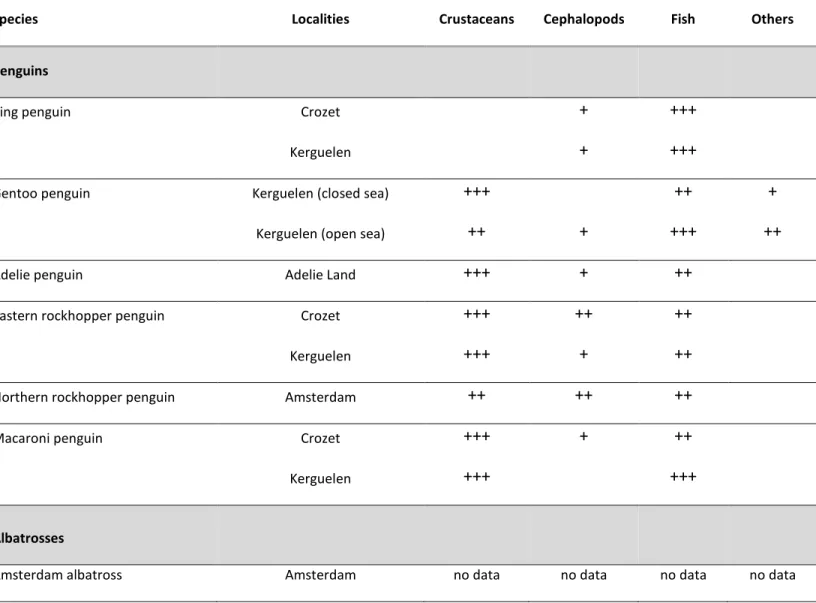
25 Table 6. Relative importance by mass of broad prey classes in the diets of seabirds and pinnipeds during the breeding period. +, from 1 to 10%; ++, from 10 to 40%, +++, >40% by mass.
Species Localities Crustaceans Cephalopods Fish Others
Penguins
King penguin Crozet + +++
Kerguelen + +++
Gentoo penguin Kerguelen (closed sea) +++ ++ +
Kerguelen (open sea) ++ + +++ ++
Adelie penguin Adelie Land +++ + ++
Eastern rockhopper penguin Crozet +++ ++ ++
Kerguelen +++ + ++
Northern rockhopper penguin Amsterdam ++ ++ ++
Macaroni penguin Crozet +++ + ++
Kerguelen +++ +++
Albatrosses
26
Wandering albatross Crozet +++ ++ +
Kerguelen ++ ++ +
Black-browed albatross Kerguelen + +++ ++
Indian yellow-nosed albatross Amsterdam + ++ +++ +
Light-mantled sooty albatross Crozet ++ +++ ++ ++
Kerguelen no data no data no data no data
Sooty albatross Amsterdam ++ +++
Crozet + +++ + +++
Petrels
Southern giant petrel Crozet + + +++
Northern giant petrel Crozet + +++
Kerguelen no data no data no data no data
Antarctic fulmar Adélie Land +++ ++ +++
Cape petrel Adélie Land +++ ++
27
White-chinned petrel Crozet ++ ++ +++ +
Kerguelen ++ ++ +++ +
Grey petrel Kerguelen + ++ +++ +
Skuas
Brown skua Kerguelen +++
Pinnipeds
Southern elephant seal Kerguelen no data no data no data no data
28
Threats to Biodiversity
Exploitation of marine ressources is not usually sustainable, which means that some anthropogenic activities induce actual threats to biodiversity (Pauly et al., 2002). The Southern Indian Ocean is not pristine. The most serious threats are linked to industrial fishing activities, including fishery discards, bycatch of seabirds and marine mammals, as well as degradation of marine environments through global and local pollution (Lewison et al., 2004;Lewison et al., 2005). On land, alien introductions and diseases are now the main threats.
Incidental bycatch. Every year thousands of seabirds and marine mammals die in commercial fishing operations in the southern Indian Ocean (Brothers, 1991;Croxall et al., 2012;Lewison et al.,
2004;Lewison et al., 2005). Longline fisheries (using baited hooks) are largely responsible for the historical and current reduction in many albatross and petrel populations. Birds are attracted by baited hooks, caught on hooks and drown when the lines sink. Seabirds and marine mammals are also attracted by fishing vessels to feed on fishing discards, being thus at the risk of being caught in nets and hooks (BirdLife International, 2013). Most species of albatrosses and some petrels in the world are badly threatened with incidental bycatch and ghost fishing (drifting nets) representing major problems to the birds (Barbraud et al., 2012).
@P.Tixier
Entanglement. This threat to the life of many seabirds and marine mammals is a consequence of the interaction with fishing vessels and drifting fishing wastes. Fur seals and southern elephant seals have been recorded entangled in fishing gear.
29 @A.Prudor
Pollution. The breeding colonies also reflect the effect of discarding millions of tons of non-degradable waste into the ocean; nonetheless this problem has received little attention until now. Diseases. Wildlife faces a growing risk of contracting diseases related or not to human activities. Indian yellow-nosed albatrosses and sooty albatrosses from Amsterdam Island are known to be exposed to avian cholera and this threat has been previously identified as probably the most important factor influencing the demographic parameters of the two populations (Demay et al., 2013;Weimerskirch, 2004). Avian cholera is probably affecting the entire albatross populations on Amsterdam Island, thus constituting a serious threat for the rarer Amsterdam albatross. Biosecurity measures to limit the spread of the disease are necessary and presently in force on the island. Hazards on land: introduced species. Invasive species (rats, cats …etc) are considered one of the main threats on land to the persistence of seabird breeding colonies (Brooke, 2004;King, 1985).
30
PENGUINS
32
Penguins of French Southern Territories in the Southern Indian Ocean
Penguins constitute a key group of consumers of the food webs in the Southern Ocean, where they number several million breeding pairs. In the French Southern Territories they form more than 90 per cent of seabird biomass and consume more than 3 million tonnes of prey (macrozooplanktonic species, myctophids, squids) per year (Guinet et al., 1996). These predators also play a major role in the dynamic of the food webs through the major input of nutrients such as phosphates and nitrogen in the surrounding marine environment.
Nine species breed in the Southern Indian Ocean (cf Table 1; Map 6). The King (Aptenodytes
patagonicus), Gentoo (Pygoscelis papua), Eastern rockhopper (Eudyptes chrysocome filholi),
Northern rockhopper (Eudyptes moseleyi) and Macaroni (Eudyptes chrysolophus) penguins breed in the area and are resident year-round in the Subantarctic zone. Other species like the Royal (Eudyptes schlegeli), Adélie (Pygoscelis adeliae), Chinstrap (Pygoscelis antarctica) and Emperor (Aptenodytes forsteri) penguins breed on some islands or colony sites in more remote localities or in the Antarctic region, but, overall, they distribute throughout the Southern Indian Ocean.
The Atlas focuses on six species breeding in the French Southern Territories for which comprehensive tracking data are available: the King, Gentoo, Adélie, Eastern rockhopper, Northern rockhopper and Macaroni penguins.
The status of breeding populations of most of these species are poorly documented. Several are declining and 4 of them are included on the IUCN Red List as threatened species (Table 4; Endangered or Vulnerable. Some of these declines are recent and not well understood. Several hypotheses have pointed out the possible effects of density dependence, interactions with competitors (e.g. fur seals), decline in adult survival rate and breeding success and decrease of the marine productivity in the wintering grounds (Crawford et al., 2006;Delord et al., 2004;Hilton et al., 2006;Trathan et al., 2012).
33
Map 6. Specific diversity of sub-antarctic penguins. Observed cumulated Presence distribution (satellite and geolocator data; Time spent per square in each 1° cell) of adult birds for 5 subantarctic species of penguins (breeding and inter-breeding periods pooled). Oceanographic frontal structures are shown: the subtropical waters north of the South Subtropical Front (dark grey line; SSTF), and the Polar Front (light grey line; PF) (Belkin, 1988;Belkin, 1993;Belkin and Gordon, 1996; updated 2003). Boundaries of CCAMLR - Commission for the Conservation of Antarctic Marine Living Resources (light blue lines) and of Exclusive Economic Zones (dark blue lines; EEZs) are also shown.
34
Penguins/King penguin
Aptenodytes patagonicus
CRITICALLY ENDANGERED ENDANGERED VULNERABLE NEAR THREATENED LEAST CONCERN NOT LISTED
@ C.A. Bost
TAXONOMY
Order Sphenisciformes / Family Spheniscidae / Genus Aptenodytes /Species A.patagonicus Annual breeder J J A S O N D J F M A M J J A S O N D J F M A M Breeding period Inter-breeding period
35 Regional Breeding Sites. Aptenodytes patagonicus breed on subantarctic islands between latitude 45° south and 55° south, namely on the Malvinas Islands and South Georgia Island in the South Atlantic Ocean, on Prince Edward, Crozet (including Cochons, Possession, and de l’Est Islands), Kerguelen, and Heard Islands in the southern Indian Ocean, and on Macquarie Island in the southwestern Pacific Ocean. All breeding sites are generally located within a distance of 400 kilometers from the Antarctic Polar Front. The Crozet and Kerguelen populations host most of the world population (56% and 17%, respectively, Delord et al. 2004, Bost et al. 2012).
Population trends. Exploitation of penguins for their oil associated with the sealing industry in the 19th and early 20th centuries resulted in king penguin populations decline in several localities. After commercial exploitation ceased, king penguin populations quickly recovered during the second part of the 20th century at all breeding sites (Kerguelen Islands: (Weimerskirch et al., 1989); Crozet Islands: (Delord et al., 2004)).
The largest population occurs on the Crozet Islands (at least 612000 pairs) especially at Cochons Island, the world’s largest king penguin colony (500000 pairs in 1988, (Guinet et al., 1995)). However, whereas the breeding colonies on Possession Island are counted annually (Delord et al., 2004), no recent data are available for Cochons Island. On Kerguelen, colonies were slower to recover and are still increasing (Weimerskirch et al., 1989).
Diet and stable isotopes.
During the two periods of chick growth (summer and spring), chick food at Crozet and Kerguelen Islands consists almost exclusively of fish (>90%), with cephalopods accounting for the remainder. Fish diet was dominated by oceanic myctophids, with Krefftichthys anderssoni, Electrona carlsbergi and Protomyctophum tenisoni being the three main species at Crozet Islands (Cherel et al.,
2007;Cherel and Ridoux, 1992;Cherel et al., 1993;Ridoux, 1994). At Kerguelen Islands, K. anderssoni forms the bulk of the food, with the pelagic stage of the eel-cod Muraenolepis marmoratus being an important item on some years (Bost et al., 2002), unpublished data). The dietary importance of squids increases in winter at the Crozet Islands, with large juveniles of the onychoteuthid
Moroteuthis ingens being the main cephalopod prey at that time (Cherel et al., 1996;Cherel et al., 1993).
56%
36 The similar chick blood δ13C and δ15N values in summer and spring at Crozet and Kerguelen Islands are consistent with a myctophid-based diet, as are the blood isotopic ratios of adult birds during the chick-rearing period (Cherel et al., 2010;Cherel et al., 2007). Both the stable isotope method and the use of lipids as trophic markers again indicate that adult birds feed on myctophids during the two periods of hyperphagia at sea preceding the breeding and moulting fasts on land (Cherel et al., 2010;Raclot et al., 1998). The trophic position of king penguins was estimated at 4.5-4.6 (Cherel et al., 2010).
Marine distribution. A. patagonicus at-sea distribution is one of the most extensively studied among marine vertebrates. During summer, irrespective of the location of their breeding site, the at-sea distribution is strongly dependent on frontal zone features, particularly the Antarctic Polar Front. From autumn to the end of winter, the A. patagonicus’ foraging area is encompassed by the Antarctic Polar Front to the north and the Antarctic Divergence (up to the limit of the sea-ice) to the south (Bost et al., 2012).
At Crozet, King penguins use mostly the northern limit of the Polar Front (PF) and accessorily the Subantarctic front (Bost et al. 2009b). During autumn and winter breeding adults forage beyond the PF, in Antarctic waters, up to the limit of the pack ice (Bost et al., 2004;Moore et al., 1999;Pütz et al., 1999). Except in spring, King penguins use strong vertically stratified waters especially at the PF and typically dive to the thermocline to avoid the Surface Mixed Layer (Charrassin and Bost, 2001). At Kerguelen, King penguins forage closer to the colonies than at Crozet because of the closer proximity of the PF.
Important areas
The Crozet population essentially forages during summer in the oceanic sector 47.5-54°S, 50-54°E, south of the Crozet archipelago, i.e. in the waters of the Polar Frontal zone up to the south of the PF (Bost et al., 2009a;Bost et al., 1997). During winter, they distribute over a much larger scale and are strongly dependent of the marginal ice zone, which corresponds to the southern limit of their trips (Bost et al., 2004).
On Kerguelen, King penguins from the Courbet peninsula follow a path to the south-east up to 300 km from their colony, mainly along the eastern south eastern edge of the shelf. The preferential habitat is the wide shallow plateau (500–1000m) and along the shelf break where they encounter a cold northwest flowing current, in opposition to the general eastward flow of the ACC (Bost et al., 2009a;Charrassin et al., 2002).
The sector 49°-51°S; 71°-76°E, partially in the French EEZ, is of key importance for king penguins during incubation and the chick rearing period, also probably during the winter period . At this time of the year, the Crozet shelf (included in the French EZZ) is also an important foraging area for penguins feeding crèched chicks.
37
Map 7. King penguin, Crozet and Kerguelen Islands. Observed distribution (satellite data; Time spent per square in each 1° cell) of adult birds (breeding period). Oceanographic frontal structures are shown: the subtropical waters north of the South Subtropical Front (dark grey line; SSTF), and the Polar Front (light grey line; PF) (Belkin, 1988;Belkin, 1993;Belkin and Gordon, 1996; updated 2003). Boundaries of CCAMLR - Commission for the Conservation of Antarctic Marine Living Resources (light blue lines) and of Exclusive Economic Zones (dark blue lines; EEZs) are also shown.
Map 8. King penguin, Crozet Island. Observed distribution (satellite data; Time spent per square in each 1° cell) of adult birds (breeding period). Oceanographic frontal structures are shown: the subtropical waters north of the South Subtropical Front (dark grey line; SSTF), and the Polar Front (light grey line; PF) ((Belkin, 1988;Belkin, 1993;Belkin and Gordon, 1996)
38
updated 2003). Boundaries of CCAMLR - Commission for the Conservation of Antarctic Marine Living Resources (light blue lines) and of Exclusive Economic Zones (dark blue lines; EEZs) are also shown.
Map 9. King penguin, Kerguelen Island. Observed distribution (satellite data; Time spent per square in each 1° cell) of adult birds (breeding period). Oceanographic frontal structures are shown: the subtropical waters north of the South Subtropical Front (dark grey line; SSTF), and the Polar Front (light grey line; PF) (Belkin, 1988;Belkin, 1993;Belkin and Gordon, 1996; updated 2003). Boundaries of CCAMLR - Commission for the Conservation of Antarctic Marine Living Resources (light blue lines) and of Exclusive Economic Zones (dark blue lines; EEZs) are also shown.
39
Map 10. King penguin, Crozet Island. Spatial prediction of percentage of at-sea time spent per square in each 0.1° cell by adults king penguin from Possession Island (Crozet) during a: incubation, January and b: brooding (year: 2004) as predicted by a linear mixed-effects model. Thick black lines correspond to the Polar Front position, medium black lines with points represent penguins’ tracks and thin lines correspond to contours of predicted habitat suitability. Blanks correspond to areas where predictions could not be made because of cloud cover. Bathymetry is shown (Péron et al., 2012)
Habitat models (map 10, Annex IB for detailed methodology) predicting the spatial distribution are available for the incubation (Map 10a) and brooding period within the summer range. Sea surface temperature is the most important variable predicting the king penguins’ foraging zones during both breeding stages. The penguins mostly forage in cold oceanic waters typical of the PF, where
hydrography is not influenced by high topographic features. The predicted foraging areas are located further south during warmer years, indicating that penguins have to cover larger distances.
Threats. A. patagonicus is found to be sensitive to climate change. Warm phase of the Southern Oscillation and warm sea surface temperatures in foraging areas may negatively affect breeding success and adult survival and impact distribution and populations (Le Bohec et al., 2008;Péron et al., 2012). The main prey of A. patagonicus, myctophid fish, were commercially exploited by the end of the 1970s and the beginning of the 1990s, with more than 200.000 tons harvested in the South Georgia sector (Collins et al., 2008). Several attempts to develop new commercial fisheries on a limited scale within the Southern Ocean are ongoing. A large, uncontrolled development of myctophid fisheries close to key foraging areas, especially at Kerguelen or in the Scotia Sea (South Georgia) may have deleterious effects on the foraging success and long-term populations trends of the king penguin.
Gaps & Stakes. There is a lack of distribution data for very important breeding colonies (i.e. Cochons Is. at Crozet archipelago or colonies on the west coast of Kerguelen Island). Dispersion movements and wintering grounds of non-breeding adults, immatures and post-fledged birds is unknown. Complete censuses of breeding populations should be made at regular intervals in order to detect temporal trends and potential effects of environmental changes.
40
Penguins/Gentoo penguin
Pygoscelis papua papua
CRITICALLY ENDANGERED ENDANGERED VULNERABLE NEAR THREATENED LEAST CONCERN NOT LISTED
@ C.A. Bost
TAXONOMY
Order Sphenisciformes / Family Spheniscidae / Genus Pygoscelis /Species P.papua papua Annual breeder, sabbatic years possible
J J A S O N D J F M A M J J A S O N D J F M A M Breeding period Inter-nesting period
Table 8. Breeding cycle and availability of tracking data (blue arrow) of P. papua papua. Shaded cells indicates moulting
41 Regional Breeding Sites. P. papua is a colonial breeder nesting in small to medium colonies,
circumpolar distributed, with a wide breeding range, from the Scotia sea (Antarctic peninsula, South Georgia, South Orkney) to the subantarctic islands south of the Subantarctic Front of the Pacific Ocean (Macquarie) and South Indian Ocean (Heard, Kerguelen, Crozet and Marion-Prince Edward islands). Overall this penguin is mostly confined to regions free of winter pack-ice(Bost and Jouventin, 1990).
Previously morphologically recognised as single species with a northern (Pygoscelis papua papua) and a southern (P.papua ellsworthi) sub-species, the Gentoo penguin has been recently splitted in 3 genetically distinct clades (de Dinechin et al., 2012): the Indian ocean population (including Crozet and Kerguelen birds), the Subantarctic and the Atlantic populations).
The Kerguelen and Crozet archipelagos host about 11% and 3 % of the world population, respectively, and more than 70 % of the Indian clide (Bost and Jouventin, 1990;Jouventin et al., 1994;Weimerskirch et al., 1989).
Population trends. Populations are increasing at the southern extent of their breeding range, on the Antarctic Peninsula (Lynch et al., 2012), while colonies on subantarctic islands may have decreased substantially in the past and appear to have stabilised at several localities (South Georgia, Macquarie island)(Lynch et al., 2012).
On Kerguelen, the Gentoo penguin population appears to have recovered since the mid 2000s. On Crozet, the population of Possession Island has not recovered since a drastic decline between 1970 and the early 1980s and another decline recorded at the end of the 1980s. In 2010, the population size was about 50% less than the 1970 count, but stable since the early ninetines despite large inter-annual variations (CNRS Chizé database).
Diet and stable isotopes.
The inshore foraging habits of Gentoo penguins allow collecting food samples during the whole breeding period. At Kerguelen Islands, the species has a catholic diet including many benthic and pelagic organisms, their relative proportions depending on colony location and breeding stages. Overall food is dominated by fish in open-sea localities (38 to 95% by mass) and by crustaceans in closed-sea localities (84%). Gentoo penguins also feed significantly on annelids and cephalopods. Fish prey include postlarvae, various nototheniids and the icefish Champsocephalus gunnari, while the
3%
42 main crustacean item is the subantarctic krill Euphausia vallentini with the hyperiid Themisto
gaudichaudii ranking second (Bost et al., 1994;Lescroel et al., 2004).
Different δ13C baselines allow distinguishing chick and adult gentoo penguins living in different
marine environments at a small spatial scale in Kerguelen Islands, with blood δ13C values being higher
at closed-sea than at open-sea localities (Cherel and Hobson, 2007), unpublished data). The isotopic variance in both δ13C and δ15
N values is higher at open-sea localities, suggesting some degree of individual specialization in the birds’ feeding habits (Carravieri et al., 2013).
Marine distribution. Gentoo penguin is a costal, neritic species, exhibiting several foraging strategies according to the local environment (Bost and Jouventin, 1990;Lescroel and Bost, 2005). Tracking information (Argos PTTs) are available for 2 localities of the Kerguelen archipelago (pooled in this analysis), including one open sea locality of the eastern coast, Courbet Peninsula, and one inside the
Morbihan Gulf. Birds from open sea colonies have large foraging ranges and perform long trips, long
benthic dives on demersal fish while birds from closed bays have small foraging ranges, perform short trips and short pelagic dives on swarming crustaceans (Lescroel and Bost, 2005).
Important areas
Gentoos foraging off the eastern side of the Courbet peninsula (open sea conditions) used similar areas during the incubation and chick guard periods. All tracked birds head towards the plateau slope
and use mostly waters over 100 to 200m depths, more than 46km away from the breeding colony (see Map 12 for zoom on the distribution). Habitat suitability mapping shows that the highest suitability levels over the plateau correspond to specific isobaths around 500m.
In the Morbihan Gulf, birds are extremely coastal and perform mostly daily trips, remaining inside the Gulf at a maximum distance of 13 km from the colony.
Map 11. Gentoo penguin, Kerguelen Island. Observed distribution (satellite data; Time spent per square in each 1° cell) of adult birds (breeding period). Oceanographic frontal structures are shown: the subtropical waters north of the South
43
Subtropical Front (dark grey line; SSTF), and the Polar Front (light grey line; PF) ((Belkin, 1988;Belkin, 1993;Belkin and Gordon, 1996) updated 2003). Boundaries of CCAMLR - Commission for the Conservation of Antarctic Marine Living Resources (light blue lines) and of Exclusive Economic Zones (dark blue lines; EEZs) are also shown.
Map 12. Gentoo penguin, Kerguelen Island. Zoom on the observed distribution (satellite data; Time spent per square in each 1° cell) of adult birds (breeding period). Breeding colony of is indicated (white diamond).
Threats. The population of Possession Island (Crozet) has strongly decreased between the 1970s and the end of the 1980s. The reasons of the decline are unclear although human disturbance in the past have certainly affected the breeding success of the most accessible colonies of this shy population until the mid 1980s. The colonies are now strictly protected. The decrease observed in the 1980s may result in part of the low fledging success, probably as a consequence of trophic conditions in the Crozet plateau as suggested for Marion island (Cooper, 2003). Any further change in dynamic of inshore food webs may affect the population.
At Kerguelen, the comeback of trawl fisheries (icefish) may drastically affect the gentoos’ breeding success at open sea localities (East and North of Kerguelen).
On the long-term, food availability on the Kerguelen and Crozet shelf may be affected by climate changes.
Gaps & Stakes. On Crozet, there is no tracking data during the breeding /non breeding seasons and juvenile dispersion. Information on the at-sea distribution is needed at Possession Island and Cochons Island which hosts the main colonies.
On Kerguelen, tracking studies concern a minority of the whole population whose colonies are distributed on very different coastal environements. Information on the dispersion of fledgings is limited. Additionnal tracking data are especially required during the breeding period and fledging dispersion for the large colonies of the North (Nuageuses, Leygues islands) and the southern coasts (Antarctic Bay).
44 Gentoo populations of Crozet and Kerguelen constitute more than 70% of the Indian clide (Bost & Jouventin 1991, Jouventin et al. 1994) and are fully dependant of the EEZ because of their limited foraging range.
45
Penguins/Adelie penguin
Pygoscelis adeliae
CRITICALLY ENDANGERED ENDANGERED VULNERABLE NEAR THREATENED LEAST CONCERN NOT LISTED
@ C.A. Bost
TAXONOMY
Order Sphenisciformes / Family Spheniscidae / Genus Pygoscelis /Species P.adeliae Annual breeder J J A S O N D J F M A M J J A S O N D J F M A M Breeding period Inter-nesting period
Table 9. Breeding cycle and availability of tracking data (blue arrow) of P. adeliae. Shaded cells indicates moulting period on
46 Regional Breeding Sites.
The Adélie penguin is a strictly ice dependant species while at-sea. It breeds along the entire Antarctic coast and its nearby islands (38 breeding localities known). The overall breeding range extend from 56 to 78° S; i.e. 22° (Woehler 1993). After breeding, Adélie penguins also move towards areas of persistent sea ice to moult (Ainley et al. 2010).
Population trends. The total number of breeding Adélie penguin is estimated at 2.3 106 pairs (range 1.8-2.9 106,Woehler 1993). Numbers are increasing in the Ross Sea region and decreasing in the
Peninsula region, with the net global population increasing overall but could start to decline in a few decades (Ainley et al. 2010). On Dumont d’urville, the breeding population of the Pétrels islands is estimated at about 16.000 pairs (CNRS Chizé database).
Diet and stable isotopes. Chick food in Adélie Land is dominated by crustaceans (79-94% by mass), with fish ranking second (6-18%) and cephalopods third (<1-3%) (Cherel, 2008;Ridoux and Offredo, 1989). The major crustacean prey are euphausiids, with two species involved, the neritic ice krill (Euphausia crystallorophias) and the oceanic Antarctic krill (E. superba). By far the main fish prey is the Antarctic silverfish (Pleuragramma antarcticum) (Cherel, 2008;Wienecke et al., 2000).
Blood δ13C values show that chicks are fed with prey caught in nearby pelagic waters. Chick δ15N values are consistent with a mixed diet of krill and fish. The lower blood δ15N values of adult birds
point out two interesting features. Firstly, adults prey more upon crustaceans and less on fish when they feed for themselves during the chick-rearing period. Secondly, they feed primarily on Antarctic krill in oceanic waters in spring at the end of the inter-nesting period (Cherel, 2008).