Publisher’s version / Version de l'éditeur:
Vous avez des questions? Nous pouvons vous aider. Pour communiquer directement avec un auteur, consultez la
première page de la revue dans laquelle son article a été publié afin de trouver ses coordonnées. Si vous n’arrivez
Questions? Contact the NRC Publications Archive team at
[email protected]. If you wish to email the authors directly, please see the first page of the publication for their contact information.
https://publications-cnrc.canada.ca/fra/droits
L’accès à ce site Web et l’utilisation de son contenu sont assujettis aux conditions présentées dans le site LISEZ CES CONDITIONS ATTENTIVEMENT AVANT D’UTILISER CE SITE WEB.
Research Report (National Research Council of Canada. Institute for Research in
Construction), 2003-05-01
READ THESE TERMS AND CONDITIONS CAREFULLY BEFORE USING THIS WEBSITE. https://nrc-publications.canada.ca/eng/copyright
NRC Publications Archive Record / Notice des Archives des publications du CNRC :
https://nrc-publications.canada.ca/eng/view/object/?id=a5ed3d4e-588f-4fdb-a8e4-39fbab151207 https://publications-cnrc.canada.ca/fra/voir/objet/?id=a5ed3d4e-588f-4fdb-a8e4-39fbab151207
NRC Publications Archive
Archives des publications du CNRC
For the publisher’s version, please access the DOI link below./ Pour consulter la version de l’éditeur, utilisez le lien DOI ci-dessous.
https://doi.org/10.4224/20386259
Access and use of this website and the material on it are subject to the Terms and Conditions set forth at
FIERAsystem Downtime Model (DNTM) Theory
FIERAsystem Downtime Model (DNTM) Theory
Bénichou, N.; Kashef, A.; Reid, I.; Hum, J.
IRC-RR-135
May 2003
FIERAsystem Downtime Model (DNTM) Theory
Noureddine Benichou, Ahmed Kashef, Irene Reid, and Joe Hum
Research Report No. 135
May 2003
Fire Risk Management Program Institute for Research in Construction National Research Council Canada
Table of Contents
Table of Contents ... i List of Figures... i List of Tables ... i Nomenclature ... ii 1. INTRODUCTION... 3 2. METHODOLOGY... 42.1 BUILDING REPLACEMENT DURATION... 5
2.2 BUSINESS INTERRUPTION... 5 3. SAMPLE RESULTS ... 7 3.1 INPUTS... 7 3.2 RESULTS... 11 4. REFERENCES... 14
List of Figures
FIGURE 1 DOWNTIME VERSUS DAMAGE... 6FIGURE 2 DNTM SAMPLE INPUTS SCREENSHOT FOR BUSINESS INTERRUPTION – CASE 2... 10
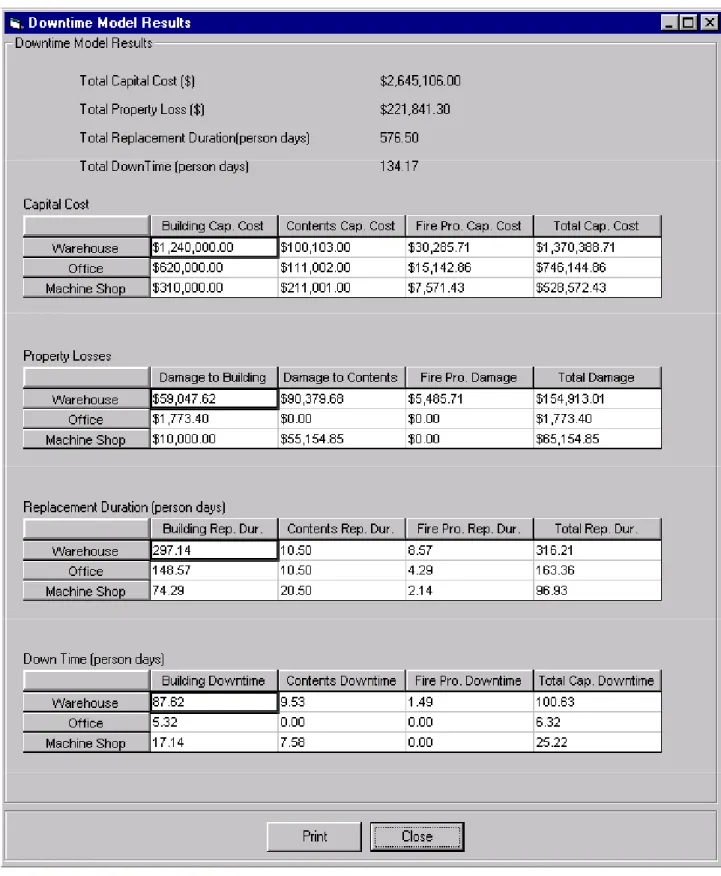
FIGURE 3 DNTM SAMPLE RESULTS SCREENSHOT FOR AN ESTIMATED DAMAGE – CASE 1 ... 12
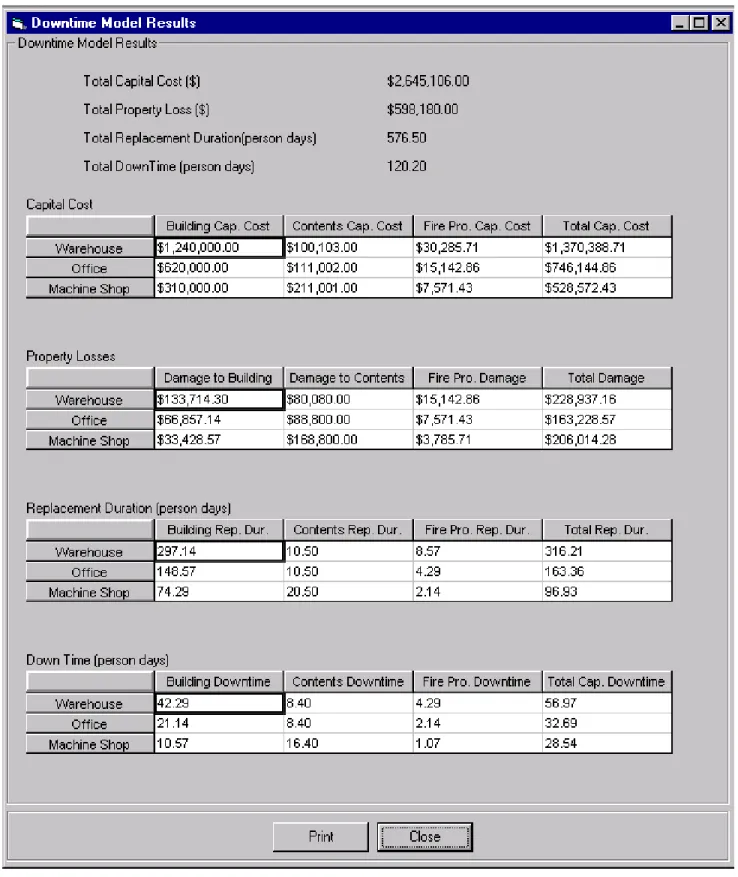
FIGURE 4 DNTM SAMPLE RESULTS SCREENSHOT FOR A GIVEN DAMAGE – CASE 2 ... 13
List of Tables
TABLE 1 SAMPLE BUILDING GEOMETRY... 7TABLE 2 SAMPLE FIRE CONDITIONS... 7
TABLE 3 SAMPLE BUILDING CATEGORIES... 7
TABLE 4 SAMPLE CONTENTS CATEGORIES... 8
TABLE 5 SAMPLE FIRE PROTECTION SYSTEMS... 9
Nomenclature
VFP = Value of fire protection systems ($)
VB = Value of building components ($)
VC = Value of contents ($)
VT = Total building value ($)
CB = Cost of damage to building from a fire ($)
CFP = Cost of damage to fire protection systems from a fire ($)
CC = Cost of damage to contents from a fire ($)
CT = Total cost of damage to the building from a fire ($)
RFP = Value of replacing fire protection systems (person days)
RB = Value of replacing building components (person days)
RC = Value of replacing contents (person days)
RT = Total replacement duration (person days)
DB = Business interruption to building (person days)
DFP = Business interruption to fire protection systems (person days)
DC = Business interruption to contents (person days)
1. INTRODUCTION
As Canada and other countries move from prescriptive-based building codes to
performance/objective-based codes, new design tools are needed to aid in demonstrating that compliance with these new codes has been achieved. One such tool is the computer model FiRECAM™, which has been developed over the past decade by the Fire Risk Management Program of the Institute for Research in Construction at the National Research Council of Canada (NRC). FiRECAM™ [1,2] is a computer model for evaluating fire protection systems in residential and office buildings that can be used to compare the expected safety and cost of candidate fire protection options.
To evaluate fire protection systems in light industrial buildings, a new computer model is being developed. This model, whose current focus is aircraft hangars and warehouses, is based on a framework that allows designers to establish objectives, select fire scenarios that may occur in the building and evaluate the impact of each of the selected scenarios on life safety, property protection and business interruption. The new computer model is called FIERAsystem, which stands for Fire Evaluation and Risk Assessment system.
FIERAsystem uses time-dependent deterministic and probabilistic models to evaluate the impact of selected fire scenarios on life, property and business interruption. The main FIERAsystem sub-models calculate fire development, smoke movement through a building, time of failure of building elements and occupant response and evacuation. In addition, there are sub-models dealing with the effectiveness of fire suppression systems and the response of fire departments.
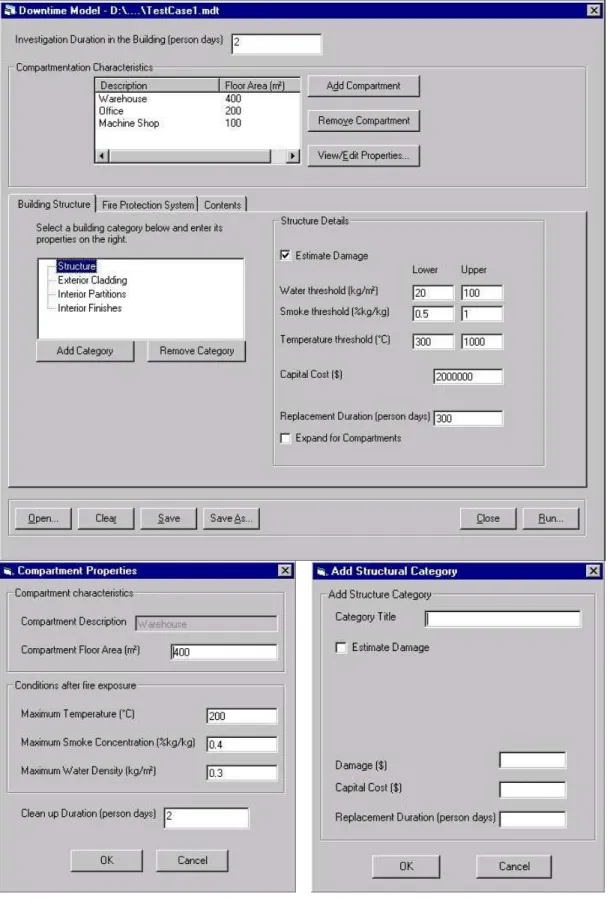
This report describes the theoretical framework of the DowNTime Model (DNTM) of the FIERAsystem. The DNTM code was developed to evaluate business interruption as a result of fire damage to a building or its components. It calculates a number of parameters such as: total capital cost in dollars, total replacement duration in person days, total property loss in dollars, and total business interruption in person days. Replacement duration is defined as the number of days it takes to construct or to install any component of (or in) the building. The input to DNTM includes: capital cost in dollars, replacement duration in days, damage in dollars of each component in the building.
The DNTM was developed so that a variety of construction materials, contents and fire protection systems can be used in the calculation of the total building value and the costs of damages. It was designed to follow commonly-used practices for estimating the cost of construction projects [3,4] so that these estimates can be applied as inputs to the model. Although the user is provided with a sample set of building components, contents and fire protection system types, this set can be easily changed and customized by the user. The model has been designed to be an integrated component of FIERAsystem so that it can be used to provide the data necessary to calculate the business interruption in risk and hazard analyses.
2. METHODOLOGY
The DNTM calculates, based on the output data from the Economic Model [5] such as the total building value, VT and the total cost of damage in the case of a fire, CT, two major sets
of results:
The total replacement duration, RT, and;
The total business interruption duration, DT.
The total building value is the sum of three components:
VT = VFP + VB + VC (1)
Where:
VFP = Value of fire protection systems ($)
VB = Value of building components ($)
VC = Value of contents ($)
The cost of damage is divided into damage to the building, CB, damage to the fire
protection systems, CFP, and damage to the building’s contents, CC. The costs of damage to the
building, fire protection systems, and contents are calculated by summing up the damages to each component included in the calculation of VB, VFP, and VC above.
CT = CB + CFP + CC (2)
Where:
CB = Cost of damage to building ($)
= Sum(Damageobject) for each building component
CFP = Cost of damage to fire protection systems ($)
= Sum(Damageobject) for each fire protection systems component
CC = Cost of damage to contents ($)
= Sum(Damageobject) for each contents component
These values are transferred from the Economic Model [5] (integrated mode), or inputted by the users (stand-alone mode). The input should include information for:
• Building geometry,
• Building components and contents costs,
• Fire protection systems installation and maintenance costs,
• Fire conditions:
upper and lower water threshold in kilograms of water per square meter of floor space in compartment (kg/m2), of each building components and contents, upper and lower smoke threshold in a percentage based on the mass of smoke
entrained in a mass of air (% kg smoke / kg air) of each building components and contents, and
upper and lower temperatures, in Celsius (°
C) degrees of each of the buildings components and contents.
The details of calculating the two parameters RT and DT are presented in the following
sections.
2.1 Building Replacement Duration
The total replacement duration of building value is the sum of three components:
RT = RFP + RB + RC (3)
Where:
RFP = Value of fire protection systems (person days)
RB = Value of building components (person days)
RC = Value of contents (person days)
2.2 Business Interruption
Business interruption can be divided into interruption to the building, DB, to the fire
protection systems, DFP, and to the building’s contents, DC. Business interruption is calculated
by summing up the interruption to each component included in the calculation of VB, VFP, and VC
above.
DT = DB + DFP+ DC (4)
Where:
DB = Business interruption to building (person days)
= Sum(DownTimeobject) for each building component
DFP = Business interruption to fire protection systems (person days)
= Sum(DownTimeobject) for each fire protection systems component
DC = Business interruption to contents (person days)
= Sum(DownTimeobject) for each contents component
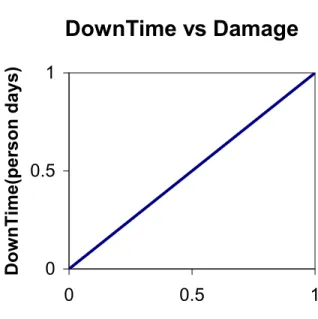
The DNTM is based on the assumption that for zero damage of a component, no replacement is needed and for full damage of a component, a full replacement is required. Therefore, the business interruption, D, corresponding to full damage of a component, C, (which is equal to the capital cost V), is equal to the replacement duration, R, of that component. On the other hand, a business interruption for zero damage is equal to zero replacement duration of the component. Furthermore, we assume that the business interruption is proportional to the cost of damage (Figure 1), with the slope of the linear relationship being (Robject / Vobject). This
will be translated to the following equation to determine the business interruption of a certain component:
Dobject = (Robject / Vobject) * Cobject (5)
Where:
Dobject = Business interruption for a certain component (person days)
Robject = Total replacement duration of a certain component (person days)
Cobject = Total cost of damage of a certain component ($)
The total business interruption can then be calculated by summing up all business interruptions for all building, fire protection systems, and contents components.
DownTime vs Damage
0
0.5
1
0
0.5
1
Damage($)
DownTime(person days)
3. SAMPLE RESULTS
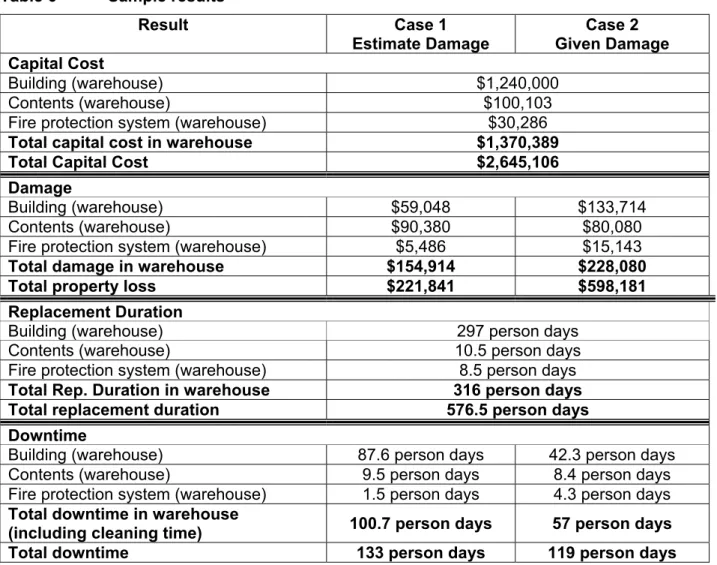
The following are two sets of sample calculations from the DNTM for two sets of input. Both inputs, which represent a typical industrial building, and the results of the calculations, are shown below (Table 1 through Table 6). Two cases were calculated: “Case 1 – integrated model” where damage is estimated, and “Case 2 – stand alone model” where the damage is given, with the building geometry, building categories, contents categories, and fire protection systems the same for each case. The results for both cases are shown in Table 6.
3.1 Inputs
Table 1 Sample building geometry
Compartment Name Floor Area (m²) Clean Up Duration (person days)
Warehouse 400 2
Office 200 1
Machine Shop 100 0.5
Table 2 Sample fire conditions
Compartment Parameter Case 1 Case 2
Maximum Temperature (°C) 200 70
Maximum Water Density (kg/m²) 0.3 0.0
Warehouse
Maximum Smoke Concentration (kg/kg air) 0.4 0.1
Maximum Temperature (°C) 70 600
Maximum Water Density (kg/m²) 0.0 3.0
Office
Maximum Smoke Concentration (kg/kg air) 0.1 0.5
Maximum Temperature (°C) 90 150
Maximum Water Density (kg/m²) 0.0 2.0
Machine Shop
Maximum Smoke Concentration (kg/kg air) 0.3 0.3
Table 3 Sample building categories Category Name Capital cost ($) Water Thresholds (kg/m²) Temperature Thresholds (°C) Smoke Thresholds (kg/kg air) Damage (Case 2) ($) Replacement Duration (person days)
Max. Min. Max. Min. Max. Min.
Structure 2,000,000 100 20 1000 300 1.0 0.5 200,000 300 Exterior cladding 100,000 50 20 1000 300 0.6 0.3 20,000 100 Interior partitions 50,000 10 1.0 600 200 0.3 0.1 10,000 60 Interior finishes 20,000 1.0 0.0 600 100 0.3 0.01 4,000 60
Table 4 Sample Contents Categories Category Name Capital cost ($) Water thresholds (kg/m²) Temperature thresholds (°C) Smoke thresholds (kg/kg air) Damage (case 2) ($) Replacement Duration (person days)
Max. Min. Max. Min. Max. Min.
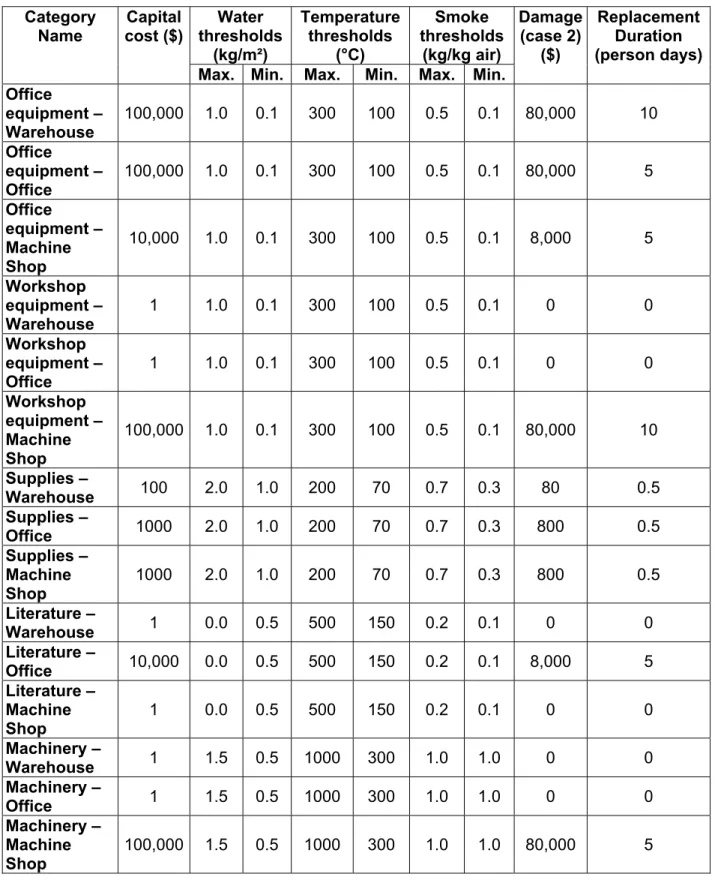
Office equipment – Warehouse 100,000 1.0 0.1 300 100 0.5 0.1 80,000 10 Office equipment – Office 100,000 1.0 0.1 300 100 0.5 0.1 80,000 5 Office equipment – Machine Shop 10,000 1.0 0.1 300 100 0.5 0.1 8,000 5 Workshop equipment – Warehouse 1 1.0 0.1 300 100 0.5 0.1 0 0 Workshop equipment – Office 1 1.0 0.1 300 100 0.5 0.1 0 0 Workshop equipment – Machine Shop 100,000 1.0 0.1 300 100 0.5 0.1 80,000 10 Supplies – Warehouse 100 2.0 1.0 200 70 0.7 0.3 80 0.5 Supplies – Office 1000 2.0 1.0 200 70 0.7 0.3 800 0.5 Supplies – Machine Shop 1000 2.0 1.0 200 70 0.7 0.3 800 0.5 Literature – Warehouse 1 0.0 0.5 500 150 0.2 0.1 0 0 Literature – Office 10,000 0.0 0.5 500 150 0.2 0.1 8,000 5 Literature – Machine Shop 1 0.0 0.5 500 150 0.2 0.1 0 0 Machinery – Warehouse 1 1.5 0.5 1000 300 1.0 1.0 0 0 Machinery – Office 1 1.5 0.5 1000 300 1.0 1.0 0 0 Machinery – Machine Shop 100,000 1.5 0.5 1000 300 1.0 1.0 80,000 5
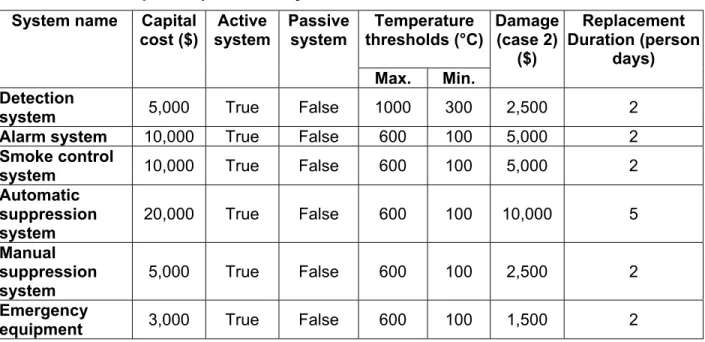
Table 5 Sample fire protection systems System name Capital
cost ($) Active system Passive system Temperature thresholds (°C) Damage (case 2) ($) Replacement Duration (person days) Max. Min. Detection
system 5,000 True False 1000 300 2,500 2
Alarm system 10,000 True False 600 100 5,000 2
Smoke control
system 10,000 True False 600 100 5,000 2
Automatic suppression system 20,000 True False 600 100 10,000 5 Manual suppression system 5,000 True False 600 100 2,500 2 Emergency
3.2 Results
Table 6 Sample results
Result Case 1 Estimate Damage Case 2 Given Damage Capital Cost Building (warehouse) $1,240,000 Contents (warehouse) $100,103
Fire protection system (warehouse) $30,286
Total capital cost in warehouse $1,370,389
Total Capital Cost $2,645,106
Damage
Building (warehouse) $59,048 $133,714
Contents (warehouse) $90,380 $80,080
Fire protection system (warehouse) $5,486 $15,143
Total damage in warehouse $154,914 $228,080
Total property loss $221,841 $598,181
Replacement Duration
Building (warehouse) 297 person days
Contents (warehouse) 10.5 person days
Fire protection system (warehouse) 8.5 person days
Total Rep. Duration in warehouse 316 person days Total replacement duration 576.5 person days Downtime
Building (warehouse) 87.6 person days 42.3 person days
Contents (warehouse) 9.5 person days 8.4 person days
Fire protection system (warehouse) 1.5 person days 4.3 person days
Total downtime in warehouse
(including cleaning time) 100.7 person days 57 person days Total downtime 133 person days 119 person days
4. REFERENCES
1. Hajisophocleous, G.V. and Yager B.L., 1996, FiRECAM Economic Model (ECMD), IRC Internal Report No. 723, Institute for Research in Construction, National Research Council of Canada, Ottawa, Ontario
2. Hajisophocleous, G.V. and Yager B.L., 1996, FiRECAM Property Loss Model (PLMD), IRC Internal Report No. 721, Institute for Research in Construction, National Research Council of Canada, Ottawa, Ontario
3. R.S. Means Co., 1996, Means Building Construction Cost Data, Kingston, MA
4. Hanscomb Consultants, 1997, Yardsticks for Costing, Construction Data Systems, Don Mills, Ontario
5. Noureddine Benichou, Ahmed Kashef, George Hadjisophocleous and Brent Yager, 2002, FIERAsystem Theory Report: Economic Model, Research Report No. 122, Institute for Research in Construction, National Research Council of Canada, Ottawa, Ontario