Publisher’s version / Version de l'éditeur:
The Journal of Physical Chemistry A, 105, 12, pp. 2756-2763, 2001-03-29
READ THESE TERMS AND CONDITIONS CAREFULLY BEFORE USING THIS WEBSITE. https://nrc-publications.canada.ca/eng/copyright
Vous avez des questions? Nous pouvons vous aider. Pour communiquer directement avec un auteur, consultez la première page de la revue dans laquelle son article a été publié afin de trouver ses coordonnées. Si vous n’arrivez pas à les repérer, communiquez avec nous à [email protected].
Questions? Contact the NRC Publications Archive team at
[email protected]. If you wish to email the authors directly, please see the first page of the publication for their contact information.
NRC Publications Archive
Archives des publications du CNRC
This publication could be one of several versions: author’s original, accepted manuscript or the publisher’s version. / La version de cette publication peut être l’une des suivantes : la version prépublication de l’auteur, la version acceptée du manuscrit ou la version de l’éditeur.
For the publisher’s version, please access the DOI link below./ Pour consulter la version de l’éditeur, utilisez le lien DOI ci-dessous.
https://doi.org/10.1021/jp003666o
Access and use of this website and the material on it are subject to the Terms and Conditions set forth at
Toward polyatomic wave packet decomposition: final state effects
Resch, Kevin; Blanchet, Valérie; Stolow, Albert; Seideman, Tamar
https://publications-cnrc.canada.ca/fra/droits
L’accès à ce site Web et l’utilisation de son contenu sont assujettis aux conditions présentées dans le site LISEZ CES CONDITIONS ATTENTIVEMENT AVANT D’UTILISER CE SITE WEB.
NRC Publications Record / Notice d'Archives des publications de CNRC:
https://nrc-publications.canada.ca/eng/view/object/?id=f0a28230-41a1-447c-a3c7-06d223ead9fc https://publications-cnrc.canada.ca/fra/voir/objet/?id=f0a28230-41a1-447c-a3c7-06d223ead9fc
Toward Polyatomic Wave Packet Decomposition: Final State Effects
† Kevin Resch,‡ Vale´rie Blanchet,§Albert Stolow, and Tamar Seideman*Steacie Institute for Molecular Sciences, National Research Council of Canada, Ottawa, Ontario, Canada K1A 0R6
ReceiVed: October 5, 2000; In Final Form: January 23, 2001
We present numerical studies of femtosecond time-resolved probes of coupled wave packet dynamics in model polyatomic systems. Of specific interest is the possibility of using the structure and symmetry of the final states accessed by the probe field to discern vibrational energy flow. Simple wave packets can often exhibit classical localization, thus facilitating a mechanistic, trajectory-like picture of the quantum dynamics. This feature, however, does not necessarily survive in complex multidimensional problems due to differing quantum mechanical dephasing rates in different degrees of freedom. To recover a classical-like picture of energy flow between coupled vibrational modes, we introduce a final-state-resolved measure of wave packet dynamics, a low-frequency band-pass filter of the signal, which is specifically sensitive to intermode energy flow.
1. Introduction
The excited states of polyatomic molecules typically exhibit complex intramolecular and dissociation dynamics. Vibrational mode coupling leads to energy flow (intramolecular vibrational energy redistribution, IVR), while the nonadiabatic coupling of electronic and vibrational degrees of freedom leads to both charge and energy flow. One of the important goals of molecular dynamics is the elucidation of these couplings in chemical processes. Femtosecond pump-probe studies of molecular dynamics1,2utilize the broad bandwidth of femtosecond lasers to coherently excite an energetically broad superposition of eigenstatessa wave packet. Wave packets of simple systems often exhibit classical localization and therefore are useful for developing a classical, trajectory-like picture of the quantum dynamics. The question we address here is to what extent wave packets can be used to achieve the same goal for more complex dynamics in coupled polyatomic systems.
To pursue this question, we begin with a consideration of how these dynamics are observed. The probe step in a pump-probe wave packet measurement can be viewed as projecting the wave packet at a well-defined series of times onto a given final state or a set of final states. It is the interference between transitions to this same final state that leads to modulations in the pump-probe signal as a function of time. The final state populations, measured incoherently, are related to the overlap between the evolving wave packet and the stationary eigen-functions of the final electronic state. A major role is played by the nature of the final state. A properly designed probe should serve to project out different components of the wave packet or focus on different time scales in its evolution. To this end, we have emphasized the importance of developing differential, that is, final-state-resolved measurements of pump-probe signals.3,4For instance, we have shown that the cation electronic state-resolved photoelectron spectrum can be used to disentangle
couple electronic-vibrational motions in both bound state and photodissociation dynamics.5,6 Currently employed detection techniques range from completely integrated to multiply dif-ferential measurements. Techniques such as dispersed fluores-cence,1 energy resolved photoionization,3,5-7 angle-resolved photoionization,4,8and translational energy spectroscopy9,10are differential, while total fluorescence1,11 and total ion mass spectrometry1,12are integral detection techniques.
One of the simplest examples of energy flow in an excited molecule is that of a Fermi resonance, for instance, between a stretch and a bend. We imagine a femtosecond pulse creating a zeroth order state which is initially “stretching”. Through a Fermi resonance, energy will flow into the bending degree of freedom. Can wave packet measurements extract a classical-like picture of the flow of energy between these coupled degrees of freedom? By using differential detection techniques, we might hope to do so. For example, using photoelectron spectroscopy3, we might consider employing the vibrational structure of the ion as a template for decomposing the dynamics. The stretching states of the ion would typically best overlap with the stretching components of the wave packet. Similarly, the bending states of the ion would overlap well with the bending components of the wave packet. By monitoring final state populations in the stretch and bend ion states as a function of time, one might expect to observe, in a classical sense, the flow of energy between these degrees of freedom.
The above picture, however, neglects the quantum mechanical dephasing, which obscures the classical dynamics as time progresses. Dephasing in wave packets of isolated systems is due to anharmonicities (unequal level spacings) which lead to a spreading of the wave packet. At short times, t ≈ 2π/ωvib, discrete wave packets typically follow the expectations of classical intuition, undergoing periodic vibrational motion at the fundamental frequencyωvib. At times approaching t ≈ Trev/∆V2, where Trevis the full revival time13and ∆V is the width of the wave packet, purely quantum mechanical dephasing, revivals, and fractional revivals spoil the classical picture and, in the multidimensional case, entangle energy transfer effects with the effects of anharmonicity. This implies that in multidimensional †Part of the special issue “William H. Miller Festschrift”.
* Corresponding author. E-mail: [email protected].
‡Present address: Department of Physics, University of Toronto, 60 St.
George St. Toronto, Ontario, Canada M5S 1A7.
§Present address: IRSAMC, Universite´ Paul Sabatier, Toulouse, France.
2756 J. Phys. Chem. A 2001, 105,
10.1021/jp003666o CCC: $20.00 © 2001 American Chemical Society Published on Web 03/22/2001
systems, dephasing in one coordinate can reduce overall signal levels and thus “hide” the dynamics occurring in other degrees of freedom. The simple-minded idea of selecting the final state to disentangle vibrational modes and thus observe classical-like intermode energy flow will classical-likely fail.
Our goal in the present work is to introduce a new observable that is capable of disentangling the signature of energy flow between vibrational modes from the effects of anharmonicity, thus restoring a classical-like picture of the former motion. The proposed observable is based on a low-frequency band-pass filter of the time dependent, final-state-resolved signal which projects out the high-frequency modes, in effect following the motion of an “artificial” wave packet composed solely of the modes that carry the information sought. Our discussion applies to all differential detection techniques which allow final state resolu-tion of the time domain signal.
The possibility of constructing a time-domain observable capable of focusing on the motion of interest is suggested by recent work14,15 that illustrated the ability of time-resolved photoionization asymmetry parameters to map rotation-vibra-tion coupling effects. The time-resolved photoionizarotation-vibra-tion dif-ferential cross section can be cast in the form16
where ∆t is the pump-probe time delay and θk is the polar
angle between the photoelectron ejection vector and the polarization vector, assumed to be common to the pump and probe fields. While the integrated cross section, σtot(∆t) is dominated by the high-frequency vibrations, as any integrated signal in time-domain chemistry, the asymmetry parameters, βj(∆t) respond to the slow rotations,14,15 describing, in the
classical limit, the rotational motion of the molecular axis with respect to an axis fixed in space. The effect of rotation-vibration coupling is then shown to produce a beat pattern inβj(∆t), whose
envelop provides a direct measure of the coupling strength.14,15 Thus, the measurement of the asymmetry parameters is analo-gous to applying a band-pass filter to the complex time-domain signal, extracting a wave packet in the slowly evolving degree of freedomsin this example, the rotation-vibration coupling. One may therefore hope that the ability of (properly resolved) time-domain techniques to focus on a time scale of interest is more general.
We note that low-frequency band-pass filtering of the signal of a femtosecond pump-probe experiment is not equivalent to carrying out a reduced bandwidth (e.g. picosecond) pump-probe experiment. In our observable, one considers a wave packet constructed from the small level spacings in the problem but, importantly, which are spread over the large bandwidth of a femtosecond laser pulse.
The utility of the new observable is illustrated by application to the wave packet dynamics corresponding to a model Hamiltonian of coupled anharmonic oscillators. We use a simple yet general model of intramolecular coupling which allows wide variation of the coupling parameters and hence representation of a variety of chemical system types. The next section briefly reviews the theory4and defines our model. Section III presents and discusses the results and the final section concludes with an outlook for future work.
II. Theory
We consider a generic short-pulse pump-probe scenario. The system, initially prepared in a single eigenstate of the ground
Hamiltonian Hg, is projected by a short pulsebεpu(t) onto an excited manifold He. A second, time-delayed pulsebεpr(t) probes the evolving wave packet by excitation to a single final state. Several simplifying assumptions are introduced at the outset. The laser fields are assumed to be perturbative, angular momentum is neglected, and details of the bound-free dynamics are omitted. In reality, strong field effects, including the population of a ground-state wave packet17and the Stark shift or distortion of the potential energy, are expected to play a nontrivial role in most short-pulse gas-phase experiments, and their inclusion in the formalism may modify the dynamics. Our qualitative conclusions, however, would not be altered in the presence of nonperturbative fields. The neglect of angular momentum is not even qualitatively valid for cases in which the laser field can induce rotational excitation.18Nevertheless, as discussed in ref 18, field-induced rotational excitation is significant when the pulse duration exceeds the inverse Rabi coupling. Often it is possible to design experiments where it plays a secondary role. Initial rotational temperature and the exchange of a single quantum of angular momentum between the system and the field upon excitation modify the details of the wave packet evolution but not its qualitative features.
The complete Hamiltonian is thus
where H0is the field-free Hamiltonian,b is the transition dipoleµ operator
εˆi is a unit vector along the polarization direction,ωiis the
central frequency, and fi(t) is a smooth envelope. In the case of
a Gaussian pulse
The pump pulse,bεpu(t) couples the initially prepared state with the excited state to be studied. The probe pulse,bεpr(t) projects the wave packet onto an ionization or dissociation continuum. After the pump pulse, at times t > tpu+ 2τpu, the wave packet is written in terms of the discrete stationary eigenstates of the molecular Hamiltonian as
where |ξVξ〉)|ξ〉|Vξ〉,ξ denotes an electronic index (g standing for ground and e for excited state), Vξis the vibrational quantum number, and CξVξ(t) is the time-dependent coefficient,
deter-mined by the excitation process and the matrix elements of the dipole transition operator between |ξVξ〉 and the initial state. Atomic units are used in eq 2 and throughout this paper. In general, CξVξ(t) is obtained by substituting eq 2 in the
time-dependent Schro¨dinger equation and using the orthogonality of |ξVξ〉 to cast the problem in the form of a set of coupled differential equations.4 In the present study, C
ξ
Vξ(t) is
ap-proximated by its first-order perturbation limit
where we invoked the rotating wave approximation, Vgiis the
σ(∆t,θk) ) σtot(∆t) 4π [1 +β2(∆t)P2(cosθk) + β4(∆t)P4(cosθk)] H ) H0- µb‚ εb(t) b(t) ) εbε pu(t) +bεpr(t) (1a) ε b i(t) )εˆifi(t)e -iωit+ c.c. i )pu, pr (1b) fi(t) ) 1 2εiexp[-(t - ti) 2 /τi2]. (1c) |Φ(t)〉)
∑
ξ)g,e∑
Vξ CξVξ(t)|ξV ξ〉exp(-iEξ Vξ t) (2) Ce Ve (t) ≈x2π i 〈eVe|µb‚εˆpu|gVg〉ε˜pu(Ee Ve - EeVg ) ) Ce Ve Ce Vg (t) ≈δV g,Vgi (3)initial vibrational quantum number andε˜pu(ω) is the Fourier transform of the pump pulse. In the case of a Gaussian envelope
After the probe pulse, at times t > tpr+ 2τpr, the wave packet is written as a superposition of discrete and continuum stationary eigenstates
where ξc and Vc denote, respectively, bound electronic and vibrational indices of the final state and ǫ is the continuum energy. In the specific case of photoelectron detection,ξcand Vcare the electronic and vibrational indices of final state, ǫ is the photoelectron energy, and |ǫξcVc〉is a product of a nuclear core state by an electronic eigenstate describing the ionized electron and the electronic wave function of the core.
The final-state-resolved signal, integrated over the range of continuum energies determined by the effective bandwidths of the laser pulses, is given as4,16
where we substituted eq 5 in the time-dependent Schro¨dinger equation, approximated the probe field by its rotating wave Golden rule limit and used eq 3. In eq 6, the dependence of the signal on the pump-probe time-delay, ∆t ) tpr- tpu, is implicit in the ε˜, eq 4. In principle, the energy integration should be done numerically. In most cases, however, variation of the bound-free dipole elements in eq 6 with energy is negligible as compared to the rapidly oscillating term ofε˜ [see eq 4]. This holds true except in the vicinity of resonances. Since in practice one would avoid the vicinity of resonances (where the probe dynamics obscures the wave packet information sought), neglect of the energy dependence of the 〈ǫξcVc|µb‚εˆpr|eVe〉 within the (relatively narrow) energy range spanned by the pulse is valid.
Within this approximation, energy integration can be done analytically4obtaining
where, in deriving the first equality, we substituted the Gaussian envelope [eq 4] in eq 6 and, in deriving the second equality, we defined real arithmetic amplitudes f˜i(ω) through
and used eq 3. We denoted by ΦVe,V′ethe relative phase of the
two bound-free transition dipole elements.
The molecular Hamiltonian, H0is eq 1a, is constructed to provide the simplest possible model that is sufficiently general and flexible to represent a range of chemical systems of interest: a coupled two-dimensional Morse oscillator where the parameters of one oscillator depend on the coordinate of the other. The excited potential energy is thus a function of two coordinates (Qa,Qb)
where
and
The nature of the intermode coupling and its magnitude are determined by the A constants of eqs 8b-8d, which serve as variable parameters in the model. The B-constants are fixed to ensure smooth behavior of the potential energy curves.
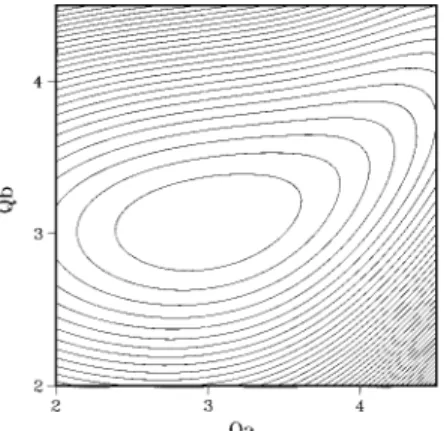
Figure 1. Example of the excited-state potential energy surfaces used in the calculations of Figures 2-7. The frequencies areωa) 200 cm-1 andωb ) 350 cm-1; anharmonicity is 13 cm-1in both modes, and mode coupling is introduced through dependence of the equilibrium distance in mode b on Qa(see eq 8c). The initial and final potential energy surfaces (not shown) are both 2D harmonic functions, as discussed in the text.
ε˜i(ω) ) εiτi8 -1/2 exp[-i(ωi- ω)ti- τi 2 (ωi- ω) 2 /4] (4) |Ψ(t)〉)|Φ(t)〉+
∫
dǫ∑
ξcVc Cξ c Vc (ǫ,t)|ǫξcVc〉e -i(EξcVc+ǫ)t (5) σ(ξcV c|∆t) ) lim tf∞∫
dǫ |Cξc Vc (ǫ, t)|2 ) 4π2∫
dǫ |∑
Ve 〈ǫξcVc|µb‚εˆpr|eVe〉〈eVe|µb‚εˆpu|gVg〉 ε˜pr(Eξ c Vc + ǫ - EeVe)ε˜ pu(Ee Ve - EeVg)|2 (6) σ(ξcV c|∆t) ) 2π∑
VeVe′ Ce Ve Ce Ve′*〈 ǫξ cVc|µb‚εˆpr|eVe〉 〈eV′e|µb‚εˆpr|ǫξcVc〉∫
dǫε˜pr(Eξc Vc + ǫ - EeVe )ε˜*pr(Eξ c Vc + ǫ - EeV′e) )(
π 2)
3/2 εpr2τpr∑
VeVe′ Ce Ve Ce Ve′*〈 ǫξ cVc|µb‚εˆpr|eVe〉 〈eV′e|µb‚εˆpr|ǫξcVc〉exp[
-τpr 2 8(Ee Ve - EeV′e)2]
exp[-i(Ee Ve - Ee V′e )tpr] )x
2π5 εpr 2 τpr∑
VegVe′ 1 1 +δV e,V′e f˜pu(Ee Ve - EgVg )f˜pu(Ee V′e - EgVg ) 〈ǫξcVc|µb‚εˆpr|eVe〉〈eVe|µb‚εˆpu|gVg〉〉〈gVg|µb‚εˆpu|eV′e〉 〈eV′e|µb‚εˆpr|ǫξcVc〉exp[
-τpr2 8(Ee Ve - EeV′e)2]
cos[(EeVe- E e V′e )∆t + ΦV e,V′e] (7) f˜i(ω)e i(ω-ωi)ti) 1 x2π∫
-∞ ∞ dt fi(t)ei(ω-ωi)t Ve(Qa,Qb) ) Da(exp{-βa(Qa- Qa eq )}- 1)2 + Db(Qa)(exp{-βb(Qa)[Qb- Qb eq (Qa)]}- 1) 2 (8a) βb(Qa) )βb,0+ Aβ 1 + exp[(Qa m- Q a)/Bβ] (8b) Qb eq (Qa) ) Qb,0 eq + AQeq 1 + exp[(Qam- Qa)/BQeq] (8c) Db(Qa) ) Db,0+ AD 1 + exp[(Qam- Qa)/BD]. (8d)The choice of fundamental frequencies matters little; rather, the ratio of the vibrational level spacing to the pump bandwidth is relevant. Similarly, it is the ratio of the anharmonicy to the mode coupling, rather than the anharmonicity itself, that determines the dynamics. In the calculations below, we choose fundamental frequencies ofωa) 200 cm-1andωb) 350 cm-1 with an anharmonicity of 13 cm-1and vary the coupling strength in a wide range in order to test the generality of the observable introduced. A contour plot of an excited potential energy surface with parameters corresponding to one of the calculations described in the next section is shown in Figure 1. The pulse duration is taken to be 20 fs.
Both the initial and the final eigenstates are approximated as separable harmonic functions, Vi(f)) Vi(f),0+1/2∑v)a,bωv
2 (Qv - Qv
eq)2. In all examples studied, the system is initially in the ground vibrational level, and the final state geometry is identical to that of the initial state. These idealizations are clearly unnecessary but appropriate for the present model, within which the initial and final states have no active role but serve simply to define the initial conditions and to provide a “template” for detection of the wave packet evolution. The vibrational frequen-cies of the initial and final potential energy surfaces do not play a crucial role and are taken for simplicity to equal those of the surface. By contrast, the equilibrium displacement between the initial and probed surfaces is a significant parameter even in a qualitative exposition, since it determines the sense and magnitude of the initial wave packet momentum. This equilib-rium displacement is thus a variable parameter in the model and its role is briefly examined in the next section.
III. Results and Discussion
It is our purpose to investigate the utility of the vibrational structure of the final state in projecting out various aspects of multidimensional wave packet evolution. We expect the nature of the final state (e.g., vibrational and/or electronic symmetry) to have a large effect on the form of time-resolved signals. The set of such projections will hopefully provide new views of complex wave packet evolution. We begin with a brief review of two-dimensional wave packet dynamics on uncoupled excited-state potential energy surfaces. Our aim in reviewing the trivial case of uncoupled modes is to illustrate the effects of the geometry of the initial and vibrational symmetry of final state on the signals. Considering next vibrational mode coupling, we investigate the ability of the final vibrational state to provide a quantitative measure of vibrational energy flow.
Figure 2 illustrates the role played by the geometry of the initial state (which determines the sense and magnitude of the initial momentum of the wave packet). Panels a-c show normalized time-resolved signals for projection onto the vibra-tionless (0,0) final state for different equilibrium displacements between the initial and probed potential energy surfaces. In panel a, the equilibria are displaced in Qa; in panel b, they are displaced in Qband in panel c in both coordinates. It should be noted that a (0,0) final state is equally sensitive to both Qaand
Qb motions. Figure 2a shows a wave packet signal which resembles the one-dimensional revival structure of an anhar-monic oscillator in mode a. Similarly, Figure 2b shows a wave packet signal which is reminiscent of one-dimensional revival structure of an anharmonic oscillator in mode b. Since Qaand
Qbare uncoupled, the energy initially deposited in a given mode
Figure 2. Normalized signals and spectrograms, eq 10, from the (0,0) final vibrational state for uncoupled 2D excited-state wave packets. (a) Wave packet motion along the coordinate only. (b) Motion along the coordinate only. (c) Motion along both and coordinates simultaneously. In all spectrograms plotted in this paper, the abscissa ranges from 0 to 840 cm-1, marked in steps of 200 cm-1, the ordinate ranges from -1 to 41 ps,
marked in steps of 10 ps, and the spectral power in mode a is shown in green, in mode b in red, and in combination modes in black.
remains in that degree of freedom giving rise to quasi-one-dimensional motion. Figure 2c is evidently more complex.
The logarithmic spectrogram, ln[S(ω, τ)], of each time-resolved signal is shown to its right. The spectrogram is defined as19,20
where g(t) ) e-t2/t
02and t0is taken to be 1 ps in the examples
considered here. The spectrogram reveals the phase relationships between different frequencies and, in simple cases, the revival and fractional revival structure of the wave packet evolution.19-21 To facilitate comparison, we plotted all logarithmic spectrograms in this work on the same scale: the transforms are performed on normalized signals, and the results are plotted with the same contour spacing. Throughout the paper, the signals associated with Qa-motion (i.e.ωa, 2ωa, 3ωa) are shown in green, whereas those associated with Qb-motion are shown in red. Signals associated with combination modes (eg. 2ωa-ωb) are shown in black.
Panels a and b of Figure 2 show canonical one-dimensional wave packet behavior with revival structure in modes a (green) and b (red), respectively. Since the vibrations are uncoupled and the initial excitation is along one coordinate only in these cases, the excitation remains isolated, and each wave packet behaves as an essentially one-dimensional entity. In Figure 2c, by contrast, the wave packet propagates along both coordinates. It can be seen that, although no vibrational coupling has been introduced, the behavior is qualitatively different from one-dimensional wave packets, with slight shifts in the frequencies due to smaller anharmonicities in each oscillator at this level of excitation. Aside from the usual revival structures for each oscillator, we also observe the various sum and difference frequencies. It can be seen that at about 22 ps, the overall wave packet revives, and all the frequencies are observed as at ∆t ) 0. An essential characteristic of multidimensional time-resolved wave packet signals is that even when the modes are uncoupled, the degree of wave packet dephasing in one coordinate obscures the ability to observe wave packet motion in the others. As discussed below, this fundamental characteristic implies that the spectrogram, like the bare time-resolved signal, would fail in
general to clearly reflect the flow of energy between coupled degrees of freedom in a classical sense.
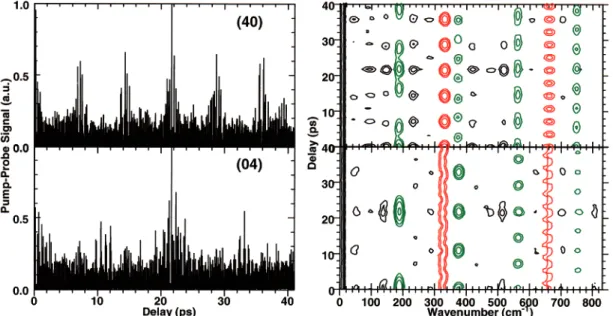
Figure 3 shows the effect of the vibrational symmetry of the final state on the time-resolved signals for the same wave packet as that in Figure 2c (i.e., a wave packet propagating along both coordinates). In the Figure 2c, the final vibrational state is (0,0), and the wave packet evolves along both (uncoupled) modes. In Figure 3, we show the time-resolved signals for that wave packet from the (4,0) and (0,4) final vibrational state. The vibrational symmetry of the final state has a large effect on the signals. A (4,0) vibrational state is extended along the Qa direction and has four nodes. Likewise, a (0,4) vibrational state is extended along the Qb direction and has four nodes. The top panel of Figure 3 illustrates the effect of the nodal structure of the final state on the time-resolved signal and spectrogram. The funda-mental revival in mode a along the 185 cm-1line at about 20 ps is broken into three maxima since the wave packet is detected by only three of the five lobes when it passes the Condon region. The revival structure in mode b along the 330 cm-1line remains unperturbed since, in this dimension, the “window” is similar to that of Figure 2c. By contrast, in the bottom panel of Figure 3, the revival structure along the 185 cm-1 line remains relatively unperturbed, and it is the fundamental revival along the 330 cm-1 line which is broken into small maxima. The results of Figures 2 and 3 show that even in the case of an uncoupled two-dimensional anharmonic oscillator, the time-resolved wave packet signals and spectrograms can become complicated to interpret. They also illustrate that the vibrational structure and symmetry of the detection (final) state has a central role in determining the form of the observable.
A. Mode Coupling.We next consider the more interesting and realistic problem of vibrationally coupled modes. Anhar-monicity leads to unequal level spacings and, therefore, dephas-ing of the wave packet on a time scale t ≈ Trev/∆V2, where Trev is the full revival time13and ∆V measures the width of the wave packet. Vibrational coupling similarly leads to unequal level spacings and, hence, time-domain dynamics at comparable time scales. The physical significance of these two effects is very different: in the case of anharmonicity, it is the quantum aspect
Figure 3. Normalized signals and spectrograms for uncoupled wave packet motion along both Qaand Qbcoordinates simultaneously. Top panel:
signals from the (4,0) final vibrational state. Bottom panel: signals from the (0,4) vibrational state. The differences between those and Figure 2c are due only to the final state since the wave packet evolution is identical in these three cases.
S(ω,τ) )
∫
0 ∞
s(t)g(t -τ)eiωtdt (10) 2760 J. Phys. Chem. A, Vol. 105, No. 12, 2001
of the evolution which leads to dephasing; in the case of vibrational coupling, it is the flow of energy between degrees of freedom.
The model described in section II allows coupling to be systematically introduced in several ways, corresponding to different energy transfer mechanisms. Here we limit attention to coupling of the equilibrium configuration in one mode to motion in the other, Aβ) AD) 0, AQeq* 0 in eq 8. To allow
physically meaningful interpretation of the results, it is conve-nient to measure the magnitude of the coupling in terms of the splitting it induces in the energy eigenvalues of the stationary states comprising the wave packet. Below, we adjust the coupling parameter to produce an average energy splitting ranging from 3 to 21 cm-1. The anharmonicity in both modes is kept constant and equal to that in Figures 2 and 3, corresponding to the middle of the coupling strength range (ca. 13 cm-1). Two limiting cases are noted: (1) much greater anharmonicity than mode coupling and (2) much smaller anharmonicity than coupling. In the former, the wave packet dephases before energy transfer can occur, obscuring a classical picture of energy transfer. In the latter, energy transfer can occur in the quasiclassical stage of the evolution, with dephasing setting in on longer time scales. The potential energy surface of Figure 1 corresponds to an intermediate case, with coupling strength of the order of the anharmonicity.
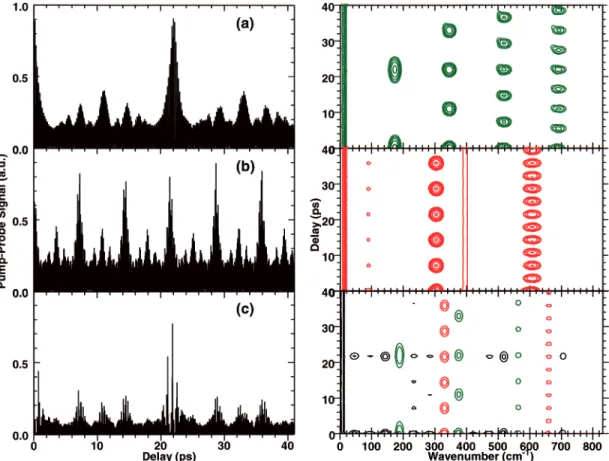
The time-resolved signals and spectrograms corresponding to the potential energy surface of Figure 1 are given in Figure 4. To focus on the effects of mode coupling, the initial momen-tum is set along Qa only, as in Figure 2a. One might expect that a comparison of the signals for final states (0,n) and (n,0) would be sensitive to energy flow between Qa and Qb. The bottom and middle panels of Figure 4 show the time-resolved signals for the (0,4) and (4,0) final vibrational states,
respec-tively. In the top panel, we show the time-resolved signal for projection onto the (0,0) final state. A delay of about 1.2 ps between the maxima of signals shows that motion along Qb, induced solely by the coupling, appears only after a time-delays a characteristic time scale of the energy transfer. This notion is made more precise below. The spectrograms derived from the time-resolved signals are shown to the right. The coupling clearly spoils the simple revival structure seen in Figure 2, the revival of mode b, although present, is not observed at all. Neither the spectrogram corresponding to the (0,4) final state nor that corresponding to (4,0) convey a clear physical picture of transfer of excitation. The simple classical notion of spectral power varying between one oscillator and the other fails completely.
We have studied the form of the time-domain signals as a function of the coupling strength, ranging from much less to much greater than the anharmonicity (vide infra). We have observed that the loss of revival structure occurs even with weak coupling. As the coupling increases, the signals becomes increasingly irregular. The implicit flow of energy between the degrees of freedom, however, is not obvious in either the time-resolved spectra or the spectrograms. In general no simple transfer of intensity from the fundamental frequency of mode a to that of mode b is evident from these observables. The main reason for this is that spreading of the wave packet typically takes place on a time scale comparable to that of intermode flow of energy. It is this spreading that precludes a simple classical picture of the motion, analogous to that of the short time vibrations of wave packets.
To develop a general method for observing the energy transfer between coupled modes, we introduce here a technique based on band-pass filtering of the multimode wave packet, designed to focus on the low-frequency modes by filtering out the
high-Figure 4. Normalized signals and spectrograms for a mode-coupled 2D wave packet, from the (0,0) final state (top panel), the (4,0) final state (middle panel), and the (0,4) state (bottom panel). Initial motion is along the mode only. The vibrational coupling leads to motion in the coordinate and destroys the simple revival structures seen in Figures 2 and 3.
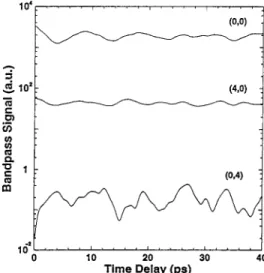
frequency components. Since the time scale of the flow of energy between modes is much longer than the fundamental periods themselves (otherwise the fundamental periods are not defined), a low-frequency band-pass of the vibrationally resolved signal could serve as a general and direct measure of the former motion. Band-pass filtering amounts to monitoring a wave packet of low-frequency components but spread over a large bandwidth, whose time-evolution traces the slow energy flow alone. Figure 5 shows a low frequency (here 5-15 cm-1) band-pass
of the spectra shown in Figure 4. For comparison, we show
B(τ) also for the (0,0) vibrational state. We note that the (4,0) and (0,0) signals are in phase, whereas the (4,0) and (0,4) signals are out of phase. Figure 5 clearly reflects the flow of energy between Qa and Qb, seen to be on a time scale of 1.2 ps, as expected for the coupling strength (ca. 13 cm-1) used in this example. Initially, the wave packet energy is localized in the
Qadegree of freedom, as prepared. As the evolution proceeds, the coupling transfers the energy to the Qbdegree of freedom, and the energy in the Qamode correspondingly decreases; hence, the two band-pass signals are out of phase. In this simple two-dimensional Fermi resonance case, the energy, of course, flows back to mode Qaon the same time scale, producing a periodic structure whose period measures directly the coupling strength. The slower envelope modulations, leading to dephasing at longer times, are due to the effects of anharmonicity, now clearly distinguishable. We note that the results are insensitive to the choice ofω+,-in eq 11 within reasonable limits; other band-pass ranges (e.g. 20-30 cm-1) give similar results.
Figure 5 suggests that the low-frequency band-pass filter responds directly to the time scale of intramolecular energy flow and recovers a classical picture of this flow. To quantify this notion, we next examine in detail the dependence of the observable on the coupling strength, in particular, its magnitude relative to the anharmonicity.
Figures 6 and 7 show, respectively, the cases of weak and strong mode coupling, where “weak” (“strong”) is meant with respect to the anharmonicity, equivalently, with respect to the coupling strength of Figure 5. As the coupling strength increases,
the magnitude of the (4,0) signal decreases with a corresponding increase in the magnitude of the (0,4) signal. In the case of weak coupling (Figure 6), the canonical revival structure dominates the form of the signals, as in Figures 2 and 3, and the signal is modulated on a much longer time scale than that of Figure 5. As the coupling strength increases (Figure 7), the modulation frequency increases, measuring quantitatively the expected faster time scale of the intermode energy flow. For the case of zero coupling (not shown), the band-pass signals show only the effects of anharmonicity and the (0,4) and (4,0) signals are essentially the same. It is noted that the period of undulations in Figures 5-7 corresponds to the time scales expected from the average splitting of the energy eigenvalues, ∆E ) 3.4, 13, and 21 cm-1in the examples shown in Figure 5, 6, and 7, respectively. Comparison of the upper and middle curves of Figure 6 (or 7) illustrates again that the (4,0) and (0,4) band-pass signals are out of phase, reflecting initial motion exclusively along the Qa coordinate which is subsequently periodically transferred between the two modes.
The band-pass filter introduced above is a sensitive measure of the time scales of energy flow between degrees of freedom.
Figure 5. Low-frequency band-pass filter [eq 11] of the signals of Figure 4. The band-pass signal illustrates the flow of energy from mode a to mode b on a 1.2 ps time scale, corresponding to the mode coupling strength of 13 cm-1employed.
B(τ) )
∫
ω-ω+
S(ω, τ) dω (11)
Figure 6. Band-pass signal for the same anharmonicity but weaker mode coupling (3.4 cm-1) than that of Figure 5. The modulation period is significantly increased, as expected for weaker coupling, illustrating the sensitivity of the band-pass signals to the vibrational coupling strength.
Figure 7. Band-pass signal for the same anharmonicity but stronger mode coupling (21 cm-1) than that of Figure 5. The modulation period is significantly decreased, as expected for stronger coupling, affirming the utility of the band-pass as a measure of mode coupling time scales.
It might be thought that this observable is equivalent to the pump-probe signal of a long-pulse (picosecond) experiment. This is not the case. A picosecond pump pulse coherently excites a few narrowly spaced energy levels and a picosecond probe pulse projects these onto a given final state. By contrast, a femtosecond pump pulse prepares a broad energy range of levels. The femtosecond probe pulse has sufficient bandwidth to project all of these onto a given final state. The band-pass filter selects from this superposition of signals all pairs of small level spacingsswhich are distributed over a large energy ranges that fall within the frequency pass. The resultant band-pass signal obtains from a wave packet in the degree of freedom corresponding to the small level spacings, reflecting the flow of energy between modes.
In an experimental realization, there will be, of course, amplitude noise in the low-frequency part of the pump-probe spectrum due to drifts in experimental conditions. Undoubtedly, this will hamper the ability of band-pass analysis to clearly extract intermode energy flow effects. With many probe schemes (for instance, photoelectron spectroscopies3,5-7), the dispersed signals are collected in a multiplex fashion. That is to say, in the context presented here, that the (0,0), (0,4) and (4,0) signals are collected simultaneously. Since drifts in experimental conditions affect each of these signals in the same way, it should be possible to project out this “common mode” noise and, hence, extract the desired information from a comparison of the signals corresponding to different vibrational final states.
IV. Conclusion
We proposed a means of using time-domain measurements to study intermode energy flow in multidimensional systems, thus providing a time-dependent view of vibrational coupling mechanisms in polyatomic molecules. The scheme was exem-plified through a simple numerical model, intended to describe the essential features of different chemical systems by variation of the coupling nature and strength.
One key element in the method is the use of the natural structure and symmetry of the final state accessed by the probe pulse to project out given components of a time-evolving wave packet. For the example of photoelectron detection, for instance, the feasibility of observing energy exchange between coupled vibrational modes may be studied by projecting the wave packet onto ion states of differing vibrational character.
The problem of following energy exchange between coupled vibrational modes in quantum mechanical systems is compli-cated, primarily due to wave packet dephasing taking place on shorter or comparable time scales. We found that the conven-tional observables of time-domain spectroscopy may not be capable of providing a transparent picture of energy flow even in the limit of an idealized model. Our results illustrated the need for a new measure, specifically sensitive to the time scale of motion of interest and capable of extracting out of a complex superposition of many components those conveying the infor-mation sought.
Our strategy in addressing this problem is best visualized by noting its analogy to a recently introduced method14 for constructing a time-domain measure of rotation-vibration couplings by extracting the moments of angle resolved signals. For the case of energy flow between vibrational modes, we
introduced low-frequency band-pass filtering of the final-state-resolved signal (eq 11). The band-pass effectively averages out the fast vibrational components of the wave packet motion, focusing on the modes relevant to the problem of interest which are, nonetheless, spread over a large energy range. When combined with vibrational resolution of the final state, this observable was found to provide a clear, physical picture of energy flow between coupled modes and a quantitative measure of the degree of coupling. We expect that the same general concept may find applications in other time-domain approaches to the study of coupling mechanisms.
Acknowledgment. We thank S. Nielsen and Prof. D. M. Wardlaw for much help and many useful discussions during the course of this work.
References and Notes
(1) Zewail, A. H. Femtochemistry: Ultrafast Dynamics of the Chemical
Bond; World Scientific: Singapore, 1994.
(2) Manz, J. Molecular Wave packet Dynamics: Theory for Experi-ments 1926-1996. In Femtochemistry and Femtobiology; Sundstrom, V., Ed.; World Scientific: Singapore, 1997.
(3) Fischer, I.; Villeneuve, D. M.; Vrakking, M. J. J.; Stolow, A. J.
Chem. Phys. 1995, 102, 5566.
(4) Seideman, T. J. Chem. Phys. 1997, 107, 7859.
(5) Blanchet, V.; Zgierski, M. Z.; Seideman, T.; Stolow, A. Nature
1999, 401, 52.
(6) Blanchet, V.; Lochbrunner, S.; Schmitt, M.; Shaffer, J. P.; Larsen, J. J.; Zgierski, M. Z.; Seideman, T.; Stolow, A. Faraday Discuss. 2000,
115, 33.
(7) Seel, M.; Domcke, W. J. Chem. Phys. 1991, 95, 7806. Cyr, D. R.; Hayden, C. C. J. Chem. Phys. 1996, 104, 771. Engel, V. Chem. Phys. Lett.
1991, 178, 130. Assion, A.; et al.. Phys. ReV. A 1996, 54, R4605. Greenblatt, B. J.; Zanni, M. T.; Neumark, D. M. Chem. Phys. Lett. 1996, 258, 523. Radloff, W.; Stert, V.; Freudenberg, Th.; Hertel, I. V.; Jouvet, C.; Dedonder-Lardeux, C.; Solgadi, D. Chem. Phys. Lett. 1997, 281, 20. Blanchet, V.; Stolow, A. J. Chem. Phys. 1998, 108, 4371. Schick, C. P.; Carpenter, S. D.; Weber, P. M. J. Phys. Chem. A 1999, 103, 10470.
(8) Noguchi, T.; Sato, S.; Fujimura, Y.; Chem. Phys. Lett. 1989, 155, 177; Reid, K. L.; Chem. Phys. Lett. 1993, 215, 25. Reid, K. L.; Duxon, S. P.; Towrie, M.; Chem. Phys. Lett. 228, 228, 351. Althorpe, S. C.; Seideman, T. J. Chem. Phys. 1999, 110, 147. Reid, K. L.; Field, T. A.; Towrie, M.; Matousek, P. J. Chem. Phys. 1999, 111, 1438. Suzuki, T.; Wang, L.; Kohguchi, H. J. Chem. Phys. 1999, 111, 4859. Arasaki, Y.; Takatsuka, K.; Wang, K.; McKoy, V. Chem. Phys. Lett. 1999, 302, 363. Seideman, T. J.
Chem. Phys. 2000, 113, 1677.
(9) Cheng, P. Y.; Zhong, D.; Zewail, A. H. J. Chem. Phys. 1996, 105, 6216.
(10) Davies, J. A.; LeClaire, J. E.; Continetti, R. E.; Hayden, C. C. J.
Chem. Phys. 1999, 111, 1.
(11) Ionov, S. I.; Brucker, G. A.; Jaques, C.; Valachovic, L.; Wittig, C.
J. Chem. Phys. 1993, 99, 6553.
(12) Baumert, T.; Bu¨hler, B.; Grosser, M.; Thalweiser, R.; Weiss, V.; Wiedenmann, E.; Gerber, G. J. Phys. Chem. 1991, 95, 8103.
(13) Averbukh, I. Sh.; Perel’man, N. F. SoV. Phys. JETP 1989, 69, 464. Leichtle, C.; Averbukh, I. Sh.; Schleich, W. P. Phys. ReV. Lett. 1996, 77, 3999.
(14) Althorpe, S. C.; Seideman, T. J. Chem. Phys. 2000, 113, 7901. (15) Seideman, T.; Althorpe, S. C. J. Electron Spectrosc. Relat. Phenom.
2000, 108, 99.
(16) Seideman, T. Submitted to Phys. ReV. A.
(17) Hartke, B.; Kosloff, R.; Ruhman, S. Chem. Phys. Lett. 1989, 158, 238.
(18) Seideman, T. J. Chem. Phys. 1995, 103, 7887.
(19) Fischer, I.; Vrakking, M. J. J.; Villeneuve, D. M.; Stolow, A. Chem.
Phys. 1996, 207, 203.
(20) Vrakking, M. J. J.; Villeneuve, D. M.; Stolow, A. Phys. ReV. A
1996, 54, R37.
(21) Grebenshchikov, S. Yu.; Beck, C.; Flo¨thmann, H.; Mordaunt, D. H.; Schinke, R. Chem. Phys. Lett. 1997, 271, 197.