Channeling in Purine Biosynthesis: Efforts to Detect Interactions between PurF and
PurD and Characterization of the FGAR-AT Complex
by
Aaron A. Hoskins
B.S. Chemistry Purdue University, 2000
Submitted to the Department of Chemistry
in Partial Fulfillment of the Requirements for the Degree of
Doctor of Philosophy in Biological Chemistry
at the
MASSACHUSETTS INSTITUTE OF TECHNOLOGY
January 2006
Signature of Author:
Certified by:
Accepted by:
© 2006 Massachusetts Institute of Technology
All rights reserved-_/ / /
Department of Chemistry
January 19, 2006 (Professor JoAnne Stubbe
Thesis Supervisor
U J / IProfessor Robert W. Field Chairman, Departmental Committee on Graduate Students
MASSACHUSEIzM IN.lU1I
OF TECHNOLOGY
-This doctoral thesis has been examined by a Committee of the Department of Chemistry as
follows:
C
/7
Professor Barbara Imperiali
\
Chairperson
Professor JoAnne Stubbe
Thesis Supervisor
Professor Catherine Drennan
I
-,/
Acknowledgements
First, I would like to acknowledge my parents (Mom and Dad), grandparents (Boobie and Grampa), Aunt Betty, and Aunt Doris. Without their support, this thesis would not have been possible.
Second, I would like to thank JoAnne for taking me into her lab, teaching me how to assay enzymes, and making me a better scientist.
I gratefully acknowledge all those in the Stubbe lab who have helped and aided me throughout the years. You all mean so much to me.
In particular, I would like to thank Jesse Chen for being the best labmate and friend I can iagine. I'm not sure how I will be able to do science again without having
him just 3 feet away. Let's keep the memory of Gertrude Ederle alive.
I would also like to thank Professors Imperiali and Drennan for helpful advice and
discussions.
I would like to thank Amy, Niki, Blair, Greg, and Pedja for being the friends that keep me grounded and for making me laugh.
I would like to thank Greg, Graham, Dan, and Diana for getting me out of the lab and for making me realize that I've based my graduate life on lessons learned from a
movie staring David Bowie and the Muppets.
I would like to thank Brent Fisher for being such a great friend and a wonderful human being.
I would like to thank Matt and Jeff for reasons too detailed to explain here. Jeff in particular for making a most gracious and unique offer to help me through writing this thesis.
I would like to thank Debby Pheasant for being supportive and enthusiastic and for being there.
I would like to thank members of the Schwalbe lab for giving me a great start in graduate school. Especially Jens, who has turned from a great mentor to a great friend.
I would also like to thank the congregations of the University and Holy Trinity
Lutheran Churches for their support. Through God all things are possible.
Channeling in Purine Biosynthesis: Efforts to Detect Interactions
between PurF and PurD and Characterization of the FGAR-AT
Complex
By
Aaron A. Hoskins
Submitted to the Department of Chemistry in January, 2006 in Partial Fulfillment of the
Requirements for the Degree of Doctor of Philosophy in Biological Chemistry
ABSTRACT
Purine biosynthesis has been used as a paradigm for the study of metabolism of unstable molecules. Both phosphoribosylamine (PRA) and N5-carboxyaminoimidazole ribonucleotide (N5-CAIR) have estimated half-lives in vivo of seconds. In order to avoid
metabolite decomposition, one strategy cells could employ is channeling-the direct
transfer of a rnetabolite between enzyme active sites without diffusion into the bulk media. While kinetic evidence for channeling of PRA has been reported betweenphosphoribosylpyrophosphate amidotransferase (PurF) and glycinamide ribonucleotide
synthetase (PurD), no evidence for a PurF:PurD complex has been found. In an effort todetect this complex, stopped-flow fluorescence spectroscopy was used to detect changes
in PurF fluorescence that may result from interaction with PurD. Critical to the success ofthese experiments was incorporation of tryptophan analogs (4-fluorotryptophan and
7-azatryptophan) into the proteins in order to increase signal specificity for PurF. No evidence for a PurF:PurD interaction was found under any of the conditions tested. The implication of this finding is discussed with regard to the PurF:PurD channeling model.Like all amidotransferase enzymes (ATs), channeling of NH
3between glutaminase
and AT active sites has been implicated in the formylglycinamide ribonucleotide amidotransferase (FGAR-AT). In B. subtilis, the FGAR-AT is composed of three
proteins: PurS, PurQ, and small PurL. The first characterization of the B. subtilis FGAR-AT complex was carried out, and it was determined that a complex between the three proteins can only be isolated in the presence of Mg2+-ADP and glutamine. By analogy to the Salmonella FGAR-AT, ADP is believed to be acting as a structural cofactor, while
formation of a PurQ-glutamine complex is essential for assembly of the FGAR-AT.
Subsequent biophysical studies have indicated that the physiologically relevant form of
the FGAR-AT complex contains 2 PurS, 1 PurQ, and 1 small PurL. Further studies on PurQ have identified residues important for catalysis and complex formation, while insight into the small PurL active site has been obtained by studies on the T. maritima enzyme. The FGAR-AT complex provides a new system in purine biosynthesis to studymetabolite transfer among weakly interacting proteins.
Preface
Portions of the work presented in Chapters 3 and 4 have appeared in the following
publications:1. Hoskins, A.A., Anand, R., Ealick, S.E., and Stubbe, J. "The formylglycinamide
ribonucleotide amidotransferase complex from Bacillus subtilis:
metabolite-mediated complex formation." Biochemistry, 43(32), 10314-27.
2. Anand, R., Hoskins, A.A., Stubbe, J., and Ealick, S.E. "Domain organization of
Salmonella typhimurium formylglycinamide ribonucleotide amidotransferase
revealed by X-ray crystallography." Biochemistry, 43(32), 10328-42.
3. Anand, R., Hoskins, A.A., Bennett, E.M., Sintchak, M.D., Stubbe, J., and Ealick,
S.E. "A model for the Bacillus subtilis formylglycinamide ribonucleotide
Table of Contents
Acknowledgements
4
Abstract 5 Preface 6Table of Contents
7
List of Figures
10
List of Tables
15
List of Schemes
17
Chapter 1. Introduction
Overview 191.1 Organization in the Bacterial Cell 23
1.2 Carbamoyl Phosphate Synthetase: NH3-transfer in a Tight Enzyme Complex 28
1.3 Bacterial Chemotaxis: Phosphoryl Transfer in a Transient Enzyme Complex 32
1.4 Protein:Protein Complexes and Purine Biosynthesis 37 1.5 Channeling of PRA between PurF and PurD 381.6 The B. subtilis FGAR-AT Protein Complex
48
1.7 References 58
Chapter 2. Efforts to Detect a PurF:PurD Complex by Stopped-flow Fluorescence
Spectroscopy
2.1 Introduction
64
2.2 Experimental
70
2.3 Results 82
Chapter 3. Characterization of the B. subtilis FGAR-AT Complex
3.1 Introduction 127 3.2 Experimental 130 3.3 Results 1473.4 Discussion
178
3.5 References 190Chapter 4. Biophysical Studies on PurS and the FGAR-AT Complex
4.1 Introduction 194
4.2 Experimental 201
4.3 Results 213
4.4 Discussion
241
4.5 References 245
Chapter 5. Mutagenesis of PurQ and Studies on FGAR-AT Complex Formation
5.1 Introduction 249
5.2 Experimental 253
5.3 Results 261
5.4 Discussion
285
Chapter 6. Identification of Residues Essential for PurL Catalysis and Relationship of
these Residues to Other PurM-Superfamily Members
6.1 Introduction 298 6.2 Experimental 302 6.3 Results 307
6.4 Discussion
319
6.5 References 335Appendix
Additional NMR experiments for characterization of PurS quaternary structure.
337List of Figures
Figure 1.1 Inside an E. coli cell. 20
Figure 1.2 Obstacles encountered during diffusion in a crowded cell. 21
Figure 1.3 Free diffusion vs. channeling models for metabolite transfer.
27
Figure 1.4 C(hanneling in CPS. 31
Figure 1.5 Protein components of the E. coli chemotaxis system.
34
Figure 1.6 Kinetic evidence for PRA channeling.
42
Figure 1.7 Conformational changes in PurF upon substrate binding.
44
Figure 1.8 The PurF:PurD docking model.
46
Figure 1.9 The proposed PurF:PurD interface and location of mobile loops.
47
Figure 1.10 Alignments of gPurL, smPurL, PurS, and PurQ.
49
Figure 1.11 Glutaminase inhibitors.
51
Figure 1.12 Proposed PurL reaction mechanisms by Westheimer.
52
Figure 1.13 Proposed reactions for PurL and PurM.
54
Figure 1.14 Crystal structure of Salmonella gPurL.
56
Figure 2.1 Structures of open and closed PurF and the PurF:PurD docking model. 67
Figure 2.2 Fluorescence properties of tryptophan analogs.
69
Figure 2.3 Fluorescence emission spectra of PurF and PurD proteins.
84
Figure 2.4 Expression and MS results for labeled PurF and PurD. 86Figure 2.5 12% SDS-PAGE of purified, labeled PurF and PurD proteins.
87
Figure 2.6 7AW incorporation into PurF.
90
Figure 2.7 Km for PRA determination with [4FWI-PurD 92 Figure 2.8 Channeling assays between [7AWI-PurFs and [4FW]-PurD. 93
Figure 2.9 Fluorescence emission of [7AW]-PurF mutants.
95
Figure 2.10 Stopped-flow results for mixing [7AWI-PurFoPRPP with glutamine.
Figure 2.11 Dependence of observed A82W [7AW]-PurF kinetics on glutamine
concentration.
Figure 2.12 Changes in PurD fluorescence due to PPj.
Figure 2.13 Inhibition of [4FW]-PurD by PPj vs. ATP].
Figure 2.14 Inhibition of [4FW]-PurD by PPj vs. [PRA].
Figure 2.15 Inhibition of [4FW]-PurD by PPj vs. [Gly].
Figure 2.16 3-syringe experiments during PRA synthesis.
Figure 2.17 3-syringe experiments during PRA synthesis.
Figure 2.18 2-syringe experiments.
Figure 2.19 Analysis of PurF quaternary structure by SE-AUC.
Figure 2.20 SV-AUC results for PurF.
Figure
Figure
Figure
Figure
Figure
Figure
Figure
Figure
Figure
Figure
3.1 3.2 3.3 3.43.5
3.6 3.7 3.8 3.93.10
15% SDS-PAGE of the co-expressed FGAR-AT.
DEAE elution of the co-expressed FGAR-AT.
S-200 SEC elution of the co-expressed FGAR-AT.SDS-PAGE of the purifed FGAR-AT components.
DEAE elution of PurS.
S-300 SEC elution of PurS. DEAE elution of A128T PurQ. S-200 SEC elution of A128T PurQ.
DEAE elution of smPurL.
Determination of the ratio of PurS:smPurL:PurQ required for maximal
activity.
98 99 101 102 103 104 107 108 112 115 116 148 150 151 153 154 155 157 158 160 163Figure 3.12 pH dependence of the FGAR-AT reaction. 168
Figure 3.13 Analytical SEC results for the individual FGAR-AT component
proteins. 170
Figure 3.14 SEC evidence for the importance of glutamine and ADP in complex
formation. 172
Figure 3.15 Partial complex formation observed with glutamine. 173
Figure 3.16 Partial complex formation observed after DON-inactivation.
174
Figure 3.17 Isolation of a smPurL:nucleotide complex.
177
Figure 3.18 Structure of the Salmonella lgPurL enzyme.
183
Figure 3.19 Domains of the FGAR-AT. 184
Figure 3.20 Possible NH3 tunnels in the FGAR-AT. 185
Figure 3.21 Stereoview of the (Mg2+)3-ADP site. 187
Figure 3.22 Structural model of the B. subtilis smPurL ADP-binding site. 188
Figure 4.1 Structure of B. subtilis PurS and comparison to lgPurL. 195 Figure 4.2 Structures of PurS tetramers observed in various organisms. 197 Figure 4.3 The dimer-dimer interface observed in the B. subtilis PurS tetramer. 198 Figure 4.4 Homology model of the FGAR-AT complex and a 4:2:2 complex. 199 Figure 4.5 Schematic representation of NMR experiments used in the assignment of
PurS. 206
Figure 4.6 SEC results for the B. subtilis FGAR-AT. 214 Figure 4.7 Derivation of the Stokes radius for smPurL and PurS. 217 Figure 4.8 Results from SV-AUC experiments on PurS. 221
Figure 4.9 Results from SV-AUC experiments on the FGAR-AT complex.
222
Figure 4.10 HSQC of amide protons in PurS. 225
Results from H/D exchange experiments on PurS after 5 min. Results from H/D exchange experiments on PurS after 30 min.
Measurement of magnetic relaxation properties of amide protons in
PurS.
Measurment of diffusion properties of PurS by DOSY. Western blot analysis of PurS in B. subtilis cell extracts. Western blot analysis of PurQ in B. subtilis cell extracts. Western blot analysis of smPurL in B. subtilis cell extracts.
Figure
Figure
Figure
Figure
Figure
Figure
Figure
Figure
Figure
Figure
Figure
Figure
5.1 5.25.3
5.4
5.5
5.6 5.7 5.8 5.9 5.10 5.115.12
Figure 5.13
Figure 5.14
Figure 5.15
AT reactions catalyzed by HisHF, PabAB, and TrpEG.
Structure of the glutamylthioester present in the gPurL crystal structure. 15% SDS-PAGE of the purified A128T double mutant PurQs.
Determination of the Km for glutamine for the Q9OA PurQ mutant. Competition assays with the D55N PurQ mutant at 20 and 200 mM
glutamine.
Competition assays with the D55A, Q9OA, and Q9OE PurQ mutants. Competition assays with C86A and C86S PurQ mutants.
Competition assays with the H194Q, E196A, and E196D PurQ mutants.
CD spectra of A128T and double mutant PurQs.
Quantitation of aggregate present in PurQ mutants by SV-AUC.
Efforts to prevent aggregate formation by inclusion of glutamine.Analytical SEC analysis of the amount of aggregate present in PurQ
mutants.
Induction of histag-PurQ in B. subtilis.
Results from the affinity purification experiments using histag PurQs. Analysis of the ratio of PurS:PurQ:smPurL obtained in the affinity
Figure
Figure
Figure
Figure
Figure
Figure
Figure
4.12
4.13
4.14
4.15
4.16
4.17
4.18
229 230 232234
236 237 238 250 252 262 265 267 268 270 272274
275 276 278 280 282Figure 5.16 Possible role for the conserved triad glutaminase residue E1262 in linking the
glutaminase and AT domains. 290
Figure 5.17 Interdomain contacts implicated by Davisson and coworkers for linking the
AT and glutaminase domains. 291
Figure 6.1 Members of the PurM-superfamily of enzymes.
299
Figure 6.2 C('omparison
of the crystal structures of smPurL, lgPurL, PurM, and ThiL. 300
Figure 6.3 Stereoview of FGAR and AMP-PCP bound to the active site of T. maritima
smPurL. 308
Figure 6.4 Close-up of conserved FGAR-binding residues from the ternary complex
crystal structure. 309
Figure 6.5 Km determination for NH4CI for wt T. maritima smPurL. 312
Figure 6.6 Comparison of Michaelis-Menten plots for FGAR for wt and H72A
smPurL. 313
Figure 6.7 CD spectra for the T. maritima wt, H32A, and H72A smPurLs. 316
Figure 6.8 Results from SV-AUC experiments on wt, H32A, and H72A smPurLs. 317
Figure 6.9 Backbone overlay of the crystal structures of wt and H72A smPurL. 318
Figure 6.10 Examples of carbonyl reactivity towards phosphorous compounds.
320
Figure 6.11 Proposed reaction mechanisms for PurL by Westheimer.
322
Figure 6.12 Dissociative and associative models for phosphoryl transfer from ATP to an
alcohol. 326
Figure 6.13 Structure-based sequence alignments of PurM and smPurL.
328
Figure 6.14 Identification of conserved histidines in PurM.
329
Figure 6.15 Sequence alignments of HypE, PurM, ThiL, SelD, and smPurL.
331
Figure 6.16 Comparison of HypE and SelD model structures to smPurL, PurM, and
List of Tables
Table
Table
Table
Table
Table
Table
Table
Table
Table
1.1 Amidotransferases in primary metabolism.
1.2 Techniques previously used in efforts to detect a PurF:PurD complex.
28 43
2.1 Stopped-flow experiments. 78
2.2 Activities of the Trp and 7AW-labeled PurF mutants.
88
2.3 Activities of the glutaminase-inactivated 7AW PurF mutants.
88
2.4 Kinetic parameters for wt and 4FW-labeled PurDs.
88
2.5 ESI-MS results for the purified enzymes. 892.6 Calculated fits for 7AW PurFoPRPP vs. Gin stopped flow experiments.
100
2.7 Calculated first for 3 syringe stopped flow experiments of 7AW PurFoPRPP vs.
Gin vs. 4FW PurD or Buffer. 109
Table 3.1 Primers used in cloning of the FGAR-AT.
Table 3.2 Co)-purification of the FGAR-AT complex (A128T PurQ).
Table 3.3 Co-purification of the FGAR-AT complex (wt PurQ). Table 3.4 Purification of A 128T PurQ.Table 3.5 Purification of smPurL.
Table 3.6 Selected kinetic parameters of FGAR-AT enzymes.
Table 3.7 Quantitation of [
14C]-ADP Binding to smPurL.
133 149 149 156 161 164 176 215 219 220 Table 4.1 Determination of MW by SEC.
Table 4.2 Determination of MW by SV-AUC.
Table 4.5 Quantitative Western results for the FGAR-AT proteins.
Table 4.6 Molecules per cell of the FGAR-AT proteins.
Primers used in PurQ mutagenesis.
ESI-MS results for PurQ mutants.
Kinetic parameters for the PurQ mutants determined during FGAM
synthesis.
Quantitation of aggregated species present in mutant PurQs by SV-AUC
SEC.
Normalized amounts of his-PurQ isolated after affinity purification.
Normalized amounts of PurS isolated after affinity purification.
Normalized amounts of smPurL isolated after affinity purification.
6.1 Kinetic parameters for the T. maritima
smPurL.
6.2 Conserved histidine residues among PurM-superfamily members.
Table
Table
Table
5.15.2
5.3
Table 5.4
5.5
5.6
5.7
239 240 237244
247 and 260 266 266 266 311 330Table
Table
Table
Table
Table
List of Schemes
Scheme 1.1 de novo Purine Biosynthesis. 25
Scheme 1.2 A model for GAR formation using a coupled assay with PurF and PurD. 40
Scheme 2.1 Reactions catalyzed by PurF and PurD. 65
Scheme 2.2 Hypothetical PurF reaction pathway. 110
Chapter 1:
Introduction
It has been estimated that the 1 million polypeptide chains in E. coli cytoplasm along with nucleic acids occupy 30% of the cell's total available volume, with macromolecule concentrations of 300-400 mg/mL (1, 2). This leaves only 70% available for water, salts, mnetabolites, and other small molecules. A cell is an amazingly close-packed system with a
solvent content similar to that observed in many protein crystals (Figure 1.1). This highly
crowded environment is very different from conditions under which enzyme activities are
normally determined. A typical enzyme assay consists of monitoring the activity of a single, hc)mogenous enzyme at a concentration of 1-1,000 nM in a buffer containing a few salts and only the small molecules of interest. It is surprising that only recently has the impact of the cellular environment begun to be systematically studied with regard to enzyme function.In particular, a crowded cellular environment is believed to present a barrier to molecular diffusion which can consequently impact enzymatic activity (3). In an excellent analogy,
Verkman has compared the 3 barriers to cellular diffusion (fluid-phase viscosity, non-specific
binding, and crowding) to driving an automobile (Figure 1.2) (3). Cellular diffusion is much like an early-morning commute. The time it takes to reach your destination depends on the speedlimit (fluid-phase viscosity), the number of stoplights (non-specific binding), and rush hour
traffic (molecular crowding).
Recent advances in fluorescence microscopy have allowed these barriers to be quantified in vivo.
Using a combination of spot photobleaching and time-resolved fluorescence anisotropy,
small molecule diffusion in the cytosol has been studied with 2',7'-bis-(2-carboxyethyl)-5-(and-6)--carboxyfluorescein (BCEF). The diffusion of the fluorophore was found to occur at a rate of2x10-6
Figure 1.1- An artist's scientific representation of the crowded interior of an E. coli cell. Illustration courtesy of David Goodsell, Scripps Research Insitute.
Viscosity
Binding
Crowding
relative contributions of visocity, non-specific binding, and crowding to this diffusion rate were
then evaluated. Surprisingly, despite the high concentration of macromolecules, the viscosity of
the cytoplasm was determined to be only slightly greater than that of water (4.5 cPoise), andnon-specific binding provided only a minor barrier to diffusion for BCECF (4). The greatest
barrier to the probe's cytoplasmic diffusion was determined to be collisions withmacromolecules due to crowding.
Diffusion of large molecules has also been studied using either fluorescently-labeled
clextrans, green fluorescent protein (GFP), GFP-derivatized metabolic enzymes, or
fluorescently-labeled DNA fragments. In all cases, the rates of diffusion were determined to be much lower in cytoplasm than in water (Dcyto/Dwater < 0.25) (3). Dextrans larger than 2000 kDa and DNAfragments larger than 250 bp had severely impaired rates of diffusion (3). Most relevant to studies on enzyme activities and metabolism were the diffusion rates of GFP and labeled glycolytic enzymes. When GFP was expressed in CHO cells, it possessed similar diffusion properties compared to BCECF (8.7x10⁻⁷cm2
/s) (5). However, very different results were obtained for TCA cycle enzymes being expressed in either CHO or COS7 cells as GFP chimeras.
In this case, malate dehydrogenase, isocitrate dehydrogenase, citrate synthase, and succinyl-CoA
synthetase were all found to diffuse nearly 20-fold slower than GFP alone (4x10 -8 cm2/s) (6).These results indicate that the cellular environment can restrict both small molecule and
macromolecule mobility.
The effects of crowding on enzyme activity are complicated (7, 8). Based on the results
mentioned above, crowding would be expected to lower enzyme activities due to diffusion
barriers encountered in forming an enzymeesubstrate complex. However, the excluded volume
in a crowded environment due to the space occupied by other macromolecules can increaseeffective concentration, leading to an activating effect. Therefore, the impact of crowding on
activity is highly enzyme specific and depends on the contributions of both of these factors. For example, crowding has been shown to increase the activity of rabbit muscle pyruvate kinase (9), inhibit adenosine deaminase (10), and have no net effect on Eco RV endonuclease kinetics due to compensating changes in non-specific binding, Vmax, and Km for the DNA substrate (11).The diffusion rates mentioned above for BCECF give rise to very fast linear velocities
compared to the size of an average bacterial cell (0.125 m/ts versus an average E. coli cell size of 2.95 ym x 0.64 jim) (1, 4). Given an intracellular protein concentration of 1 /M, thecliffusional transit time for a small molecule between proteins would only be -1 ms (12). However, if one takes into account the rate of productive encounters in an enzyme active site (which would be dependent on the correct orientation of the active site relative to the small
molecule among other factors), the transit time could increase to 0.1-1 s (12). Given this
observation and the impact of crowding on both small molecule and macromolecular diffusion, it is a reasonable question to ask if cells have evolved mechanisms to overcome this barrier.
Recent advances in prokaryotic biology have indicated that Nature has taken a very sophisticated
approach to cytosolic organization in bacteria.
1.1 Organization in the Bacterial Cell
It is now clear that bacterial physiology contains many of the complex features
previously associated with eukaryotes. In the early 1990s it was discovered that the membrane chemoreceptors and cytoplasmic chemotaxis proteins in E. coli could localize specifically at the cell pole (13). Since then, the picture of a bacterium has changed from a "bag of enzymes" to one of an exquisitely organized set of machines. This is exemplified in studies on asymmetric cell division in Caulobacter crescentus and sporulation in Bacillus subtilis. In both cases,
protein activities are regulated by transcriptional-timing to produce enzymes only during specific stages of the cell cycle and by localization of enzymes to specific locations within the cell (14). Furthermore, it has now been shown in Caulobacter that the chromosome position in the cell is tightly controlled and specific genetic loci are found at defined chromosome locations with respect to the cell axis (15). This positioning is maintained by careful remodeling and
segregation of the chromosome during cell division by transport proteins and linkage to a
cytoskeleton formed by the actin homologue MreB (16). Evidence for a cytoskeleton has also been found in E. coli where the MreB protein filaments are essential for maintaining cell shape(17, 18) and the dynamic MinCDE filamentous complex is responsible for localization of the
division septum at the cell midpoint (19).
The examples mentioned above for organization of the bacterial cell are limited to
processes involving either cell division or morphology. Cellular organization of primary
metabolic enzymes is less well-understood; however, formation of protein:protein complexes
could be used to circumvent many of the diffusion problems encountered in a crowded cellularenvironment. This may be particularly important in the metabolism of unstable or reactive
molecules.
Cellular metabolism proceeds in aqueous solutions at pH -7 at 37°C despite the chemical
instability of many metabolites under these conditions in vitro. For example, de novo purine
biosynthesis in bacteria (Scheme 1.1) generates two different unstable intermediates.
=O
3POPP
HO OH PRPP PurF L-Gn L-Glu PP, 0 NH2O03POH
HO OH PRA PurD ATP ADP Gly P, H R- Nf- NH3* GAR GAR N10-formyl THF THF PurN H_ . 11. R Nn-N- sH O H FGAR(R = ribose-5'-phosphate) (R =ribse--phsphte) formate P,formAT ATP ADPADPP
HH NH'H FGAM
-00 .S
H½ N , SAICAR SAICAR PurM ATP ADP P, PurB fumarate~ON
Pu rkX-° HICH R HC~ DP N5-CAIRg
/ATPADP%H2N0 HCO - P Class II PurE
R -0 H AIR C '+ N10-formyl THF THF H I PurH Rt R R .~*~ .. _ ^ .
AIUAH ATP ADP I-AIUAH
formate P, lass I PurE 0
-o
H21~ -N R CAIR H20 Pu rj H P PurO N "'<v R H20 IMPScheme 1.1-de novo Purine Biosynthesis
ADP ATP PI L-GIn L-Glu / Pur L ,PurSQL ATP ADP L-Gln P, L-Glu PurC ATP ADP L-Asp P,
have estimated half-lives in vivo on the order of seconds and rapidly decompose either by hydrolysis (PRA) or decarboxylation (N5-CAIR) (20). In addition,
phosphoribosylpyrophosphate (PRPP), the precursor to PRA and a common metabolite in many
biosynthetic pathways, rapidly decomposes in the presence of Mg
2+to a combination of
ribose-5'-phosphate, PPj, and 5'-phosphoribosyl-1',2' cyclic phosphate (21, 22). Many other metabolic
pathways contain unstable or reactive metabolites including carbamate and carbamoyl phosphate
in pyrimidine metabolism (23, 24), -aspartyl phosphate in the aspartate pathway (25), andglutamate 1-semialdehyde in 5-aminolevulinic acid synthesis (26, 27).
One method that cells could use to avoid metabolite decomposition would be to directly transfer these unstable metabolites between enzyme active sites. This process is called metabolic
channeling and is broadly defined as transfer of common metabolites between enzymes without
equilibration with the bulk solution (Figure 1.3) (28). There are several advantages to
channeling including decreasing the metabolite transit time between enzymes, avoiding
unfavorable equilibria, segregation of common metabolites from competing pathways, and
protection of chemically labile or toxic intermediates (28). Channeling sidesteps all of the
barriers to cellular diffusion present in the cytosol to provide an elegant solution for metabolism
in a crowded environment.Key to the understanding of the channeling phenomenon is an analysis of the
protein:protein complex that is proposed to be involved in metabolite transfer. In the following
sections, small-molecule transfer via protein:protein complex formation will be described in two
well-studied model systems: carbamoyl phosphate synthetase (CPS) and the bacterialsubstrate
~.
E1
Free Diffusion
I- ...~~P 1
....
.
...
.
.
•
decomposition
Channeling
E2
substrate
~.
.,
~[ED
E1
~
E2
I-~~P2
Figure 1.3-Free diffusion versus channeling for transfer of common metabolite PI between
enzymes El and E2. If metabolite PI is unstable or reactive, channeling avoids metabolite decomposition that may be encountered during diffusion into the cytosol.
tight protein:protein complex, while bacterial chemotaxis relies on transient protein interactions
to catalyze phosphoryl transfer.
1.2 Carbamoyl Phosphate Synthetase: NH
3-transfer in a Tight Enzyme Complex
Amidotransferases (ATs) are enzymes that catalyze hydrolysis of glutamine and
incorporation of the liberated NH
3into another metabolite. These enzymes are ubiquitous in
metabolism and can be classified according to their glutaminase active sites (Table 1.1). The
largest families are the NTN and triad classes of ATs (29). The NTN class contains a N-terminal
cysteine involved in glutamylthioester formation and liberation of NH
3.
Table 1.1: Amidotransferases in Primary Metabolism
Glutaminase
Enzyme Class
Class
Anthranilate Synthase
Triad
Asparagine Synthetase
NTN
Carbamoyl Phosphate Synthetase
Triad
(CPS)Cobyrinic Acid a,c-Diamide Synthetase
Triad
CTP Synthetase
Triad
Formylglycinamide Ribonucleotide
Amidotransferase
Triad
(FGAR-AT, PurL)
Glu-tRNAGIn Amidotransferase Amidase or
(GatABC or GatDE)
Asparaginase
Glucosamine-6-Phosphate Synthase
NTN
Glutamate Synthase
NTN
GMP Synthetase
Triad
Imidazole Glycerol Phosphate Synthase
Triad
(HisHF)
NAD Synthetase (Eukaryotic)
Nitrilase
p-Aminobenzoate Synthase (PabAB)
Triad
Phosphoribosylpyrophosphate
Amidotransferase
NTN
The triad class also contains a catalytic cysteine residue; however, this residue may be located anywhere within the peptide chain and is always followed by a conserved pair of histidine and glutamate residues with a typical consensus sequence of Cx8 0 o0 0HPE (29). The crystal structures
of many AT enzymes have been solved, and every structure contains spatially separated
glutaminase and AT active sites (30). This observation has led to a general model in which AT enzymes channel NH3 between two active sites (30). In the case of the NTN class,
intramolecular channeling has been proposed since the glutaminase and AT active sites are always present on the same polypeptide chain. Channel formation and architecture has been well studied in PurF (Scheme 1.1), the prototype for the NTN class, but no general paradigms have
emerged for AT enzymes as a whole (31-33).
Triad glutaminases may be located either on the same peptide chain as the AT or on a separate protein. Intramolecular channeling has been proposed in this AT family in the former case and intermolecular channeling in the latter. CPS is the best-studied triad AT and is an
example of an enzyme that exhibits intermolecular channeling between two tightly interacting
subunits. These subunits can only be separated by denaturation or by the presence of extremely high salt concentrations, and full activity cannot be regained by reconstituting the separatedsubunits (34-36). CPS catalyzes formation of carbamoyl phosphate from bicarbonate, glutamine,
and 2 equivalents of ATP. The enzyme is found as a heterodimer composed of 40 kDa and 120
kDa proteins. The former catalyzes glutamine hydrolysis (1), while the latter catalyzes
formation of carbamate (2) and carbamoyl phosphate (3). The overall reaction (4) is thus
composed of 3 reactions as shown below.Gin
+ H20 -Glu
+ NH3 (1)NH
3+ATP + HC(O0
3-carbamate + ADP + Pi
(2)
carbamate + ATP
-carbamoyl phosphate + ADP
(3)
Gin + 2ATP
+HC0
3 + H20carbamoyl phosphate + 2ADP + Pi + Glu
(4)
Crystallographic analysis of the CPS complex revealed that the light and heavy subunits have an extensive protein interface (Figure 1.4, -2150
A
2buried/subunit) (37). This interface isformed by 35 inter-protein hydrogen bonds and 36 interactions mediated by water molecules
(38). The AT and glutaminase activities are coupled across this interface. Detailed kinetic
analysis of CPS by the Raushel laboratory has determined that in the presence of ATP and HCO3-, glutamine hydrolysis is accelerated from 4 to 1100 min- in order to synchronize NH3and
activated-bicarbonate formation for carbamate synthesis (39).
The crystal structure of CPS also revealed that three reactions carried out by the enzyme occur in distinct, spatially-separated active sites (Figure 1.4). These active sites are connected by a 96 A-long tunnel that winds through the enzyme (37). In the tunnel between the glutaminase and carbamate synthetase sites, NH3 is proposed to channel over a distance of -45 A. This
tunnel is largely hydrophilic in character and has an average minimum radius of 3.2 A, approximately the same size as NH3. A larger tunnel (average minimum radius of 3.5 A)
connects the synthetase and carbamate kinase active sites. This tunnel is hydrophobic and is believed to convey carbamate between active sites within the heavy subunit. Channeling of these metabolites avoids both protonation of NH3 and carbamate decomposition (half-life at
Carbamate
Kinase
Glutaminase
Carbamate
Synthetase
Figure 1.4-Inter- and intramolecular channeling in carbamoylphosphate synthetase (CPS). The overall reaction for CPS is shown above. The crystal structure of the enzyme revealed four domains: a triad glutaminase occupies the light subunit (red) and the carbamate synthetase
(blue), carbamate kinase (teal), and regulatory (green) domains occupy the heavy subunit
Inter-and intramolecular tunnels for NH3 and carbamate (outlined by the green dots) connect the three
CPS is also the only AT enzyme for which NH3-channeling has been demonstrated by
chemical methods. The evidence for channeling used 1 5
N-NMR to monitor product formation in the presence of 25 mM [14N]-glutamine and 100 mM 5NH4Cl (40). If the 14NH 3 released from
glutamylthioester formation does not channel, it should be able to equilibrate with the '5 NH4+ present in the buffer. Subsequent diffusion of ammonia (or ammonium) back into the carbamate synthetase active site would result in 80% (100 mM 15NH
4 - 125 mM total NH4) of the product being 15
N-labeled. In order to avoid carbamoyl phosphate decomposition during acquisition, the reaction was coupled with ornithine carbamoyltransferase and integration of the citrulline
product NMR signal showed that < 5% contained '5N, providing evidence that 14NH
3 is being
channeled across the protein:protein interface between the glutaminase and AT active sites of CPS.
1.3 Bacterial Chemotaxis: Phosphoryl Transfer in a Transient Enzyme Complex
Given the crowded cellular environment, one might expect that all protein complexes are
pre-organized into very tight interactions as in the case of CPS. However, there are manyexamples of enzymes that interact weakly, or transiently, with one another. For example, weak
interactions are essential for electron transfer proteins involved in photosynthesis and oxidative
phosphorylation in order to maintain a continuous flow of electrons (41). Interactions between
cytochrome c and cytochrome c peroxidase as well as between photosystem I and cytochrome c6 or plastocyanin have been kinetically characterized by laser flash absorption spectroscopy. The interactions exhibit very fast on and off rates (kon 107-109 M- s-'
and koff>
103 s-')
but theinteraction is sufficiently long-lived to permit electron transfer (41). Transient interactions are
not limited to electron transfer processes. Thioredoxin interacts weakly with ribonucleotide
reductase (RNR), despite a requirement for covalent disulfide reduction of RNR after every
turnover (42). One of the best characterized examples of weak protein interactions involved in
small molecule transfer is the phospho-relay signaling pathway required for bacterial
chemotaxis.
Chemotaxis can be described as the biasing of random movement of the cell towards a
higher concentration of a nutrient source (or away from a toxic chemical) (43). The movement
bias is achieved by altering the frequency at which the flagellar motors spin counterclockwise(which results in bundling of the flagella to produce forward motion) versus clockwise motion
(which disrupts the flagellar bundle and induces random tumbling) (43). Bacteria are too small to sense a concentration gradient along their body length; so, the chemotactic response isregulated by temporal stimulation of pole-localized transmembrane chemoreceptors. Higher
nutrient concentrations result in increased frequency of receptor:metabolite interaction at the cell
pole (43).
The best-characterized chemotactic signaling pathway is found in the Che system of E. coli (Figure 1.5). While the details of the pathway are too complicated to address here, the basis for chemotaxis in E. coli begins with interactions between the soluble CheA protein and a
trans-membrane methyl-accepting chemotaxis protein (MCP). The MCP acts as a bridge linking the
cytosol to nutrient conditions in the periplasm. A decrease in the number of interactions betweenthe MCP and a nutrient binding protein (such as maltose-binding protein) in the periplasm results
in a conformational change that is propogated into the cytosol and induces CheAautophosphorylation at His48. This phosphate is transferred via protein:protein complex
formation to Asp57 of CheY (Figure 1.5). Phosphorylated CheY can then interact with the flagellar motor and induce clockwise rotation and cell tumbling. CheY can subsequently bedephosphorylated by interaction with CheZ.
•
8
•
• •
• •
••••
• •
k1P-CheA
+
Che Y
-~he~lkheA
k,CheA:CheY
k
2 _k3
P-CheA:CheY::::;::::-==-=::CheA:CheY-P
-
- CheA
+
CheY-P
K2 K3
Figure 1.5-(Top) Protein components of the E.
coli
chemotaxis system. A transmembraneprotein receptor (grey, also known as a methyl-accepting chemotaxis protein or MCP) senses a
chemoattractant. Phosphoryl transfer from His48 of CheA to AspS7 of Che Y by protein
complex formation triggers accumulation of phospho-Che Y, which can then interact with the flagellar motor (green) to initiate clockwise rotation. Phospho-Che Y can then be
dephosphorylated by CheZ. Other proteins involved in chemotactic signaling (CheB, CheW, and CheR) have been omitted for clarity. (Bottom) The kinetic scheme describing phosphoryl
The chemotactic response is remarkable for both its speed and sensitivity. For example, a
chemotactic response is observed in a methylaspartate gradient of 160- 163 PM despite only a
minimal change in calculated receptor occupancy under these conditions (44). These
chemotactic responses also occur very rapidly, within -100 ms of receptor stimulation (43). The
current model for sensitivity and speed in bacterial chemotaxis relies on signal amplificationfrom the receptor based on kinetic control of phosphoryl transfer between the cytosolic proteins.
An essential component of this model is the transient interaction between phospho-CheA
(Pi-CheA) and CheY that has been characterized in vitro (Figure 1.5).Rapid-chemical quench methods have been used to analyze phosphoryl transfer kinetics
from
3 2Pi-CheA to CheY (45). Under these conditions, phosphoryl transfer was monitored by
SDS-PAGE and phosphorimaging to detecte the phosphorylated proteins after quenching of the
reaction with 0.1M EDTA/10% SDS. These experiments were complicated bydephosphorylation of the proteins during analysis; however, data could be accurately modeled
after determining half-lives for the phosphoaspartate and phosphohistidine linkages of 115 + 20
min and 1000 + 100 min, respectively, under the analysis conditions (45). An alternative
strategy was used to indirectly detect phosphoryl transfer: changes in CheY tryptophanfluorescence was monitored by stopped-flow spectroscopy and similar results were obtained (46,
47). The kinetics are remarkable for several reasons. First, saturation kinetics could be observed
for the proteins with a Km value of 6.5 + 2 M between Pi-CheA and CheY at 25°C (45). This affinity indicates that the proteins interact relatively weakly in solution, even during phosphoryltransfer. Second, under saturating conditions, the phosphoryl transfer was completed within the
dead time of the quench apparatus (2.5 mns)
(45). Therefore, rate constants for the phosphoryl
temperature-dependence studies. The value for the apparent first-order rate of phosphoryl transfer is
remarkably fast, 650 + 200 s-' at 25°C (45). Given cellular CheA and CheY concentrations of 1-5 yM and 10-20 yM, respectively, these values have been used to extrapolate an in vivo
complex half-life of 2 ms (45).
Using advanced computer simulations, Stewart and coworkers have predicted that these
rapid kinetics are essential for the bacterial chemotactic response (47). A loss of one order of magnitude in the rate of phosphoryl transfer (a decrease from -700s -' to -70 s-') was predicted toresult in an observable change in chemotaxis based on alteration of the frequency at which the flagella are expected to rotate in a clockwise direction. These predictions have been confirmed with the use of a CheA mutant enzyme that phosphorylates CheY at a 25-fold slower rate in vitro
(47). When the mutant CheA was expressed in ACheA E. coli, cell motility was decreased by '5% in a chemotaxis assay compared to the wild-type strain (48). Visual observation of flagellar
rotation confirmed that about 66% of the mutant bacteria flagella were being rotated in
exclusively a counterclockwise direction (the direction not stimulated by phosphate transfer from
CheA to CheY) whereas no counterclockwise movement was observed in the wild-type strain(48).
Given the transient nature of the Pi-CheA:CheY complex, obtaining evidence for the interaction was challenging but successful using a number a methods. These experiments were aided by the fact that CheY can interact with CheA independent of the presence of phosphate (Kd
^ 1-1.7 yM for CheA, while the Km for Pi-CheA is 6.5 pM) (45). Using a
fluorescently-derivitized CheY., steady-state and stopped-flow fluorescence spectroscopy have demonstrated
CheA and CheY binding interactions (49). Thermodynamic information about interactions
between CheA and CheY has been obtained using isothermal titration calorimetry (ITC), and ahexahistidine affinity tag on CheA was successful in enabling purification of a CheA:CheY
complex (50). Finally, several crystal structures are available for CheA:CheY protein complexes
(51-53). In these structures, only the CheY-binding domain of CheA (which has the sameaffinity for CheY as the full length protein but does not contain the phospho-histidine site) was crystallized with CheY. The hydrophobic interface buried only 600
A
2from each protein.Comparison of the multiple crystal structures suggests that the interface is flexible, consistent
with transient complex formation. These results indicate that the bacterial chemotaxis system is
a paradigm for studies on transiently interacting proteins involved in small molecule transfer.1.4 Protein:Protein Complexes and Purine Biosynthesis
The protein interactions illustrated by CPS and CheA:CheY have been used as models for thinking about the role protein complexes play in de novo purine biosynthesis (Scheme 1.1). In
particular, the importance of protein complexes in channeling unstable metabolites has been of
long-standing interest in the Stubbe Laboratory, and purine biosynthesis has been used as aparadigm for understanding metabolism of unstable intermediates such as phosphoribosylamine
(PRA, t,2in vivo,-5 s)
and N5-carboxyaminoimidaxole
ribonucleotide(N
5-CAIR,
t 2 in vivo15 s ). The channeling of PRA between E. coli phosphoribosylpyrophosphate amidotransferase
(PurF) and glycinamide ribonucleotide synthetase (PurD), the first two enzymes in the pathway (Scheme 1.1), has been investigated for a number of years. Like the CheA:CheYphosphotransfer complex, this channeling interaction is expected to be transient in nature. In Chapter 2 of this thesis, efforts are reported to detect complex formation between PurF and PurD
by stopped-flow fluorescence spectroscopy.
The presence of two ATs in the pathway (PurF and PurL/PurSQL) affords additional opportunities to study protein complexes involved in channeling. Like all ATs, these enzymes
are proposed to channel NH3 between glutaminase and AT active sites. The remainder of the
thesis will describe efforts to characterize the B. subtilis formylglycinamide ribonucleotide
amidotransferase (FGAR-AT). This enzyme is a member of the triad family AT enzymes and is composed of a protein complex of PurS, PurQ, and smPurL. Initially, the complex waspresumed to be tight as in the cases of CPS and other AT enzymes. However, the data now indicate that tight complex formation is mediated by the presence of metabolites and weak protein interactions may be critical for transient NH3-channel formation between two active sites.
1.5 Channeling of PRA between
PurF and PurD
PurF catalyzes the incorporation of NH
3released from glutamine hydrolysis into PRPP
(Scheme 1.1). While PRA was assumed to be the product of PurF for many decades, the extreme lability of the molecule hampered its characterization. The first experimental evidence for PRA synthesis by PurF came from 13C NMR studies (54). Using 40 ptmol of 1-1 3Cl- PRPP, an
cc/3
mixture of PRA was formed in the presence of 200 U of PurF and glutamine after 4 min andrapidly decomposed to ribose-5'-phosphate after 10 min. Subsequent saturation- and
inversion-transfer NMR experiments allowed determination of the rate constants for PRA anomerization
which result in rapid formation of a 60:40 mixture of f3:cL anomers. The rate of PRAdecomposition was studied by using an excess of PurD (glycinamide ribonucleotide synthetase, Scheme 1.1) to convert available PRA to GAR (glycinamide ribonucleotide), a stable compound that can be readily isolated (54). The kdecomp was found to be 7.0 x 10⁻⁴ s at pH 8.0 and 18°C.
Temperature- and pH-dependence studies on the decomposition rate allowed extrapolation to physiological conditions. These results indicated that PRA half-life in vivo (pH 7.5, 37°C) is
Given this short half-life, it was postulated that PRA could undergo significant
decomposition in vivo if it were allowed to freely diffuse between PurF and PurD. A model was
proposed in which the PurFoPRA complex interacts transiently with PurD in order to channel
PRA and avoid metabolite decomposition. Work by Johannes Rudolph in the Stubbe Laboratory
provided steady state kinetic analysis of evidence for channeling of PRA (55). As an initial step in Rudolph's experiments, a free diffusion model (Scheme 1.2) was generated to describe the rate of GAR formation from PRPP by PurF and PurD in a standard coupled assay involving twoenzymes and assuming no channeling of PRA.
While the steady state parameters for PRA formation (VI, PurF activity) and
decomposition
(kdecomp) wereeasily determined, the parameters for PurD were more difficult to
obtain. In order tlo assay PurD activity, PRA is typically synthesized as an cx/3 mixture inequilibrium with ribose-5'-phosphate in 1 M NH4OH. This limits the amount of PRA that can be
added to an assay solution without altering pH. Analysis of initial velocity data revealed that
PurD exhibits substrate inhibition with PRA (K = 670 yM), which further complicates
determination of the Km for PRA and V2 (Vmax for PurD); however, these data could be modeled
by fits to standard equations for substrate inhibition. By using parameters obtained for the
enzymes and PRA decomposition, a kinetic model for the rate of GAR formation wasconstructed based upon a standard coupled assay. This model revealed that if a small amount of
PurD is added to the assay (which results in a low V2), the rate of GAR formation will not becoupled to the rate of PRA synthesis by PurF. This would result in an observable lag phase in the rate of GAR synthesis (Figure 1.6).
PRPP
PRA
Km,
GAR
kdecomp
R5P
Scheme 1.2-A kinetic scheme for modeling GAR formation from PRPP in a standard coupled
assay with PurF and PurD. PRA synthesis is dependent on the PurF reaction velocity (V); while GAR formation is dependent on both the PRA concentration (Km) and PurD reaction velocity (V2). In addition, a significant portion of PRA will be decomposing to riboseWhen experiments were carried out using small amounts of PurD, the rate of GAR
formation observed by Rudolph was inconsistent with the free diffusion model (55). No lagphase was observed, and the amount of GAR produced significantly exceeded predictions made
from the model (Figure 1.6). Error analysis of the parameters in the free diffusion model (V,, V2,
and Km(PRA)) indicated that their simultaneous variation by 20% could not account for the
observed kinetics. In addition, this behavior was found to be dependent on both the ratio of PurF
to PurD and the total protein concentration, properties expected for involvement of a
protein:protein interaction (56). Together the data were interpreted to indicate that PRA is being
channeled between PurF and PurD through their transient interactions.
Previous studies to look for interaction between PurF and PurD involved size-exclusion
chromatography (SEC) and co-immunoprecipitation (co-IP), both of which require tightinteractions. No evidence for an interaction could be found with either of these techniques.
H-owever, methods that should report on weaker interactions such as protein-affinity
chromatography, cross-linking in crude extracts and with purified proteins, and steady-state
fluorescence were also unsuccessful. The cross-linking and steady-state fluorescence data were particularly striking since these experiments were carried out in the presence of PRA. Thusdespite the use of different methods to detect interactions on different time-scales (Table 1.2), no
evidence for a PurF:PurD interaction was found. This provided further evidence that the
enzymes are interacting transiently in solution and that the techniques listed in Table 1.2 did not
have sufficient temporal resolution to detect complex formation.
The requirement for a specific PurFoPRA protein complex as the docking partner for
PurD in the channeling model also requires that PurF undergoes conformational changes during
80
70
60
a:
50
O
40
2
::L30
20
10
0
1
2
3
4
5
6
7
8
t (min)
V, = 20
pM/min
V
2= 24 gM/min
KmpA
=
98 EM
Figure 1.6-Kinetic evidence for PRA channeling obtained by Rudolph and Stubbe. The observed rate of GAR formation (solid line) is linear and exceeds that predicted from diffusion-modeled kinetics for a standard coupled assay (dashed line).
Table 1.2: Techniques Previously Used in Efforts to Detect a PurF:PurD Complex
Technique
Ligands Utilized
Time-Scale Temperature
Gel Filtration Chromatography None Hours 4°C
. .
.
1.7 mM PRA, 20 mM Gn,.
Co-Immunoprecipitation 1.7 mM PRA, 20 mM Gin, 15 min 0C 3 mM ATP
Protein Affinity Chromatography
None
-20 h
4°C
Steady-State Fluorescence
2 mM PRPP, 0.1-2 mMPRA,
Minutes
25°C
10 mM Gln, 1 mM ATPCross-linking of Purified 2 mM PRPP, 0.1-2 mM PRA, 0.52 h 250C Proteins 10 mM Gln, 1 mM ATP
. .
.
2~mM
PRPP, 0.1-2 mM PRA,a
Cross-linking in Cell Lysates 2 mM PRPP, 0.1-2 mM PRA, 0.5-2 ha 250C 10 mM Gln, 1 mM ATP
aThis represents the amount of time that the proteins were exposed to the cross-linking reagents
and not the rates of the chemical steps for cross-linking. Since the cross-linking wasirreversible, it was expected that a cross-linked product would accumulate in solution over time.
catalysis. Structure determination of the E. coli PurF by X-ray crystallography has provided
evidence for conformational flexibility (Figure 1.7). Structures of the apo form and "closed"
form in the presence of 6-diazo-5-oxonorleucine (DON, a glutamine analog that alkylates thecatalytic cysteine present in glutaminase domains) and a carbocyclic analog of PRPP (cPRPP,
which also contained Mn2 + as a metal ligand) indicated that movements occur in the glutamine-binding loop (blue), PRTase flexible loop (yellow), and the C-terminal helix (green) (Figure 1.7) (31, 57). This structural reorganization is believed to be necessary to create an NH3-channelbetween the glutaminase and the AT active sites. Additional evidence for conformational flexibility of these loops has been obtained by studying fluorescence changes in PurF upon substrate binding in both the pre-steady and steady state (32). These loop movements are
discussed in greater detail in Chapter 2. The structure of a PurFproduct complex remains
unknown.
DON
Open
Closed
Figure 1.7-X-ray crystallographic studies have shown that upon binding of PRPP and
glutamine analogs, PurF goes from an open (lecb.pdb) to a closed conformation (lecc.pdb). The
PRTase flexible loop (yellow), glutamine-binding loop (teal), and C-terminal helix (red) all undergo large conformational changes. The DON-adduct and cPRPP analog are shown in ball-and-stick representation in the closed structure.
I)etermination of the crystal structure of apo-E. coli PurD by the Ealick laboratory afforded the
opportunity to produce a model for interactions between PurF and PurD (58). The structure of
PurD revealed that it is a member of the ATP-Grasp superfamily of enzymes that all utilize
acyl-phosphate intermediates during ATP-dependent amide bond formation (59). Analysis of the
crystal structures of the E. coli PurF (closed form) and apo-PurD indicated that a docking model
could be constructed that aligns the enzyme active sites (Figure 1.8) (58). This model was based on the observed shape and charge complementarity between the structures. Another centralfeature of this model is that the proposed protein interface is comprised of the PurF mobile loops
(Figure 1.9). It was proposed that movement of these loops (specifically the PRTase flexible
loop) during complex formation with PurD leads to PRA channeling.In Chapter 2, stopped-flow fluorescence spectroscopy has been utilized to provide direct
evidence for transient protein-protein interactions between PurF and PurD. Unlike the methods
listed in Table 1.2, stopped-flow fluorescence spectroscopy can be used to detect transientinteractions during which the complex half-life may be on the order of milliseconds.
Fluorescence reporters site-specifically incorporated into each of the PurF mobile regions have
been examined for changes occurring upon complex formation with PurD. With the use of a3-syringe stopped-flow apparatus, interactions between PurF and PurD during PRA synthesis in
the pre-steady state were probed. The success of these experiments hinged upon a dual-labeling strategy in which tryptophans in PurF and PurD were replaced with unnatural amino acids.Fluorescence from PurD was reduced by incorporation of 4-fluorotryptophan (4FW) and
additional specificity for PurF fluorescence was gained by incorporation of 7-azatryptophan
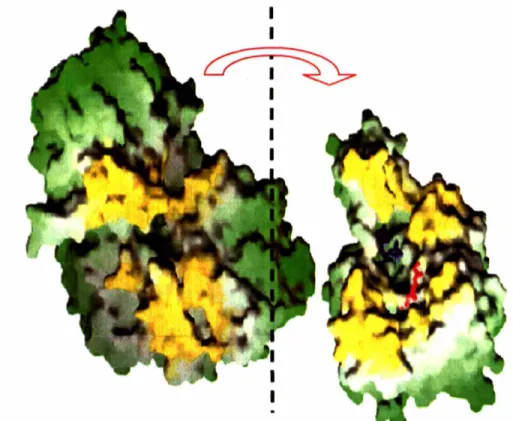
(7AW) to monitor fluorescence at X > 360 nm. No interactions between PurF and PurD wereFigure 1.8- The PurF dimer (left) and PurD monomer (right) docking model proposed by the
Ealick and Stubbe laboratories. In this view, the docking model has been splayed open along the
vertical page axis. Yellow regions on PurF and PurD are proposed to be in contact. Symmetry within the PurF dimer leads to 2 binding sites for PurD, but only one is shown in the figure for clarity. Models for ATP (blue) and GAR (red) are shown in PurD to define the active site.
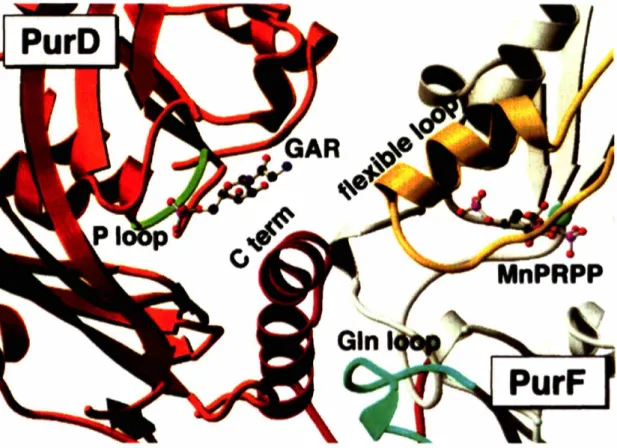
Figure 1.9-
In the PurF:PurD docking model, the active sites of PurF (grey) and PurD (red-orange) are proposed to be in contact. The active site of PurF is noted by the substrate analogfrom the crystal structure (Mn2+-cPRPP). The active site is covered by the PurF mobile loops
(the glutamine loop (residues 73-85, teal), the flexible loop (residues 327-350, yellow), and the C-terminal helix (residues 470-499, red)). The location of the PurD active site is shown by a modeled GAR substrate and the partially disordered, ATP-binding P-loop (green).
detected in the pre-steady state using this strategy. The implication of these findings with regard
to the validity of the docking model, transient protein:protein interactions, and PRA channeling
is discussed in detail.1.6 The B. subtilis FGAR-AT Protein Complex
The fourth step in purine biosynthesis (Scheme 1.1) is carried out by a triad-class AT
enzyme that catalyzes the glutamine- and ATP-dependent conversion of an amide
(formylglycinamide ribonucleotide, FGAR) to an amidine (formyglycinamidine ribonucleotide,
FGAM), ADP, P, and glutamate. Searching for purL equivalents in diverse genomes has
revealed that this reaction is carried out in different organisms by one of two related enzymes(Figure 1.10). Gram-negative bacteria and eukaryotes contain a large PurL (lgPurL, -140 kDa)
that is composed of 4 domains. The N-terminal domain occupies the first 150 amino acids and
is not homologous to any known protein motif. The middle -800 amino acids contain two homologous regions similar to PurM, an enzyme that catalyzes the fifth step of purinebiosynthesis (Scheme 1.1). The C-terminal -220 amino acids contain a typical triad glutaminase
domain.
Analysis of the purine operon in B. subtilis by Zalkin and Nygaard indicated that instead
of one large enzyme, FGAM formation is carried out by a multi-protein complex composed of 3proteins (Figure 1.10) (60). In B. subtilis, the smPurL enzyme (-750 amino acids) is
homologous to the central region of lgPurL, and PurQ (-220 amino acids) is a triad glutaminase. No protein could be found with sequence homology to the N-terminal domain of lgPurL;
however, an orf was found in the purine operon near the smpurL and purQ genes. Genetic
disruption of this orf in B. subtilis created a purine auxotroph and subsequent analysis indicated
that the protein encoded by this gene (-80 amino acids) was necessary for FGAMlarge Purl (lgPurL)-Gram
negative, Salmonella
1295 aa
---
N-terminal Domain PurM-Like Domain 1 Active Site PurM-Like Domain 2 Triad Glutaminase-
PurM-Like Domain 2 PurM-Like Domain 1 Active SiteSmall Purl (smPurl)-Gram
positive. B. subtilis
742
aa
No Sequence Homology(
PurQ
225
aa
Triad GlutaminaseFigure t.tO-Alignments between IgPurL and smPurL, PurQ, and PurS proteins. Sequence
analysis suggests that the IgPurLs contain 4 domains. In B. subtilis, smPurL is analogous to the central PurM-like domains. PurQ is highly homologous to the C-terminal triad glutaminase domain. PurS has no sequence homology to any domain of IgPurL and is half the size of the N-terminal domain.