APPLYING SUPPLY CHAIN METHODOLOGY TO A
CENTRALIZED SOFTWARE LICENSING STRATEGY
by
Rachel Felice Sheinbein
B.S. Chemical Engineering, University of Pennsylvania, 1997
MASSACHUSETTS INSTIruTE Submitted to the Sloan School of Management and the OF TECHNOLOGY
Department of Civil and Environmental Engineering In Partial Fulfillment of the Requirements for the Degrees of
Master of Business Administration
LIBRARIES
Master of Science in Civil and Environmental Engineering In conjunction with the Leaders for Manufacturing Program at the
Massachusetts Institute of Technology
May 2004 [
;'0 Massachusetts Institute of Technology, 2004. All rights reserved.
Signature of Author
MIT Sloan School of Management & MIT Department of Civil and Environmental Engineering May 7, 2004 Certified by
- ~r. Sara L. Beckman, Thesis Advisor Sr. Lecturer, University of Califi5Qa BerkelejHJas School of Business Certified by
Certified by
Certified by
Accepted by
Accepted by
Dr. Abbott Weiss, Thesis Advisor Sr. Lectur;Eigiiie-ring Systems Di , MIT
Dr. Donald B. Rosenfield, Thesis Reader Sr. Lecturer, Sloan School of Management, MIT
Dr' Cynthia Ba art, Thesis Reader Professor of Civil and Environmental Engineering, MIT
Margaret Andrews Director of Master's Proggim, Sloan Scho/7Managemfft, MIT
%r. H 'di Nepf Chair, Graduate Committee, Civil and Environmental Engineerng, MIT
APPLYING SUPPLY CHAIN METHODOLOGY TO A
CENTRALIZED SOFTWARE LICENSING STRATEGY
by
Rachel Felice Sheinbein
Submitted to the Sloan School of Management and the
Department of Civil and Environmental Engineering on May 7, 2004
In Partial Fulfillment of the Requirements for the Degrees of
Master of Business Administration and
Master of Science in Civil and Environmental Engineering
ABSTRACT
Eleven percent of companies spend between $150K and $200K per year per engineer on
software development tools and nine percent spend more than $200K, according to a
Silicon Integration Initiative/Gartner/EE Times study from 2002. For Agilent
Technologies, these costs result in spending tens of millions of dollars each year on
software, and for Motorola, the costs are more than $1 OOM each year. From the current
trends in software spending, one can infer that companies will pay even more for
software in the future, because the cost of the software itself is rising and because of the
complexity of the technology needed for innovation.
In order to understand whether the total spending on software is appropriate and
necessary, Agilent sponsored this project to create a model that analyzes the trade-offs
between the cost of software and the cost of software unavailability. The model treats
software licenses as supplies to the development of a product, and thus, supply chain
methodologies such as inventory (cost of licenses), stock outs (cost of unavailability) and
service level are applied. The goal of the model is to minimize software costs while
maintaining a satisfactory level of service. The thesis explains the model and then shows
the results from applying it to four software products that Agilent currently uses.
The results show that in the absence of this type of analysis, Agilent spends more than
necessary for software licenses. In fact, Agilent can reduce costs by at least
5%.
This
model can be used by Agilent and other companies to optimize software purchases.
Thesis Supervisor: Sara Beckman, Sr. Lecturer, Haas School of Business, University of California Berkeley Thesis Supervisor: Abbott Weiss, Sr. Lecturer, Engineering Systems Division, MITThesis Reader: Donald Rosenfield, Sr. Lecturer, Sloan School of Management, MIT
A
CKNOWLEDGEMENTS
Without Agilent Technologies, this thesis would not have been produced. Thank you to
Ted Lancaster and Pete Woodhouse for creating a rich problem statement and giving me
the opportunity to explore the solutions. Scott Scaramastro served as an excellent mentor
and reminded me to relax when I thought the answers would never be realized. I could
have never asked for a better project champion than Janet Wolff. Champion is the perfect
word for her role. I would also like to thank Patrick Pulis and Charlie Rothschild for
always being available to bounce off ideas, and Marie Shrodes and Gene Wright for
teaching me to use an excellent project management process.
My advisors, Drs. Sara Beckman and Abbott Weiss, helped me to produce a powerful
model that is still simple. They also patiently edited this thesis so that the model could be
understood by others. I appreciate their wisdom and steadfastness.
I wish to gratefully acknowledge the Leaders For Manufacturing program, a partnership
between MIT and major U.S. manufacturing companies, who sponsored this research. I
feel honored to be a part of the incredible LFM program that provides a challenging and
nurturing environment for students to explore and grow. The supportive staff opens the
doors to learning by removing obstacles. Specifically, Bill Hanson always reminded me
of my strengths, gave me thoughtful advice, and created opportunities for me to lead.
Furthermore, my LFM classmates stimulated new thoughts and taught me more than I
considered possible. I would particularly like to thank A-P Hurd for her keen insight, her
poignant questions and her ability to produce such eloquent sentences. I would also like
to thank Michelle Bernson for always having time to create opportunities for our class to
join together and for serving as a role-model for community involvement. In addition,
my classmates from all my previous years of education were excellent teachers and they
continue to challenge me.
Finally, I cannot say enough about my family. I feel so lucky to be part of a family that
continuously supports me, brags about me, and makes it possible for me to succeed. My
grandparents, who did not have a chance to have a college education, still emphasized the
importance for their children and grandchildren. Furthermore, my Grandma Sally
reminds me that small things can be so wonderful. My siblings have varied interests and
each contributes to the community in meaningful ways. I learn from their achievements
daily. My dad spent many hours reminding me that I should not give up on my math
homework, even when I was frustrated. His enthusiasm and guidance served as the
necessary foundation for my education and career. I wish he could have read this thesis
to see some of the results of his encouragement. And, lastly, and most important, I would
like to acknowledge my mother. My mom is an incredible, independent and brilliant
woman. She is also an unbelievable mom and friend. Her relentless support of all of my
endeavors as well as her willingness to jump in and help out at any time, made it possible
for me to complete my studies. Thank you so much for all that you have done for me.
ABSTRACT ... 3 ACKNOW LEDGEMENTS... 4 Chapter 1: Introduction... 7 1.1 Project M otivation: ... 7 1.2 Chapter Overview ... 8 1.3 Project Overview : ... 8 1.4 Agilent Overview ... 9
1.5 A gilent Engineering Services (AES) Overview ... 11
1.6 Sum m ary of Findings... 12
1.7 Project M anagem ent (PM ): The Construct ... 13
1.7.1 Overview of PM tools for AES... 13
1.7.2 Assessment of the PM tools as applied to this project... 15
1.8 Organization of Thesis... 17
Chapter 2: Project Description: Applying Supply Chain Concepts to Software License Acquisition... 18
2.1 Introduction... 18
2.2 Comparing Cost of Licenses (inventory) and Cost of Unavailability (stock out)... 19
2.3 Definition of Service Levels ... 19
2.4 Model Inputs: Quantifying Costs of Licenses and Inventory ... 21
2.4.1 Cost of Licenses (inventory)... 21
2.4.1.1 License U sage Data Integrity Issues ... 24
2.4.1.2 Cost of Licenses Sum m ary ... 25
2.4.2 Cost of Unavailability (stock out)... 26
2.4.2.1 Hypothesis: Profit Delay and Overtime Frustration ... 26
2.4.2.2 Engineers' Perspective... 26
2.4.2.2.1 Conclusions from Interviews ... 27
2.4.2.3 Product launch delay: Literature Review ... 28
2.4.2.4 Overtim e/Frustration... 29
2.4.2.5 Revenue Loss from Product Launch Delay ... 29
2.4.2.6 Profit Loss: Ranges Based on Literature Review ... 31
2.4.2.7 Cost of Unavailability: Summary of Profit Loss Scenarios... 32
2.4.2.8 Graphical Sum m ary of Cost of Unavailability ... 32
2.5 M odel Output: Determ ining Total Costs ... 33
2.6 Conclusion ... 36
Chapter 3: Case Studies ... 37
3.1 Introduction... 37
3.2 Case Studies ... 37
3.2.1 Case Study 1: Printed Circuit Board (PCB) Design Tool 1... 38
3.2.1.1 Cost of Licenses... 38
3.2.1.2 Total Costs ... 42
3.2.1.3 Cost Im plications ... 45
3.2.2 Cost Im plications for Case Studies 2-4... 46
3.3 Key Learning from Case Studies 2, 3, 4 ... 47
3.3.1 License usage tim e range ... 47
3.3.3 Contract implications ... 49
3.4 Conclusion ... 51
Chapter 4: Future U se of M odels and Benchm arking ... 52
4.1 Introduction... 52
4.2 Forecasting... 52
4.3 Review Process ... 53
4.4 Benchm arking ... 54
4.5 Conclusion ... 56
Chapter 5: The Organizational Environm ent and its Impact ... 57
5.1 Introduction... 57
5.2 Econom ic Clim ate... 57
5.3 Culture: Collegial and Loyal ... 58
5.4 Politics: The Powerful Development Engineers... 60
5.5 Structure: Decentralized Groups... 63
5.6 Inventing: the com m on denom inator ... 66
5.7 Interning in this organization... 66
5.8 Reflection... 68
5.9 Conclusion ... 69
Chapter 6: Conclusion... 70
6.1 Introduction... 70
6.2 Sum mary of the m odel... 70
6.3 Recom m endations... 71
6.4 Lessons Learned... 72
6.5 Sum m ary ... 73
Appendix A: ... 74
Chapter 1: Introduction
1.1 Project Motivation:
More than forty percent of the 166 companies studied in 2002 by Silicon Integration Initiative/Gartner/EE Times spend more than one hundred thousand dollars per engineer on design automation tools.' This money is spent to acquire licenses or copies of the software to perform various engineering tasks ranging from printed circuit board assembly layout to integrated circuit simulation to testing software code. Historically, companies have purchased local licenses for each group within the company. In the past five years, however, they have started to acquire the licenses at the corporate level, and to share them globally across the engineering functions in the company2.
These companies have realized major cost savings as a result, as they can buy far fewer licenses to serve the overall demand when those licenses are shared. A small consortium of companies that have implemented global licensing (e.g., Agilent, Intel, Ford,
Honeywell, Motorola, Texas Instruments) share best-known practices by meeting twice a month. However, the process of forecasting demand for licenses, deciding how many to acquire and administering their use within the company still needs improvement. This drive for improving the global licensing program motivated Agilent to develop the project described in this thesis.
Agilent Technologies, in particular, spends tens of millions of dollars each year on software used by engineers to develop products, but it does not have a rigorous approach to determine whether the amount spent is necessary to support the needs of the
organization. The goal of this project is to provide Agilent a more analytic method for minimizing centralized license software costs while maintaining a satisfactory level of service for the design engineers. This project employs a quantitative method based on
'Silicon Integrated Initiative Inc., Gartner Dataquest, EE Times. Engineering Design Automation Study. May 2002.
2 Griffith, Dan Chairperson, Central Enterprise Licensing User Group (22 company consortium) and Manager, Comprehensive Software Asset Management at Motorola. E-mail dated 12-2-03.
those used in supply chain management to evaluate the tradeoffs between the cost of licenses (i.e., having an inventory of licenses) and the cost of license unavailability (i.e., having engineers sit idle, or project launch delayed). The value of this project is to have better information than is currently provided by heuristics, thus saving Agilent money.
1.2 Chapter Overview
This chapter introduces the project and outlines the results of an internship conducted at Agilent Technologies in the summer and fall of 2003. It also gives a high-level overview of the company and the group that hosted the internship. Finally, it explains the
organization of this thesis.
1.3 Project Overview:
Based on the literature on supply chain management, specifically related to balancing inventory carrying costs and customer service levels, I developed a model for examining the tradeoffs between software license costs and license unavailability. I then conducted case studies on four different software products that varied in terms of cost, complexity and usage patterns. In each case, I studied the usage patterns for those products over the past year, collected data on the costs of the licenses, and assessed the effects of
unavailability of the products to the engineering organization and the company at large. From this information, I was able to determine an optimal number (inventory) of licenses to have based on the costs of licenses and the cost of unavailability (stock outs) at different service levels.
In the current business environment, the average of the results of the case studies showed that Agilent can save more than 5% of what it currently spends on software licenses by reducing the number of licenses it owns. The general results from the case studies will aid in making determinations for other current and future software products.
Furthermore, the model itself can be used to predict license requirements as the economy recovers and business conditions change.
1.4 Agilent Overview
Agilent Technologies' mission is: "to provide solutions and technologies that
revolutionize the way people live and work." Agilent is a $6 billion company that has been unprofitable from August 2001 until October 2003 (effectively the 9 quarters preceding and including this internship). Agilent was originally made up of three groups from Hewlett Packard (HP). HP (now Hewlett Packard Compaq), founded in 1939, decided to spin-off these groups on November 1, 1999 in order to form Agilent Technologies. See 1.4.1.
March 2,
1999
HP announces creation of
two independent companies
1W
November 1, 1999 June 2, 2000
Agilent starts operating as Agilent becomes
an independent company
fully independent
wi
July 28, 1999
Agilent's name
is introduced
November 18, 1999
Agilent's IPO
takes place
Figure 1.4.1 Timeline of Agilent's spin-off from HP3
Agilent now has four main business groups: Test and Measurement (TMG), Automated Test Equipment (ATG), Semiconductor Products (SPG) and Life Sciences and Chemical Analysis (LSCA).
The Test and Measurement Group (TMG) is the largest and accounts for about 43% of Agilent's revenue and includes the Automated Test, Communications Solutions and
3 Figure taken from Agilent Profile Slides, Agilent Technologies, Inc., 2003
Electronic Product and Solutions divisions. The core businesses within the group are communications test, electronics test and service4. TMG considers broadband, IP/data networking, wireless, network management software and aerospace/defense areas of opportunity. This group produces products such as oscilloscopes, RF and Microwave instruments and systems, and lightwave and photonic measurement solutions.
The next largest group, which generates about 26% of Agilent's revenue, is the Semiconductor Products Group (SPG). SPG lists its core businesses as fiber optic communications, infrared components, ASICs and optoelectronics. Future opportunities include gigabit networking, cellular chipsets, wireless appliance, and networking ASICs. One of the blockbuster products that came out of this group in the last few years is the optical device that is used in computer mouse devices.
Life Sciences and Chemical Analysis (LSCA), which makes up about 20% of Agilent's revenue, has maintained profitability even during the times when Agilent as a whole was not realizing a profit. This group has products in the exciting biotechnology space, including micro arrays, gene expression and proteomics. Support services and training bring in about 20% of the revenue for this group. Traditional products include chemical analysis equipment such as general and liquid chromatography and mass spectrometry tools. Areas of opportunity include lab-on-a-chip, bridging informatics, as well as homeland defense, food safety and environmental work in Asia.
The Assembly Test Group (ATG) brings in about 11% of Agilent's revenue. This group has equipment for testing parametric diagnostics, non-volatile memory, mixed-signal, analogs, systems-on-a-chip, automated x-rays etc. It sees future opportunities in areas
such as digital consumer and wireless products and enterprise networking and storage. An organization chart with all these groups is shown in Figure 1.4.2 below.
Life Sciences Chemical Anatysis
Chris van Ingen
Figure 1.4.2 Organization Chart for Agilent Technologies
As is clear from the lists of inventive technologies and product lines, new product development is core to Agilent's future success. All of these groups use software in the development of their products. Some software tools are used solely in certain groups; ASIC design tools, for example, are used only in SPG. Other software products, such as
software bug detection tools, are used in every business. Thus, the research represented in this thesis is germane to the entire organization and critical in supporting the
organization's future.
1.5 Agilent Engineering Services (AES) Overview
In addition to these business groups, Agilent has centralized support groups that it refers to as the Global Infrastructure (GI). Groups such as finance and legal are part of the GI
as well as the group that hosted this project, Agilent Engineering Services (AES). AES plays two critical roles: it provides central engineering support and owns the centralized
--- --- -- --- ---- ----- ----Semiconductor Products Young Sohn Automtated Test Jack Trautman
systems for product generation. Central engineering support includes the role of coordinating knowledge transfer and process leadership among engineers in different organizations and geographies. The group's projects include implementing a global enterprise resource planning system and holding monthly knowledge-sharing meetings with engineers in the same discipline from different business groups. This group is also responsible for managing central software licensing.
Originally, each of the four business groups negotiated its own software licenses for the software to support its new product development, but a coordination initiative launched by AES resulted in sharing software licenses across the corporation. For the past 2 years, AES has negotiated and managed the contracts for twelve software vendors that provide software for such tasks as ASIC development, printed circuit board design and software coding. This consolidation effort alone saved Agilent a large amount of money as they reduced duplicative efforts, were able to negotiate better deals with some of the software vendors, and could carry fewer licenses while still providing the same service level. AES is now ready to take the next step, however, to fine tune the centralized process and see if there is the potential for further savings. AES thus developed the problem statement for the project for this thesis:
Agilent would like to allow our engineers to have access to the best tools,
whenever they need them. However, this is prohibitively expensive, so a balance between supply and demand needs to be struck. The problem we face is to know where that balance point is, predict it and be able to supply our engineers at that level.
1.6 Summary of Findings
The research project results indicate that in the absence of a cost analysis, Agilent buys at least 5% more software licenses than it needs. Without the cost data, Agilent can only rely on past usage charts and informed intuition for making decisions on quantities of
licenses to buy. The cost information, coupled with usage information, gives Agilent a powerful tool to determine whether buying more licenses is really worth the expense. Cost pressures at Agilent are intense, particularly after two years without profits, so this analysis is very timely. There is the possibility of saving more than $ 1M per year using this model. Further, as Agilent starts to make money and grow, this model will allow the company to appropriately increase the number of licenses purchased to meet the growing needs of the organization.
1.7 Project Management (PM): The Construct
In order to conduct the project, I used Agilent Engineering Services' (AES) tailored project management process. The PM tools forced me to operate to a schedule. They also created a direction for the project and ensured that management was aware of my plans.
I include this section in my thesis, in part, because of anecdotal evidence I've collected from my classmates about the lack of project management on many of their projects. Overall, I found these tools useful, and I believe that my classmates would have benefited from the use of this type of tool.
1.7.1 Overview of PM tools for AES
AES employs a project management lifecycle tool for each of its projects. There are five main sections: concept, proposal, execute/monitor/control, close and lessons learned. The execute/monitor/control portion is made up of four phases: analysis, design, build and validate. (See figure below 1.7.1.1)
Analysis Design Bild Valkate E'xecute MCltronwCnto Project Plan WBS Risk Matrix NPV Analysis
Figure 1.7.1.1 Project Management Lifecycle
A project starts at the conceptual phase. At this point, someone has an idea for a project that will aid the company, but the details are unspecified. The employee writes up a concept sheet and receives approval from management to go to the proposal phase. During the proposal phase, the employee writes a clear project plan with a problem statement, the business goals, the scope, the resources needed etc. This is all presented to management along with a risk matrix, a net present value analysis, and a work
breakdown structure (WBS). If this is approved, the project enters the analysis phase and actual work begins on the project itself.
A standard project would continue through the design, build and validate phases with management review after each phase. However, if it makes sense to combine phases because iteration is needed or design and build can be one effort, then this is possible. In fact, the lead for this process in AES said about the project management tools, "It's not the templates and it's not even the process, it's really about the thinking,"5 so there is room for flexibility when it makes sense.
AES uses one lifecycle to make the process straightforward to the users, but there are many different lifecycles that can be used depending on the focus of the project.6 These include control-oriented project lifecycles, quality-oriented lifecycles and risk-oriented
5 Wright, Gene, Process Lead for AES Program Management tools at Agilent. Phone conversation 9-03. 6 Bonnal, Pierre, Didier, Gourc, and Lacoste, Germain "The life cycle of technical projects" Project Management Journal. Vol 3 Mar 2002 p.1
lifecycles.7 A control-oriented project lifecycle, for example, would focus on ensuring that the project meets its specifications throughout the implementation phase and meets the schedule within budget; a quality-oriented lifecycle would spend more time on validating that the results prove, without any ambiguity, the original intent of the project. AES' lifecycle is more general. It includes components of control, quality and risk, but it focuses on each of these at a higher level than the lifecycles described above. This is so that it can apply to all of the projects for the group.
In addition to using a standard lifecycle, AES also makes the process simple by offering templates for many of the tasks. There are templates for all of the documentation for the proposal phase, and phase reviews have a power point template. There is also a similar power point template for program reviews, which occur between phase reviews in order to give management an update on the project's progress. These program reviews provide monthly updates on the project, and project managers are also encouraged to publish weekly updates. This provides an opportunity for stakeholders to give feedback
throughout the process.
1.7.2 Assessment of the PM tools as applied to this project
The PM process was easy to learn, and after a week at Agilent, I knew the basic components. Most projects would have started with the concept phase. However, that phase was completed before I arrived: management had created the project and had already bought into it. Therefore, as soon as I talked to a couple of people and gathered ideas about my project, I began writing the proposal documentation. Even though by this point I had some idea about my project, I did struggle to convey the goals, objectives, and the risks in the plan. I also struggled to compute the expected net present value of the project because it was based on huge assumptions, so the analysis seemed questionable to me.
7 Ibid.
I had a lot of apprehension in the beginning, but as I started the analysis phase, I kept going back to the original proposal to help with scope and to remember the original intent. Although I thought the original plan would not reflect the actual execution, I found that it did. The proposal served as the foundation for the next steps and is still applicable at the end of the project. It helped me decide when to take one path versus another, but it was not too restrictive. Later the words I used in the program plan took a quantitative form and had a deeper layer of meaning. Some of the statements became inaccurate, but nonetheless the proposal documents were very powerful and useful.
The PM tools gave structure to the project and provided a built-in process for managing the project. Even though the actual work to be done was not always clear, there was never any question about the process to use. I talked with other MIT interns working at
different companies, and many of them did not set up formal plans in the beginning. This often resulted in frustration and unclear goals, and even a struggle to come up with a coherent thesis topic towards the end of the internship. However, I did not encounter these problems because of the PM tools, which provided clear guidance throughout the internship.
In addition, I received instruction on the tools and support and encouragement for utilizing them. The PM tools provided the most impact at the beginning of the project and in the getting-started phase. Later in the project lifecycle, the communication and review tools were used, but they required a lot less thought and did not aid in shaping the project.
One point of note in the process is that preparing for the presentations often took a significant amount of time. The purpose of the presentations is to communicate the results to date and receive feedback. AES conveys that the presentations can and should be created quickly, but I did not find this to be the case. However, it was beneficial to put in this time because it resulted in more substantial feedback; AES should not bill the presentations as a quick endeavor.
1.8 Organization of Thesis
The remainder of this thesis provides more detail about the development of the model and the results achieved in the four case studies. Specifically, Chapter 2 describes the
application of supply chain methodology to software licenses and the particular model developed as part of this project. Chapter 3 then reports the findings of the models for four different software products. The results in Chapter 3 are based on historical data, so Chapter 4 explores the effects that various future events might have on the integrity of the findings and also recommends points at which to reexamine the results. Chapter 5
describes the organizational environment and its effects on the project. Finally, Chapter 6 gives the recommendations and lessons learned.
Chapter 2: Project Description: Applying Supply Chain Concepts to Software License Acquisition
2.1 Introduction
Agilent Engineering Services has a team of people responsible for the Engineering Design Automation (EDA) global-software-tool licensing program. Three of the members of this team manage the contracts with the suppliers and determine the license needs for each software tool. No standard process for making decisions on number of licenses exists, but the negotiators look at usage graphs that include usage utilization and periods of peak usage when making their decisions. Each negotiator's intuition also plays a role in the decision making process.
AES management wanted to know whether its investment in EDA software tools was appropriate. With the current process, the negotiators did not take detailed cost trade-off
information into consideration when making decisions and did not know whether they were purchasing the optimal number of licenses to adequately serve the engineering
community at reasonable cost. As a result, AES created this project to construct a cost-based model.
After reviewing different modeling techniques, I chose a supply chain model that is commonly applied to physical products. The methodology relies on basic supply chain concepts such as inventory, stock out and service levels. Specifically, the methodology calculates the cost of having inventory (in this case the cost to purchase software licenses) and the cost of having stock outs (in this case the cost of not providing an engineer with a software tool when needed) and allows the user to identify a cost effective level of service (acceptable number of stock outs). This chapter describes the application of supply chain concepts for software licenses and the definition of the specific terminology for this project.
2.2 Comparing Cost of Licenses (inventory) and Cost of Unavailability (stock out)
AES is responsible for contracting with suppliers for software licenses. In more than 60% of the contracts9, it tells the software supplier how many licenses it needs, based on the best estimates the negotiators can make about what demand will be over the life of the contract, and then pays for that many licenses over the period of the contract. The
contract length varies from 3-5 years, and usage can fluctuate during that time. The supplier makes the licenses available on a Central Licensing Server (CLS), supported by Agilent, from which members of the worldwide Agilent engineering community can check out the licenses. When all of the licenses are checked out, engineers must wait for one to become available on the CLS. Agilent does not want to have so many licenses that it is paying for a large number of unused licenses, but on the other hand, it wants to have enough so that licenses are available when engineers need them. Assessing this tradeoff is similar to determining how much inventory to carry of physical products: there are costs of carrying unused or unsold inventory, and there are costs of not having that inventory available when needed.
In making inventory trade-offs, a company will establish the amount of inventory such that it can satisfy a specified demand. In doing so, it will consider the cost of holding this inventory as well as the cost of unavailability or stock out. (This is the cost incurred when a customer requests a product, and it is unavailable.) With this information, the company will establish an optimal service level (number of times the product is available as a percent of time asked for). In this project, I applied these same concepts of inventory, stock outs and service levels to software tools.
2.3 Definition of Service Levels
9 On the other 40% or so of Agilent's contracts, the supplier will provide unlimited licenses and charge a fixed amount or charge a pay per use fee. Under such circumstances, the model developed in this thesis is less applicable but still provides some insight (See Section 3.3.2.3). When Agilent pays only for its usage, then there need be no stock outs, and Agilent never pays for excess inventory of licenses.
Service level is a common supply chain term used to explain what percentage of the time the orders for supplies or products will be filled or available from stock.10 For this
project, the service level translates into the number of hours that a license is available each year when requested. In this model, I assumed that licenses may be requested 24 hours per day, 365 days per year. This is a reasonable assumption given that Agilent is a global company, and that engineers are working somewhere in the world at any given time during the day. In actual fact, for most licenses, there are regular requests
throughout the 24-hour day, but weekends and holidays show lower demand. As Agilent increases its operations outside of the US there will be more consistent use throughout the days and weeks. For now, my assumption of 24-hour use 365 days a year is
conservative; minimally, it ensures that peak (weekday) use is covered.
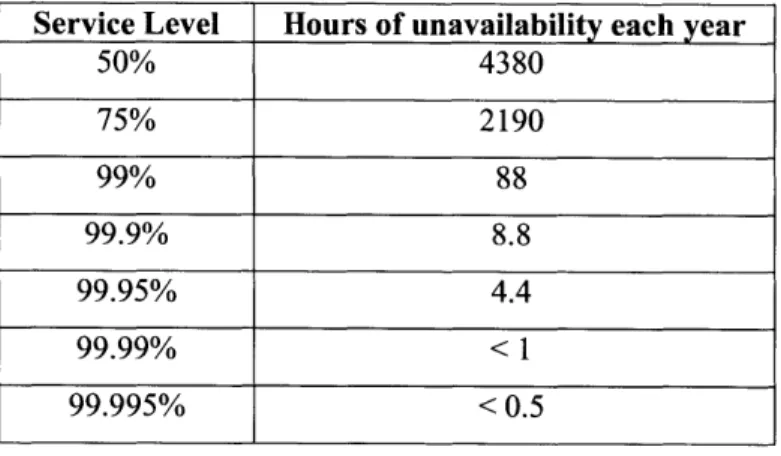
If Agilent chooses to offer a 99% service level, licenses are unavailable 1% of the time, which is 88 (365 days/year * 24 hours/day * 0.01) hours per year. Other service levels and their expected hours of unavailability are shown in Figure 2.3.1
Service Level Hours of unavailability each year
50% 4380 75% 2190 99% 88 99.9% 8.8 99.95% 4.4 99.99% < 1 99.995% < 0.5
Figure 2.3.1 Hours of Unavailability at Various Service Levels
These hours of unavailability are spread out over all of the users and over the entire year. The probability that all the hours will occur in a row (meaning that one user would suffer all 4.4 hours of unavailability at the 99.95% service level) is infinitesimal, and the
10 Hopp, Wallace J., Spearman, Mark L, Factory Physics: 2"d Edition. McGraw-Hill Higher Education 2001 p. 70, 489.
probability that the same user will experience more than one outage depends on the total number of users. (If there are more users, the probability that one user will experience more than one outage decreases)
2.4 Model Inputs: Quantifying Costs of Licenses and Inventory
Holding unused software licenses results in an inventory cost (cost of overage) and unavailable licenses result in stock out costs (cost of underage). In order to optimize license numbers, I needed to quantify the cost of each of these for different service levels for each software tool. I will explain how I determined the costs, including the data collection process and the calculations used. I will also relate the assumptions and data integrity issues, which will help to determine the model's applicability for varying circumstances.
2.4.1 Cost of Licenses (inventory)
This section describes how I determined the cost of licenses for each of the service levels of interest. It starts by describing the usage data I collected for each of the four licenses I studied. It then describes how I used this data to determine the mean and standard deviation of demand. Finally, it describes how I calculated the required number of licenses for each service level.
The Central License Server (CLS) stores usage data for the software licenses it
distributes. For each of the four software tools I studied, I extracted hourly usage data for periods of 3, (ex: Jul '02 - Sep '02) 6, (ex: Jul '02 - Dec '02), 9 (ex: Jul' 02 - Feb '03) and 12 (ex: Jul '02 - Jun '03) months. I did the analysis at these different time intervals in order to assess the usage data's sensitivity to time. If the data did change significantly over time, then it would make sense to compare the results from the different time intervals. However, at Agilent, there was not a meaningful difference when using 3 months of data versus 6 or 9 or 12. (This will be discussed again in Chapter 3.)
Because the model I used to determine license needs at the various service levels requires that the demand data be normally distributed (or that it be transformed to normally distributed data), I first tested the data to see whether it was normally distributed. For the demand data that was normally distributed, I calculated average demand and the
variability of the demand for each of the time periods examined (3-months of data, 6 months of data, 9 months of data and 12 months of data).
For the data that was not normally distributed, I attempted a transformation of the data to make it so. Normally distributed data has skew and kurtosis values close to zero. It is
most important that skew be close to zero, so the goal when transforming data is to first try to achieve a skew close to zero and then work on the kurtosis. Transformation is done by applying an exponent (referred to as theta: 0) between 0 and 1. One iteratively applies
different exponents to the data set until the skew and kurtosis approach zero. Once the optimal 0 is found, the average and standard deviation can be calculated. Later, the estimated numbers of licenses can be untransformed by raising them to the power of 1/ 0.
The model works best if the data is normally distributed or transformable to normal. However, if the data is not normal, the model can still provide useful insight. This will be shown when reviewing the case study results in Chapter 3.
For a given service level, the necessary number of licenses can be calculated as the expected or average number of licenses demanded plus a safety stock of licenses to cover the variability in the demand. This safety stock is calculated as a "z" value times the standard deviation of demand, where the "z" value is determined by the required service level. The "z" value represents the point on the standard normal distribution curve for which the area under the curve to the left of that point is equal to the service level. This point is called the "inverse of the normal cumulative distribution" and can easily be calculated using the NORMSINV function in Excel. So, for each service level of interest, and each software tool I studied, I calculated the required number of licenses as:
where E(D) = Expected Demand for licenses
z = the inverse of the normal cumulative distribution for the given service level = NORMSINV (service level)
UD= standard deviation of demand
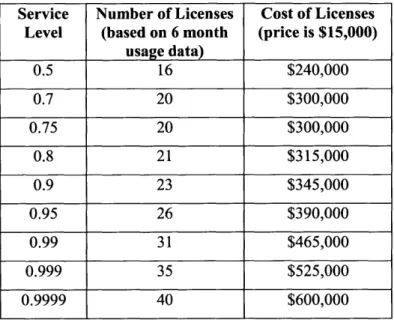
Once I knew the number of licenses required, I multiplied the number by a cost per license to determine the cost of the licenses at different service levels. At Agilent, the price of each license ranges from $1000 to $100,000. (This model assumes that there are
no additional overhead costs for storing the licenses or managing the licenses.) See Figure 2.4.1.1 as an example of cost of licenses data:
Service Number of Licenses Cost of Licenses Level (based on 6 month (price is $15,000)
usage data) 0.5 16 $240,000 0.7 20 $300,000 0.75 20 $300,000 0.8 21 $315,000 0.9 23 $345,000 0.95 26 $390,000 0.99 31 $465,000 0.999 35 $525,000 0.9999 40 $600,000
Figure 2.4.1.1 Example of License Numbers and Cost Data for 6 month Usage Data
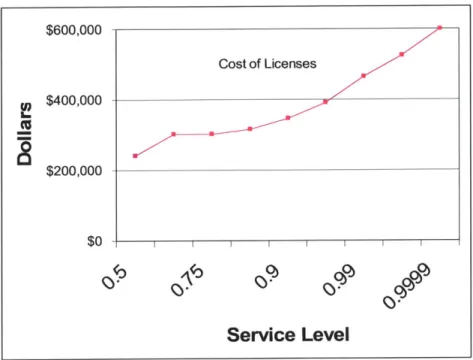
$600,000
$400,000
$200,000
$0
-Service Level
Figure 2.4.1.2 Graph of Cost of Licenses versus Service Level
These same types of results can be computed based on 3, 9 and 12 months of usage data. (See results of the Case Studies in Chapter 3)
2.4.1.1 License Usage Data Integrity Issues
Although I pulled hourly usage data for the same 9-12 months (depending on availability) -- usually from July 2002 to July 2003-- for each software product, the CLS returned a different number of data points for each. None of the data returned included every hour requested, and it is possible that, as a result, the data does not represent the true usage. A rough calculation suggests that for 6 months with 30 days in each month and 24 hours per day, there should be 4320 data points. For the four case study products I received 3178
data points (74%) for one, 2641 data points (60% of the potential hours available) for another, 2374 points (55%) for the third and only 10% for the fourth (This one also did not have normally distributed data, so I did not make any cost conclusions for this product. This will be discussed in Chapter 3.)
Cost of Licenses
Furthermore, the available data only includes data up to the peak number of licenses. If licenses were unavailable (i.e. there is a denial of service for the user), and there were one
or more engineers who needed a license at the time of a peak, this data was not recorded. In other words, demand for licenses above the total number of licenses available is not recorded. This could cause a skew in the data towards lower demand than was actually
experienced, because actual demand may have been more than actual usage during periods of peak demand when all licenses were checked out. Fortunately, there were very
few times when all licenses were checked out, so this issue likely does not have an impact on the data. I recommend, however, that Agilent commence collecting "stock out" data to more accurately reflect demand in future applications of the model.
Finally, all of the usage estimates are based on historical data. There is no forecasting. For the most part, this did not seem to matter, because there was not a major change in average usage when comparing 3 months, 6 months or even a year of data. However, this could be a problem in the future if there are large increases or decreases in license use. Although Agilent knows that it needs to improve its forecasts of software tool usage, we determined that this was outside the scope of my internship project. I nonetheless recommend that Agilent consider developing a tool to forecast software tool usage (see Chapter 4) that can be used as input to this model in the future.
2.4.1.2 Cost of Licenses Summary
There are five steps in determining cost of licenses at different service levels. 1. Collect historical usage data
2. Check for normality (if necessary, transform to normal) 3. Calculate the mean and standard deviation for the data set
4. Calculate the license needs at different service levels (Formula 2.4.1.1)
5. Multiply the license number by the cost per license to determine cost at different service levels
2.4.2 Cost of Unavailability (stock out)
For inventory control, a stock out is defined as a demand unit not being filled because the stock is not available." This cost could include the cost of a lost sale, the cost of being late in filling the demand and/or the cost to meet the demand in some other way. In this case, the cost of a stock out is the cost to Agilent of the unavailability of a license when the engineer requests it. This cost could theoretically range from nothing to the cost of shipping a product late if its introduction were delayed by the unavailability of the software. To better understand the cost of unavailability at Agilent, I came up with a hypothesis about the components of "unavailability" cost, and tested my hypothesis by interviewing Agilent managers and engineers. I then reviewed relevant literature to further understand the cost implications.
2.4.2.1 Hypothesis: Profit Delay and Overtime Frustration
I hypothesized two extreme situations: in the most severe case, a lack of license could prevent an engineer from completing his or her work, and result in a product launch delay. This could potentially be quite expensive to the organization. On the other end of the spectrum, the lack of a license could simply cause the engineer to have to work overtime to make up for the lost time, and would be frustrating, but cost the organization very little. I approximate this cost as if overtime had some negative value, even though 90% of the license users at Agilent are salaried, and thus don't receive overtime pay,
2.4.2.2 Engineers' Perspective
To learn about the real-life effects of license unavailability, I interviewed 30 engineers from different business groups with electrical, mechanical and software backgrounds. I created a questionnaire (see Appendix A) and set up phone meetings. I asked the
" Hopp, Wallace J., Spearman, Mark L, Factory Physics: 2"d Edition. McGraw-Hill Higher Education 2001 p. 78.
engineers about their experiences with license unavailability, and what the effects of unavailability had been or might be.
Only half of the engineers had actually experienced a stock out and most of these
engineers had outages before the Central Licensing System (CLS) was put in place. The engineers who had experienced outages said that they never lasted more than a day, and they never resulted in a product launch delay. However, the outages often resulted in frustration and/or having to rearrange work schedules.
Even though half of the engineers had not actually experienced license unavailability, I needed to understand its impact for analysis purposes. Therefore, I asked the engineers to imagine the impact hypothetically. Their responses indicated that at some points in the project, such as close to a product release, an unavailable license would directly impact the product release date. However, it was possible to conclude, based upon their input, that a couple of hours of outage would usually not have much of an effect on a product launch. It would cause some frustration and rearranging of schedules, but 60% thought that it would probably take an outage of two days to a week for license outages to impact the schedule. Twenty percent believed that in the worst case half a day (four hours) to a day of license outages could actually impact the schedule.
2.4.2.2.1 Conclusions from Interviews
Based on the input from the engineers, I made the following assumptions for the form of the cost of unavailability curve. When licenses are unavailable 4 hours or more per
outage, I assume that the cost of unavailability includes both overtime (representing engineer frustration and work rescheduling costs) and product launch delay costs. When licenses are unavailable 4 hours or less per outage, I assume that the cost of unavailability is only the cost of overtime, and that product launches will not be delayed. Note that this is a conservative assumption, as only 20% of the engineers interviewed thought that product launch delay could occur at the 4-hour delay level. A less conservative, yet still
practical assumption would be that product launch delay costs kick in at two consecutive days of unavailability per year. Although I do not show the results of such an analysis in this thesis, this would cause Agilent to carry even fewer licenses.
2.4.2.3 Product launch delay: Literature Review
The engineers did relate in their interviews that when a task is on the critical path, and the software that is necessary to complete the task is unavailable for 4 hours or more, the task is delayed. This results in a slip in schedule. In order to understand the cost implication of this delay in schedule, I consulted literature on the subject.
Many articles stress the negative implications of product launch delays. One McKinsey study, from the early 1980s, that is quoted in almost every subsequent article on this subject states, "high-tech products that came to market even 6 months late earned 33% less profit over 5 years.'"2, The article indicates that it makes more business sense to go over budget on development costs because, according to the McKinsey study, "profits were only reduced 4% when they came out on time but 50% over budget". The point is further emphasized in a more recent Arthur D. Little study that said, "Exceeding the launch time by 10% (which for a development period of 2 years is less than 3 months) reduced total revenues by 25-30%"".
This often-quoted McKinsey study, originally written by Donald Reinertsen, summarizes the effects based on studying the high-tech industry. Reinertsen becomes more specific in later articles and books in which he states that for each product's market scenario, such as a monopoly, or products with high switching costs, there are different costs of
delays.'5
In the same book, as well as an article he published in 1999, he says that knowing the cost of delay is extremely important, because it helps a company evaluate
12 Edward, Katherine, "Achieving Cycle-Time Excellence in the Global Economy: The Impact of Speed", 2001 AACE International Transaction, PM.12.2
13 Ibid
4
Ibid
15 Reinertsen, Donald, Managing the Design Factory: A Product Developer's Toolkit (Free Press: October 1997) p. 28
trade-offs of speed, product performance etc.16 Reinertsen specifically mentions that companies need a business level cost of delay in order to decide when to add another computer-aided design license. 17
Overall, it is clear that there are costs associated with delaying a product launch. Different authors might offer varying costs, but there is no debate that delays are costly. Furthermore, delaying a project results in more financial losses than when a company exceeds research and development or production spending in an effort to stay on schedule.
2.4.2.4 Overtime/Frustration
As mentioned earlier, more than 90% of the users of the software tools at Agilent do not receive overtime compensation. However, there are cost implications of employees working extra hours and, as a result, often becoming frustrated. Hourly workers typically
receive one and half times their pay (1.5X) for overtime. In order to also incorporate frustration, I added an addition factor of 0.3X, for a total overtime/frustration factor of 1.8X (where X is the average U.S. engineer's salary). However, 30% of the engineers live outside of the US and, for the most part, are paid less than the US wage. Overall, this multiplier only serves as an estimate, but unless this factor was off by a factor of 5 (i.e., the right estimate was actually 9X), the outcome of the model is not sensitive to these assumptions.
2.4.2.5 Revenue Loss from Product Launch Delay
Based on the literature review, and inputs from the engineering community at Agilent, I assumed that more than four hours of software license unavailability causes product
16 Reinertsen, Donald, "How Much is Speed Really Worth?" Electronic Design, May 3, 1999 v47 p. 64F
17 Reinertsen, Don, Managing the Design Factory: A Product Developer's Toolkit (Free Press: October 1997) p. 190
launch delays that result in profit losses. However, there is no proof that this cause and effect relationship actually exists. There are many possible causes of product launch delays such as time to overcome a technical challenge or a problem during
manufacturing. The cause and effect relationship between license unavailability and product launch delays is more tenuous, even though the engineers and R&D management believe it could exist. Engineers also mentioned that for certain products, if the launch is
delayed beyond the market window, the delay could result in missing the market opportunity completely or losing a customer. Licenses would have to be unavailable for a much longer amount of time than the service levels that the model incorporates, so the model ignores this possibility.
If a license is unavailable and does cause a product delay, it would be difficult to
determine which product was actually delayed. Therefore, the model assumes that, in the worst case, the license unavailability causes a delay for Agilent's highest revenue
generating product or, in the more likely situation, the average revenue-generating product. I received the revenue per quarter for the highest and average product for
Agilent's largest product group, EPSG, but obviously these are just ballpark numbers as the revenue for products changes each quarter.
The only available product information came in the form of revenue generated per quarter. However, the cost of unavailability impacts profits, so for each scenario I estimated a range of potential profits from 10-20% of revenue. Obviously, different products have different goals, but this is a good estimate because it is the target for Agilent overall and managers from the business groups concurred that it was appropriate for most products. However, some products might generate more or less profit. Figures 2.4.2.5.1 and 2.4.2.5.2 show the range of profit loss for the highest revenue-generating product and an average revenue-generating product.
Range of Profit Loss for AVERAGE Revenue
$250000 Generating Profit
$200,000- Cost %fPtvct Delay )id
1! Profit Loss (15% menoue)
$150,000 std Delay
Prfi Loss (10 reyenu)
$100,000- cost d Ptodid Delay Pv Loss (2D% mem)
$50,000-$0
bz
Figure 2.4.2.5.1 Profit Loss Range for Figure 2.4.2.5.2 Profit Loss Range for Highest Revenue Generating Product Average Revenue Generating Product
2.4.2.6 Profit Loss: Ranges Based on Literature Review
The figures above assume that every hour of unavailability results in an hour of profit loss and do not incorporate overtime/frustration costs. However, the literature study in Section 2.4.2.3 does not state that this is the case. For example, the ADL study explains that a 10% delay results in a 30% revenue loss, not a 100% profit loss.
A limitation of the literature study is that it relies on knowing the length of time that a product is delayed beyond the original development cycle. The actual length of delay will not be known until the end of the project, which is too late to determine license need. In order to apply the study, in one version of the model, I just assume that the license unavailability results in a 30% reduction in revenue, no matter what the delay actually is. (See Figure 2.4.2.6.1 for the range of profit loss for the 30% of the highest revenue-generating product.) Another version of the model assumes an immediate loss of profit, so that every hour of delay results in an hour of profit loss. (See Figures 2.4.2.5.1 and 2.4.2.5.2) In the latter scenario, the cost of stock out is higher so would cause the model to suggest that Agilent buy more licenses and carry more inventory and have a higher service level than in the case in which the ADL hypothesis is applied.
Range of Profit Loss for IGHEST Revenue Generating Product
$2,000,000 Loss % e)
- -a--Cost of Product Delay Wd
$1,500,000 -d
0 1 Profit Loss (10%revenlue)
$1,000,000 -x + Cost d Pouct Delay W
P mfit Loss (2%rvn)
$0r
0 a
Range of Profit Loss for 30% of Highest Revenue Generatina Product $1,200,000 $800,000 $400,000 $0 CY
Service Level
Figure 2.4.2.6.1 Profit Loss Range for 30% of Highest Revenue Generating Product
2.4.2.7 Cost of Unavailability: Summary of Profit Loss Scenarios
For each software tool, I examined 3 profit-losing cost of unavailability situations: 1. Loss of one hour of profit from Agilent's highest revenue generating product for each hour of license unavailability. (Figure 2.4.2.5.1)
2. Loss of one hour of profit from Agilent's average revenue generating product for each hour of license unavailability. (Figure 2.4.2.5.2)
3. Loss of 30% of hourly revenue from Agilent's highest revenue generating product for each hour of license unavailability. (Figure 2.4.2.6.1)
2.4.2.8 Graphical Summary of Cost of Unavailability
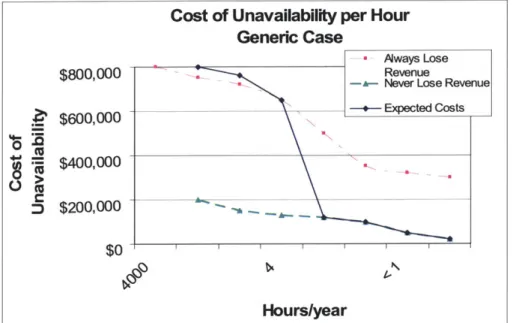
Figure 2.4.2.8.1 summarizes the cost of unavailability graphically. The lowest line is the stock out cost if there is only overtime/frustration and no revenue losses from product launch delay. The top line shows what the costs would be if there was only revenue loss and no overtime/frustration. In actuality, as explained in section 2.4.2.2.1, the expected
Cost of Product Delay w/ Profit Loss (15% revenue) A Cost of Product Delay w/
Profit Loss (10% revenue)
-x- Cost of Product Delay w/
Profit Loss (20% revenue)
0;~ a- a
-i
cost of unavailability is a combination of overtime/frustration and revenue loss up until a certain number of hours of outages per year. On this graph this transition point is shown at 4 hours of unavailability per year. When the unavailability is less than 4 hours per outage, the engineers can definitely make up lost time, and the license unavailability only causes overtime and frustration. In other words, the expected cost is the same as the overtime/frustration cost.
Cost of Unavailability per Hour
Generic Case
--Aways Lose
$800,000 7 -- Revenue
Never Lose Revenue
$600,000 + Expected Costs $400,000 $ $200,000 $0 ' Hours/year
Figure 2.4.2.8.1 Cost of Unavailability: Generic Construct
2.5 Model Output: Determining Total Costs
In order to determine the optimal number of licenses, the cost of licenses is added to the cost of unavailability to calculate the total cost. Total cost is then calculated for various service levels. The goal is to operate at the service level that has the lowest total cost.
I applied this approach to four development software tools; the results of which will be discussed in detail in Chapter 3. For each of those, I determined the cost of licenses at different service levels, using 3, 6, 9 and 12 (when available) months of data. I then calculated the cost of unavailability under the three scenarios described above. Finally, I
generated for each software tool three total cost curves, representing the three different cost of unavailability assumptions. From this set of curves, for each software tool, I was able to suggest an optimal number of licenses that Agilent should buy.
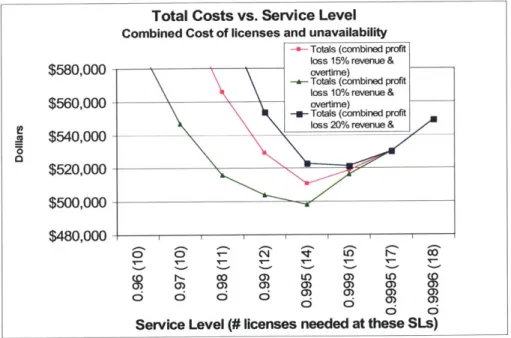
Figure 2.5.1 is an example of the set of cost curves generated for each tool. It uses 6 months of license usage data and the cost of unavailability scenario is the first one in section 2.4.2.7. The graphs show costs in dollars on the y-axis and service levels and corresponding license needs on the x-axis. The graph also displays three curves. These incorporate the cost of unavailability for ranges of profit as percentages of revenue (as shown, for example, in Figure 2.4.2.5.1).
Total Costs vs. Service Level
Combined Cost of licenses and unavailability
--Totals (combined profit loss 15% revenue &
$580,000 overtime)
--Totals (combined profit
E $540,000 vrm)
STotals (7ombined profi
loss 20% revenue &
.2 $540,000-$520,000 $500,000 $480,000-0) C 0 0) (3) LO 0) co 0M M 0) 0 c6 Ci di c 0) a) a) 0) o o o
Service Level (# licenses needed at these SLs) Figure 2.5.1 Total Cost vs. Service Levels
Agilent's goal is to operate at the lowest total cost. In this case, note that the three curves have their lowest point at the same level - or close to the same level. Assuming that the potential profit loss is 10% or 15% of revenue, then the lowest point on Figure 2.5.1 shows that Agilent should operate with 14 licenses at a 99.5% service level. If Agilent
assumes that it is making a 20% profit, then, according to that curve, it should operate with 15 licenses at a 99.9% service level. The absolute total dollar difference between 14
and 15 licenses on the 20% profit curve is less than $2000. The operating manager can decide whether it's worthwhile to spend the extra money or whether the probability of being on that curve is so small that it's not worthwhile.
One other curve that examines the worst case scenario for Agilent, meaning Agilent would have to buy the most number of licenses in this case, is when license unavailability always translates into profit loss and never into overtime frustration. The final curve, with the sub-title "(HIGHEST PROFIT LOSS)" assumes that the potential profit loss is the highest (20%) and that at every service level, the cost of unavailability translates into product loss. At no point on this specific curve is overtime/frustration considered. This curve is shown in Figure 2.5.2. In this case, Agilent should operate with 15 licenses at a 99.9% service level.
Total Costs vs. Service Level
Combined Cost of licenses and unavailability
$580,000 $560,000 E
$540,000--- Totals all profit loss 0 (20% or revenue) O $520,000- (HIGHEST PROFFU
LOSS)
$500,000
$480,000 I I I I I I I
I~- CE) 0) LO) 0)
) ) 0) 0) 0) 0
ci ci ci Ci 0 3
0 6 Service Level (# licenses needed at these SLs) Figure 2.5.2 Total Cost vs. Service Levels
Figures 2.5.1 and 2.5.2 are total cost graphs just based on 6 months of license usage and scenario one from section 2.4.2.7. But, there are similar graphs for different periods of license usage and the two other scenarios summarized in section 2.4.2.7.
All of these different situations result in different total costs, and therefore, have different implications for Agilent. The company can use all of this information to make a business decision. For example, if the costs do not vary much between the cases, then the cost of carrying extra licenses is relatively minor. Thus, Agilent might choose to carry more
licenses. On the other hand, if the cost of carrying more licenses is more significant, then Agilent would err on the side of risking a stock out and carry fewer licenses.
For example, in the case above, the difference between the lowest point in all of the cost curves is one license. Agilent might decide that it does not know which curve to operate on, so it will buy an extra license in order to cover the worst case. Therefore, by
determining the cost of unavailability, and by knowing the cost of each license, Agilent now has the information to determine whether it's fiscally worthwhile to add another license to the pool or when it makes sense to take a license away. The results of the model give all of this information in order to make the best decision.
2.6 Conclusion
This chapter outlined the project and the method for applying supply chain methodology to software licenses. It also explained the terminology used in this application. The next chapter will apply this methodology to four different software products.