Development of a Cylindrical Drift Chamber for the
COMET Phase-I Experiment
Yohei Nakatsugawa1, Xiao-Shan Jiang1, Yoshitaka Kuno2, Hai-Bo Li1, Manabu
Moritsu3, Yu Nakazawa2, Saki Ohta2, Hideyuki Sakamoto4, Akira Sato2, Ming-Liang Wong5, Ting-Sam Wong2, Chen Wu2, Hisataka Yoshida2, Ye Yuan1, Jie Zhang1, and Yao Zhang1
1Institute of High Energy Physics, Chinese Academy of Sciences, Beijing 100049, China 2Department of Physics, Osaka University, Toyonaka, Osaka 560-0043, Japan
3Institute of Particle and Nuclear Studies, KEK, Tsukuba, Ibaraki 305-0801, Japan
4Center for Computational Science, RIKEN, Kobe, Hyogo, 650-0047, Japan
5Universit´e Clermont Auvergne, Clermont-Ferrand, 63000, France
E-mail: [email protected]
(Received January 10, 2020)
A search forµ - e conversion, the COMET experiment, will be conducted at J-PARC. The experiment has two phases. Phase-I aims to measure the background directly and search forµ - e conversion with a sensitivity of 10−15. Phase-II will use the information gained in Phase-I and utilize a much more intense muon beam to achieve a sensitivity of 10−17. The main detector of the COMET Phase-I experiment is a cylindrical drift chamber (CDC). The COMET CDC will be installed in a solenoidal magnetic field, surrounding the muon stopping targets. It was designed to efficiently detect signal electrons of µ - e conversion (105 MeV/c) emitted from the targets with momentum resolution of 200 keV/c. The COMET CDC has already been constructed and the performance test using cosmic ray is in progress. The details of the CDC design and the analysis results of the cosmic ray test is reported.
KEYWORDS: COMET,µ - e conversion, cylindrical drift chamber
1. Introduction
Although the Standard Model (SM) of particle physics successfully explains the experimental observations so far, many questions are left unanswered. It is then believed that the SM is not the full story and many intensive studies have been dedicated to exploring new physics beyond the SM both theoretically and experimentally. Lepton Flavor Violation is one of the processes forbidden in the original SM. However, the discovery of neutrino oscillation revealed that lepton flavor does not conserve in the neutral lepton sector. Charged Lepton Flavor Violation (cLFV) could be induced by neutrino flavor mixing in the intermediate state. However, the branching ratio of such process is pro-portional to (∆m2i j/MW2)2, where∆m2i jis the neutrino mass squared difference and MWis the W-boson mass, and it is estimated to be about 10−54[1, 2]. This is too small to be observed experimentally and implies that cLFV is still forbidden substantially in the framework of the SM extended for neutrino oscillation. Conversely, experimental observations of cLFV process give obvious evidence of exis-tence of new physics beyond the SM. Muon to electron conversion in the nuclear field (µ−N→ e−N)
is a process violating charged lepton flavor, and is considered as one of the most powerful probes to search for cLFV. Sizable branching ratios of muon to electron conversion are predicted by various theoretical models [3–6]. For example, supersymmetric grand unified theory (SUSY-GUT) predicts the branching ratio of the order of 10−14∼ 10−18based on slepton mixing.
1
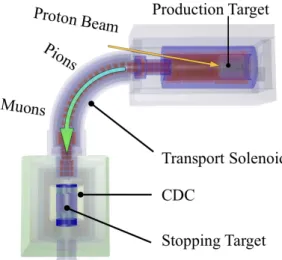
An experiment searching for µ - e conversion, COMET, will be conducted at J-PARC in Japan [7]. In the COMET experiment, an 8 GeV proton beam will be extracted from the J-PARC Main Ring and delivered to a graphite target (production target). A muon beam will be produced through the decay of pions coming from the production target and transported to the stopping targets (17 aluminium disks). Muons stopped inside the targets will be captured by the nucleus and form muonic atoms. The signal electrons ofµ - e conversion in the muonic atoms will be emitted from the stopping targets and measured by the detector systems. The COMET adopts staging strategy, Phase-I and II experiment. The I experiment aims to directly measure the backgrounds for Phase-II and search for µ - e conversion at the sensitivity of 10−15. Figure 1 shows a schematic layout of the Phase-I. The sensitivity of 10−17(or 10−18) will be achieved with the full setup of the COMET experiment in the Phase-II.
Fig. 1. Schematic layout of the COMET Phase-I experiment.
2. COMET Phase-I Cylindrical Drift Chamber
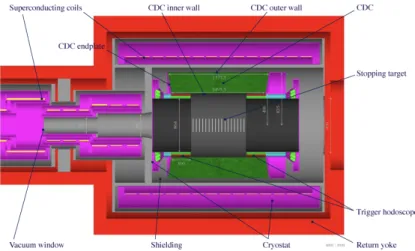
The detector system of the COMET Phase-I is so-called CyDet, which consists of a Cylindrical Drift Chamber (CDC) and trigger hodoscopes. Figure 2 shows a schematic view of the CyDet.
The CDC surrounds the muon stopping targets and is operated in the magnetic field of 1 Tesla to measure the momenta of electrons emitted from the targets. The signal electrons can be identified by its momentum because electrons fromµ - e conversion are mono-energetic (∼105MeV/c). The mo-mentum resolution of 200 keV/c is required to distinguish the signal electrons from the background electrons coming from the high energy tail of the muon Decay-In-Orbit (DIO) in the muonic atoms. Figure 3 shows the electron momentum spectra ofµ - e conversion and DIO.
The inner radius of the CDC is about 50 cm. It was determined so as to avoid the beam flash at the prompt timing. This geometry also helps to reduce the DIO electrons entering into the CDC active volume because the electron momentum spectrum of DIO rapidly decreases in the momentum region higher than 50 MeV/c and the minimum momentum acceptable by the CDC is about 70 MeV/c in the magnetic field of 1 Tesla.
The CDC has totally 20 concentric sense layers. The innermost and outermost layers are guard layers. These two layers have lower voltage and remove the space-charge to keep an appropriate electric field. The wires in each layer have alternating positive and negative stereo angles (±(64-75) mrad). The total number of sense wires are 4986. Each cell has a sense wire surrounded by a grid 011123-2
JPS Conf. Proc. 33, 011123 (2021)
Proceedings of the 3rd J-PARC Symposium (J-PARC2019) Downloaded from journals.jps.jp by 118.70.52.165 on 06/24/21
Fig. 2. Schematic view of the detector system of the COMET Phase-I, CyDet.
Fig. 3. The expected electron momentum spectra. Red and Blue solid line show the spectrum ofµ - e con-version (assuming a branching ratio of 3× 10⁻¹⁵) and DIO, respectively.
Fig. 4. The cell structure of the CDC and drift lines simulated by Garfield (yellow solid lines).
of field wires. The cell size is 16.8 mm × 16.0 mm. In Figure 4, the cell structure and drift lines simulated by Garfield [8] are shown.
The momentum resolution should be about 200 keV/c for 105 MeV/c electrons. For these elec-trons, the multiple-scattering dominantly affects the momentum resolution. Therefore, the CDC is designed to have low mass materials. He:i-C4H10 (90:10) is chosen as the gas mixture of the CDC to reduce the multiple-scattering of electrons in the active volume. From the point of view of low mass detector, the inner wall of the CDC is made of carbon fiber reinforced plastic (CFRP) and its thickness is 0.5 mm. A high voltage up to 1850 V is applied to the sense wires with the field wires at ground potential, giving an avalanche gain of approximately 1-4×10⁴for He:i-C4H10(90:10).
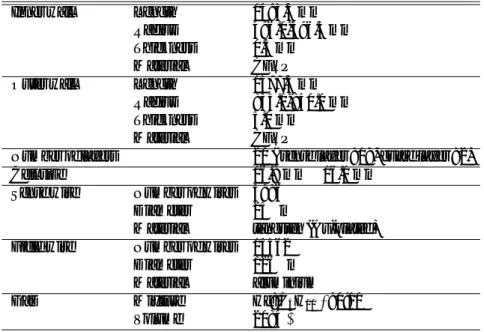
The parameters of the COMET CDC is summarized in Table I. 3. Electronics
The frontend readout electronics for the COMET CDC, RECBE, was developed based on the Belle-II CDC readout board (Figure 5). Each RECBE board has 48 analog input channels, 6 amplifier shaper discriminator ASIC chips, 6 ADCs and an FPGA. The TDC information is provided by the
Table I. The parameters of the COMET CDC.
Inner wall Length 1495.5 mm Radius 496.0-496.5 mm Thickness 0.5 mm
Material CFRP Outer wall Length 1577.3 mm
Radius 835.0-840.0 mm Thickness 5.0 mm
Material CFRP
Number of layers 20 ( sense layer : 18, guard layer : 2)
Cell size 16.8 mm× 16.0 mm
Sense wire Number of wires 4986 Diameter 25µm
Material tangsten (Au-plated) Field wire Number of wires 14562
Diameter 126µm Material aluminium Gas Mixture He:iC4H10/ 90:10
Volume 2084ℓ
FPGA and its sampling rate is 960 MHz. The ADC information is given by 10 bit digits with 30 MHz sampling. In total 104 boards will be used to read out all wires of the CDC.
The trigger for the data acquisition is generated by the FPGA-based online trigger system, COT-TRI. The COTTRI provides a trigger by requiring 4-fold coincidence of hodoscopes, supplemented by wire hit patterns of the tracks in the CDC. They are quite different between high-momentum signal electrons and low-momentum particles or noise hits.
Fig. 5. A photograph of a RECBE board.
Fig. 6. The setup of the cosmic-ray test. The 36 RECBE boards were connected to the readout side of the CDC. The trigger for the DAQ was provided by the coincidence of the scintillation counters, which were placed above and below the CDC.
011123-4
JPS Conf. Proc. 33, 011123 (2021)
Proceedings of the 3rd J-PARC Symposium (J-PARC2019) Downloaded from journals.jps.jp by 118.70.52.165 on 06/24/21
4. Cosmic-ray Test
The COMET CDC was successfully constructed in 2016 and now the performance test using cosmic-ray is ongoing without magnetic field in Fuji Building, KEK, Tsukuba. The enough data were already taken with 1/3 of the whole readout system (36 RECBE boards) to estimate basic per-formances of the CDC. Figure 6 shows the setup of the cosmic-ray test.
A typical cosmic-ray event is displayed in Figure 7. Red dots and solid lines indicate activated wires and reconstructed tracks, respectively.
Fig. 7. A typical cosmic-ray event display. The solid lines show reconstructed tracks.
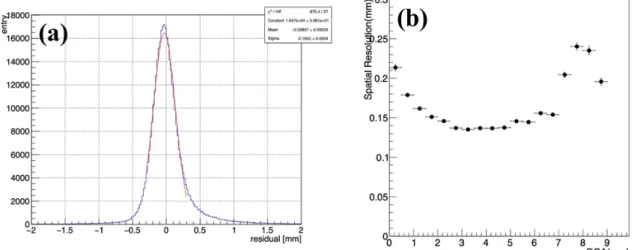
Tracks are reconstracted by applying straight line fitting. Figure 8 (a) shows a distribution of the residuals between the drift distances and the distances of closest approach (DCA) of the recon-structed tracks to the activated wires. The spatial resolution is extracted from this distribution and its dependence on DCA is shown in Figure 8 (b). In order to obtain the spatial resolution correctly, the straight line fitting is done excluding the layer of interest. According to the preliminary analysis, the typical spatial resolution and hit efficiency were estimated to be less than 170 µm and higher than 98 %, respectively. The drift velocity was found to be about 2.2 cm/µsec at operation voltage of 1825 V by the time-to-distance calibration. It was validated that the performance of the CDC satisfied the designed values.
5. Software
Various software tools have beed developed for the CDC data analysis and simulations. We have an analysis framework dedicated to the COMET experiment so-called ICEDUST (Integrated COMET Experimental Data User Software Toolkit). This had been mainly used for Monte Carlo simulations. Recently the analysis codes for the real data, including those of the cosmic-ray test, have been mi-grated into the ICEDUST in order to accelerate the analysis efficiently by using common framework among collaborators.
The biggest challenge of the analysis using the COMET Phase-I CDC is the multi-turn track find-ing. It is not easy to estimate the hit position because all wires have stereo angles and then transverse and longitudinal positions are not independent. Therefore, it is difficult to separate the hit patterns of each turn. A variety of track finding algorithms were developped. One is a kind of classical method
Fig. 8. (a) a distribution of residuals between drift distances and DCAs. (b) DCA dependence of the spatial resolution.
based on Hough transform and helix fitting. The other is a powerful technique which scans the track seed utilizing GPGPU. We also considering to adopt Deep Learning for the track reconstruction of the CDC. Having independent options will help to validate the results of analysis. The track finding efficiency and the purity of hit separation of each track are typically about 90% and 90%, respectively, so far.
6. Summary
A Cylindrical Drift Chamber was developped and construncted for the COMET Phase-I experi-ment. The test experiment using cosmic-ray was carried out with a part of whole readout system and the basic performances were estimated by data analysis. Next cosmic-ray test will use the full setup of readout and start in December 2019.
References
[1] S. M. Bilenky, S. T. Petcov, and B. Pontecorvo: Phys. Lett. B 67 (1977) 309. [2] S. T. Petcov: Yad. Fiz. 25 (1977) 641 [Sov. J. Nucl. Phys. 25 (1977) 340]. [3] R. Barbieri and L.J. Hall: Phys. Lett. B 338 (1994) 212.
[4] R. Barbieri et al.: Nucl. Phys. B 445 (1995) 219.
[5] K. S. Babu, Cristopher Kolda: Phys. Rev. Lett. 89 (2002) 241802. [6] M. Raidal, A. Santamaria: Phys. Lett. B 421 (1998) 250.
[7] Y. Kuno (COMET Collaboration), Prog. Theor. Exp. Phys. 2013, 022C01 (2013). [8] Garfield simulation tool, https://garfield.web.cern.ch/garfield.
011123-6
JPS Conf. Proc. 33, 011123 (2021)
Proceedings of the 3rd J-PARC Symposium (J-PARC2019) Downloaded from journals.jps.jp by 118.70.52.165 on 06/24/21

![[PDF] Les techniques de référencement sur internet | Cours informatique](data:image/gif;base64,R0lGODlhAQABAIAAAP///wAAACH5BAEAAAAALAAAAAABAAEAAAICRAEAOw==)