Application of Machine Learning to Epileptic
Seizure Onset Detection and Treatment
by
Ali
Hossam Shoeb
Bachelor of Science in Electrical Engineering and Computer Science,
Massachusetts Institute of Technology (2003)
Master of Engineering in Electrical Engineering and Computer
Science, Massachusetts Institute of Technology (2003)
Submitted to the Harvard-MIT Division of Health Sciences and
Technology
in partial fulfillment of the requirements for the degree of
Doctor of Philosophy in Electrical and Medical Engineering
at the
MASSACHUSETTS INSTITUTE OF TECHNOLOGY
September 2009
@
Massachusetts Institute of Technology 2009. All rights reserved.
Author
...
.
...
Harvard-MIT Division of Health Sciences and Technology
-September 10, 2009
Certified
by.
.. ...
..
.
..
.. ...
...
C/
John V. Guttag
Professor of Electrical Engineering and Computer Science
r
--
.
Thesis Supervisor
Accepted by.
....
.
...
...
...
Ram Sasisekharan
Director of Harvard-MIT Division of Health Sciences and Technology
MASS NSl
OF TECHNOLOGY
OCT 0 2 2009
LIBRARIES
Application of Machine Learning to Epileptic Seizure Onset
Detection and Treatment
by
Ali Hossam Shoeb
Submitted to the Harvard-MIT Division of Health Sciences and Technology on September 10, 2009, in partial fulfillment of the
requirements for the degree of
Doctor of Philosophy in Electrical and Medical Engineering
Abstract
Epilepsy is a chronic disorder of the central nervous system that predisposes individ-uals to experiencing recurrent seizures. It affects 3 million Americans and 50 million people world-wide.
A seizure is a transient aberration in the brain's electrical activity that produces disruptive physical symptoms such as a lapse in attention and memory, a sensory hal-lucination, or a whole-body convulsion. Approximately 1 out of every 3 individuals with epilepsy continues to experience frequent seizures despite treatment with multi-ple anti-epileptic drugs. These intractable seizures pose a serious risk of injury, limit the independence and mobility of an individual, and result in both social isolation and economic hardship.
This thesis presents novel technology intended to ease the burden of intractable seizures. At its heart is a method for computerized detection of seizure onset. The method uses machine learning to construct patient-specific classifiers that are capable of rapid, sensitive, and specific detection of seizure onset. The algorithm detects the onset of a seizure through analysis of the brain's electrical activity alone or in concert with other physiologic signals. When trained on 2 or more seizures and tested on 844 hours of continuous scalp EEG from 23 pediatric epilepsy patients, our algorithm detected 96% of 163 test seizures with a median detection delay of 3 seconds and a median false detection rate of 2 false detections per 24 hour period.
In this thesis we also discuss how our detector can be embedded within a low-power, implantable medical device to enable the delivery of just-in-time therapy that has the potential to either eliminate or attenuate the clinical symptoms associated with seizures.
Finally, we report on the in-hospital use of our detector to enable delay-sensitive therapeutic and diagnostic applications. We demonstrate the feasibility of using the algorithm to control the Vagus Nerve Stimulator (an implantable neurostimulator for the treatment of intractable seizures), and to initiate ictal SPECT (a functional neuroimaging modality useful for localizing the cerebral site of origin of a seizure).
Thesis Supervisor: John V. Guttag
Acknowledgments
I am grateful to the individuals that participated in the clinical studies described in this thesis. I would like to thank them for their patience, generosity, and courage. I would like to thank them for teaching me about living with epilepsy, for redefining my understanding of strength, and for encouraging me to continue my research.
Thanks to Drs. Blaise Bourgeois and S. Ted Treves for their mentorship while I conducted ictal SPECT studies at Children's Hospital Boston. Thanks to Jack Connolly and Herman Edwards for teaching me much of what I know about EEG.
Thanks to Dr. Steven Schachter for teaching me how to design clinical studies, and for exposing me to the clinical management of epilepsy. Thanks to Dr. Steven Schachter, Dr. Trudy Pang, and the nurses of the Beth Israel Deaconess Medical Center for making the vagus nerve stimulation studies possible. The prototype system used in these studies could not have been built without the help of Wayne Ryan and Ronald Wiken, and the input of professors Steven Leeb, Jeff Lang, Markus Zahn, and David Perreault.
Thanks to my thesis committee chair, Prof. Tomas Lozano-Perez, for technical insights that improved the performance of the seizure detection algorithm. Thanks also to my thesis reader, Dr. Sydney Cash, for introducing me to the fascinating world of intracranial EEG.
I am grateful to my thesis advisor Prof. John Guttag. John has helped me grow as an engineer, researcher, teacher, and person over the course of my undergraduate and graduate careers at MIT.
Thanks to Dorothy Curtis for helping me surpass the hurdles that often get in the way of a graduate student. Thanks for entertaining endless discussion of drug pumps, sewing machines, 9V batteries, and electromagnets.
Thanks to Zeeshan Syed and Asfandyar Qureshi for being there throughout both my undergraduate and graduate years at MIT. Thanks to Eugene Shih for always encouraging me to do better, and for finding ways to make long days in the lab fun. Thanks to Jenna Wiens and Anima Singh for cheering me on during the last days
of thesis writing, and for saying "you are going to be here forever". Thanks to Alaa Kharbouch, Zahi Karam, Georges Aoude, and Ram Srinivasan for always checking up on me, and for things too many to list. Thanks to James Geraci for being the best TA. Thanks to Thomas Heldt for being an inspiration. Thanks to Naveen Verma for an exciting technical collaboration that taught me so much. Thanks to Deema Arafah for her friendship, and for a memorable and comical discussion about how not to introduce this work.
Contents
1 Introduction
1.1 Epilepsy . . . .
1.2 Seizure Detection Algorithms and Applications . 1.2.1 Applications of Seizure Onset Detection 1.2.2 Applications of Seizure Event Detection
1.2.3 Application Dependant Performance . .
1.3 Why is Seizure Detection Challenging? . . . . .
1.4 Related W ork ...
1.4.1 Scalp EEG Seizure Event Detectors . . . 1.4.2 Scalp EEG Seizure Onset Detectors . . .
1.5 Thesis Contributions ... 1.6 Thesis Outline ...
2 Seizures and the Electroencephalogram 2.1 Epileptic Seizures ...
2.2 Scalp Electroencephalogram . ...
2.2.1 Seizures Within the Scalp Electroencephalogram ... 2.3 Intracranial Electroencephalogram ...
2.3.1 Seizures Within the Intracranial Electroencephalogram .. 2.4 Summary ...
3 Patient-Specific Seizure Onset Detection using the Scalp EEG
3.1 Overview of Binary Classification . ...
27 . . . . 27 . . . . . . 29 . . . . . . 30 . . . . . . 30 . . . . . . 31 . . . . . . 31 . . . . 32 . . . . . . 33 . . . . . . 34 . . . . 35 . . . . 38
3.2 Feature Vector Design . . .
3.2.1 Spectral Features ... 56
3.2.2 Spatial Features ... 60
3.2.3 Time Evolution ... 63
3.3 Feature Vector Classification . . . . 66
3.4 Patient-Specific Detector Architecture . . . . 70
3.5 Instantiating Detector Parameters . ... . 73
3.5.1 EEG Epoch Length: L ... 73
3.5.2 Number of EEG Channels: N ... 74
3.5.3 Number of filters: M ... 74
3.5.4 Number of feature vectors in Xr: W . . . . 74
3.5.5 SVM Parameters: -y, J, and C . . . . 75
3.5.6 Training Parameters: H, K, and S . . . . .. . . . . . 75
4 Scalp EEG Data and Testing Methodology 77 4.1 Scalp EEG Data Set ... 77
4.2 Performance Metrics ... . 78
4.3 Performance Metric Measurement . . . . ... . . . .. 78
5 Performance 81 5.1 Patient-Specific Detector Performance . . . . ... ... . . 81
5.1.1 Latency . . . .. . . . .. . . . 81
5.1.2 Sensitivity ... ... ... . 82
5.1.3 Specificity ... ... ... 82
5.2 Varying Patient-Specific Detector Parameters . . . . .... . 87
5.2.1 Varying the Number of Filters: M . . . . 87
5.2.2 Varying the Number of Feature Vectors in Xr: W . . . . 88
5.2.3 Varying the Number of Training Seizures: K ... 89
5.2.4 Varying Training Time into a Seizure: S . ... .... . 90
5.3 Patient-Specific and Non-specific Seizure Detection .... . .... . . 92
5.3.1 Performance Comparison . . . . 92
5.4 Case Studies . ... 5.4.1 Latency ... 5.4.2 Sensitivity ... 5.4.3 Specificity ...
6 Seizure Onset Detection Using Physiologic Signal Fusion
6.1 Why Use a Second Physiologic Signal? ... 6.2 The Electrocardiogram as a Second Signal ... 6.3 Patient-Specific, EEG-ECG-based Seizure Detection ... 6.4 Case Studies ... .... ... . ... ... .. ... . .. ..
6.4.1 D ata . . . . 6.4.2 Case 1 . . . . 6.4.3 C ase 2 . . . . 6.5 Importance of Patient-Specificity . ...
7 Seizure-Triggered Vagus Nerve Stimulation 7.1 Vagus Nerve Stimulation ...
7.2 Methods ... 7.2.1 System Overview 7.2.2 Study Protocol . 7.3 Case Studies ... 7.3.1 Patient A . . . . 7.3.2 Patient B . . . . 7.3.3 Patient C . ...
8 Seizure-Triggered Single Photon Emission
8.1 SPECT in Epilepsy ... 8.2 M ethods ...
8.2.1 System Overview . ... 8.2.2 Study Procotol ...
8.3 Results of Clinical Evaluation . . . .
Computed Tomography 129 . . . . 129 . . . . 132 . . . . . 132 . . . . 132 . . . . . 134 101 101 102 102 104 104 104 106 111 113 113 115 115 116 117 117 121 125 : : : : : : :
9 Patient-Specific Seizure Onset Detection using iEEG
9.1 Why Detect Seizure Onset Using iEEG? ... 137
9.2 Patient-Specific Detector Architecture ... 138
9.2.1 Cost of Support-Vector Machine Classification . . . 139
9.3 Patient Non-specific Detector Architecture . . . 142
9.4 iEEG Data Set ... 143
9.5 Performance Comparison . . . 143
9.6 Reduced and Non-Reduced Support-Vector Machines . . . 145
9.7 Case Studies . . . .. . . ..... ... . 148
9.7.1 Latency . . . 148
9.7.2 False Detections . . . ... . 149
9.8 Predicting Clinical Seizure Onset . . . 149
9.9 Implementation ... 150
10 Conclusion and Future Work 153 10.1 Goals and Contributions ... .. 153
10.2 Future W ork ... ... . 155
10.2.1 Feature Vector Enhancement . . . 155
10.2.2 Detecting Seizure Cessation . . . 155
10.2.3 Closed-Loop, Non-invasive Brain Stimulation . . . 156 137
List of Figures
2-1 EEG electrodes arrayed symmetrically across the scalp provide a tem-poral and spatial summary of the synchronous firing of tens of millions
of neurons within the brain. ... 41
2-2 Example of 10 seconds of awake EEG interrupted by an eye-blink at 37 seconds. The eye-blink results in a downward deflection on the EEG channels {FP1 - F7, FP1 - F3, FP2 - F4, FP2 - F8}. ... . 42 2-3 Example of 10 seconds of sleep EEG interrupted by 11 Hz oscillations
known as sleep spindles. The sleep spindles are most visible on the channel FP2 - F4 between 8-10 and 12-14 seconds. . ... 43 2-4 Example of 10 seconds of awake EEG interrupted by the rhythmic,
high-frequency activity associated with chewing. The high-frequency activity caused by chewing can be seen on the EEG channels F7 - T7
and F8-T8. ... ... 43
2-5 Example of a seizure within the scalp EEG of Patient A. The seizure, which begins at 1723 seconds, involves flattening of the EEG signal across all channels followed by the appearance of a beta band rhythm
on the channels {F3 - C3, C3 - P3}... 44
2-6 Example of a seizure within the scalp EEG of Patient B. The seizure, which begins at 6313 seconds, involves the appearance of a theta band rhythm on the channels {F7 - T7, T7 - P7}. . ... . 45
2-7 Example of an abnormal discharge within the scalp EEG of Patient
A. The discharge, which occurs between 2884-2892 seconds, involves a repeating pattern of high-amplitude spikes followed by broad waves that can be seen on most EEG channels. . ... . 46 2-8 Example of abnormal rhythmic activity within the scalp EEG of
Pa-tient B. The rhythmic activity, which occurs between 6126-6130 seconds, involves a theta band rhythm on the frontal channels {FP1
-F3,F3 - C3} ... .... ... ... 47
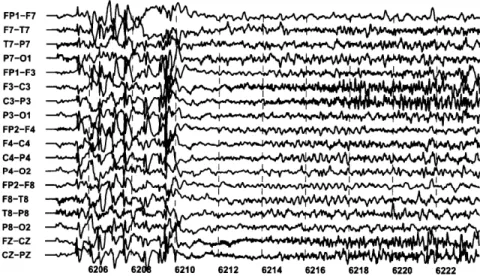
2-9 A second seizure within the scalp EEG of Patient A. The second seizure, which begins at 6210 seconds, resembles the seizure shown in Figure 2-5. ... 47 2-10 A second seizure within the scalp EEG of Patient B. The second
seizure, which begins at 2381 seconds, resembles the seizure shown in Figure 2-6. ... 48 2-11 Example of a seizure within the scalp EEG of Patient C. The seizure,
which begins at 1486 seconds, involves rapid eye-blinking followed by
the appearance of a 3-4 Hz theta wave on the channel T4 - T6. . . . 49
2-12 Example of a seizure recorded from Patient C approximately 10 months after recording the seizure in Figure 2-11. . . . . 49 2-13 Example of seizures within the iEEG of patients D (top panel) and
C (bottom panel). The seizure of Patient D begins at 5 seconds and consists of a few spikes that evolve into a high-amplitude spike train. The seizure of Patient E begins at 5 seconds and consists of a few spikes followed by low-amplitude, high-frequency activity. . ... 51 2-14 The iEEG of Patient F contains rhythmic activity that is associated
with a seizure (top panel) as well as rhythmic activity that is not associated with any clinical symptoms (bottom panel). . ... 52 2-15 Example of two seizures within the iEEG of Patient D. Both seizures
begin at 5 seconds and consist of a few spikes that evolve into a high-amplitude spike train. ... 52
3-1 Example of a seizure whose onset is associated with rhythmic activity that contains a mixture of prominent frequency components. Seizure onset follows 2994 seconds and mostly involves channels on the right side of the head (channels with even numerals). . ... 57 3-2 Frequency spectrum of the channel FP2 - F4 following the onset of the
seizure illustrated in Figure 3-1. The spectrum contains large spectral
components at 2, 5, and 11 Hz. ... 57
3-3 Superposition of the frequency spectra of an eye-blink and the rhyth-mic activity observed on the channel FP2 - F4 following the onset of the seizure in Figure 3-1. The seizure spectrum contains an 11 Hz component that is absent from the spectrum of the eye-blink . . .. 58 3-4 Superposition of the frequency spectra of a sleep spindle and the
rhyth-mic activity observed on the channel FP2 - F4 following the onset of the seizure in Figure 3-1. The seizure spectrum contains low-frequency spectral components that are larger than those in the spindle spectrum. 59 3-5 Superposition of the frequency spectra of chewing and the rhythmic
activity observed on the channel FP2 - F4 following the onset of the seizure in Figure 3-1. The seizure spectrum contains less high-frequency content relative to the chewing spectrum. . ... 59 3-6 M-band filterbank that measures the energy within the spectral
com-ponents of an L second epoch taken from a single EEG channel. . . . 60 3-7 Energy within the frequency bands defined by the rightmost three
fil-ters (thick line) of the filterbank differentiates between the seizure spec-trum (red) and chewing specspec-trum (blue) . ... 61 3-8 The spatial distribution of EEG activity can be used to differentiate
seizure from the non-seizure activity. The sleep spindles between 2989-2992 seconds do no involve activity on the channels C4 - P4 and T8
-P8. In contrast, the seizure activity following 2994 seconds involves
3-9 Formation of an intermediate feature vector XT that captures the
spec-tral and spatial properties of an epoch at time t = T . ... 62 3-10 Scalp EEG seizure involving a sequence of discrete spectral events.
The first event, at 1723 seconds, is a spike involving all EEG channels. Next, all EEG channels exhibit a period of low-amplitude EEG. Finally, at 1725 seconds, a beta band rhythm that increases in amplitude and decreases in frequency appears on the channel F3 - C3. . ... 64 3-11 Spectrogram of Channel F3 - C3 illustrating sequence of events that
compose the onset and evolution of the seizure in Figure 3-10. .... 65
3-12 Spectrogram of channel F3 - C3 illustrating how the feature vector
-models the transition from background to seizure onset. The feature vector XT captures the period of low amplitude activity, XT-2 captures the spike, and XT-4 captures the background EEG activity preceding the spike ... 65 3-13 Spectrogram of channel F3- C3 illustrating how the feature vector 2T
models the evolution of a seizure. The feature vector XT captures the beta band rhythm, XT-2 captures the period of low amplitude activity, and XT-4 captures the spike. ... 66 3-14 Two-dimensional seizure (red) and non-seizure (blue) feature vectors
extracted from a single iEEG channel. The first dimension of this feature space is defined by the energy in the spectral band 0-16 Hz and the second dimension corresponds to the energy in the 25 + 11 Hz band. The seizure vectors extracted from the first 7 seconds of the seizure are numbered 1-5 . .. ... ... . 67 3-15 Linear decision boundary separating seizure (red) and non-seizure (blue)
feature vectors extracted from a single iEEG channel. The decision boundary was determined using the SVM learning algorithm... 68
3-16 Nonlinear decision boundary separating seizure (red) and non-seizure
(blue) feature vectors extracted from a single iEEG channel. The deci-sion boundary was determined using a radial basis kernel and the SVM
learning algorithm. ... 69
3-17 Patient-specific seizure onset detector architecture. . ... . 71
3-18 Generating training non-seizure feature vectors. . ... . 72
3-19 Generating training seizure feature vectors. ... . . . . 73
5-1 Percentage of 163 test seizures detected within a specified latency. The detector notes the onset of 50% of all test seizures within 3 seconds. . 82 5-2 Latency with which the detector notes the onset of seizures for each of the 23 test subjects. Each dot represents a seizure. A numeral is placed next to dots that represent more than one seizure. For most patients, the majority of seizures are detected within 5 seconds. . . . 83
5-3 Example of a seizure within the scalp EEG of Patient 15. The seizure, which begins at 272 seconds, consists of a theta band rhythm that is most prominently seen on the channel T7 - P7. . ... . 83
5-4 Example of another type of seizure observed within the scalp EEG of Patient 15. This seizure, which begins at 876 seconds, consists of a train of spikes on the channel P7 - 01. The detector fails to detect the onset of this seizure since its spectral and spatial characteristics differ from those of training seizures. Training seizures resemble the seizure shown in Figure 5-3. ... 84
5-5 Sensitivity of the patient-specific seizure detector. Red bars show the number of test seizures available for each subject, and black bars show the number of test seizures recognized by the detector. Overall, the detector recognized 96% of 163 test seizures. . ... . 84
5-6 Specificity of the patient-specific seizure detector. For most patients (18 of 23), the detector declares between 0 and 5 false detections per 24 hours ... .. 85
5-7 Example of a seizure within the scalp EEG of Patient 13. The seizure, which begins at 640 seconds, consists of a delta band rhythm that is most prominent on the channel FP1 - F7. . ... . 86 5-8 Example of a short burst of rhythmic activity within the scalp EEG of
Patient 13. The burst, which occurs between 233-235 seconds, consists of a delta band rhythm that is most prominent on the channel FP1 -F7. Since the burst resembles the seizure in Figure 5-7, the detector
declares a false detection following the onset of the burst. ... 86 5-9 False detections declared by the detector are not uniformly distributed
across test records. For Patient 13, 75% of the test records resulted in 0 false detections. For Patient 12, 68% of the test records resulted in
0 false detections ... . ... 87 5-10 The false detection rate of the detector decreases as number of filters
used to construct XT is increased from 2 to 8. A two-filter filterbank yields a false detection rate of 8 false detections per 24 hours. An eight-filter filterbank results in a false detection rate smaller than 4 false detections per 24 hours ... 88 5-11 Increasing the number of feature vectors within X7 decreases the
de-tector's false detection rate and increases its detection delay. To detect seizures with an average latency shorter than 5 seconds one should set
W = 3. . . . .. . 89
5-12 Increasing the number of training seizures decreases the detector's miss rate and its detection delay. Including more than three training seizures results in a marginal improvement in detector's miss rate... 90 5-13 Including seizure vectors derived from the first S > 12 seconds of each
training seizure does not improve seizure detection delay significantly. For S > 12 seconds the detector's mean latency is less than 3 seconds. 91
5-14 Including seizure vectors derived from the first S > 18 seconds of each training seizure does not improve seizure detection rate significantly. For S > 18 seconds the detector recognizes more than 95% of all test
seizures. ... 91
5-15 Increasing S increases the detector's false detection rate. ... . 92
5-16 Comparison of the number of test seizures recognized by the Reveal (sensitive setting) and patient-specific algorithms. Black bars show the number of test seizures available for each subject, red bars show the number of test seizures recognized by the patient-specific algorithm, and blue bars show the number of seizures recognized by the Reveal algorithm. The Reveal algorithm detected 74% of 152 test seizures and our patient-specific method detected 96% of all test seizures. ... 93 5-17 Comparison of the number of false detections declared by the Reveal
(sensitive setting) and patient-specific algorithms. For some patients the Reveal algorithm declared an excess of 100 false detections per 24 hour period . . . . 94 5-18 Comparison of the number of false detections declared by the Reveal
(sensitive setting) and patient-specific algorithms. Expanded y-axis. . 94 5-19 Comparison of the number of test seizures recognized by the Reveal
algorithm (specific setting) and our patient-specific algorithm. Black bars show the number of test seizures available for each subject, red bars show the number of test seizures recognized by the patient-specific algorithm, and blue bars show the number of seizures recognized by the Reveal algorithm. The Reveal algorithm detected 61% of 152 test seizures and our patient-specific method detected 96% of all test seizures. 95 5-20 Comparison of the number of false detections declared by the Reveal
(specific setting) and patient-specific algorithms. For some patients the Reveal algorithm declared an excess of 100 false detections per 24
5-21 Comparison of the number of false detections declared by the Reveal (specific setting) and patient-specific algorithms. Expanded y-axis.. . 96 5-22 Seizure recorded within the scalp EEG of Patient G. The seizure, which
begins at 701 seconds, consists of beta band activity that is most
promi-nent on the channels {F4 - C4, C4 - P4, F8 - T8, T8 - P8}. .... 97
5-23 Large amplitude theta band activity can be seen on all EEG channels twenty-nine seconds after the onset of the seizure shown in Figure 5-22. 98 5-24 Seizure recorded within the scalp EEG of Patient H. The seizure, which
begins at 977 seconds, consists of rapid eye-blinking that is later
ac-companied by theta band activity on the channels {T4 - T6, T6 - 02}
at 983 seconds ... 99 5-25 Seizure recorded within the scalp EEG of Patient J. The onset of this
seizure invovles a generalized spike at 12231 seconds that is followed by generalized rhythmic activity. ... 100 5-26 Rhythmic activity commonly observed within the awake scalp EEG of
Patient J. . . . 100
6-1 Block diagram of patient-specific seizure onset detector that combines features extracted from the EEG and ECG signals. . ... 103 6-2 Example of a seizure within the scalp EEG of Case 1. The seizure,
which begins at 1486 seconds, involves rapid eye-blinking that results in downward deflections on frontal EEG channels (e.g. {FP1-F3, FP2-F4}). Coincident with the onset of rapid eye-blinking, the patient's
heart rate accelerates as shown in Figure 6-3. Later, at 1492 seconds, a 3-4 Hz theta wave appears on the EEG channel T4 - T6. ... 105 6-3 Seizure onset, at 1486 seconds, is associated with an acceleration of
6-4 Comparison of the minimum, maximum, and mean detection delays of two detectors. One detector classifies a feature vector composed solely of EEG features, while the other uses a feature vector that combines EEG and ECG features. The detector that fuses features extracted from the EEG and ECG signals has a shorter mean detection delay. . 107 6-5 Comparison of the false detection rates of two detectors. One detector
classifies a feature vector composed solely of EEG features, while the other uses a feature vector that combines EEG and ECG features. The detector that fuses features extracted from the EEG and ECG signals has a smaller false detection rate. ... 107 6-6 Example of a seizure within the scalp EEG of Case 2. The seizure,
which begins at 56 seconds, involves a 12 second period of low-amplitude EEG activity across most EEG channels. At the same time, the pa-tient's heart rate accelerates as shown in Figure 6-7. Later, at 68 seconds, 1-2 Hz generalized, rhythmic activity develops. ... 108 6-7 Seizure onset, at 56 seconds, is associated with an acceleration of the
patient's heart rate ... ... 109 6-8 Comparison of the minimum, maximum, and mean detection delays of
two detectors. One detector classifies a feature vector composed solely of EEG features, while the other uses a feature vector that combines EEG and ECG features. The two detectors have comparable seizure detection delays. ... 110 6-9 Comparison of the false detection rates of two detectors. One detector
classifies a feature vector composed solely of EEG features, while the other uses a feature vector that combines EEG and ECG features. The detector that fuses features extracted from the EEG and ECG signals has a smaller false detection rate. . ... . 110
7-2 Example of a seizure within the scalp EEG of Patient A. The seizure, which begins at 1486 seconds, involves rapid eye-blinking that results in downward deflections on frontal EEG channels (e.g. {FP1-F3, FP2-F4}). Coincident with the onset of rapid eye-blinking, the patient's
heart rate accelerates as shown in Figure 7-3. Later, at 1492 seconds, a 3-4 Hz theta wave appears on the EEG channel T4 - T6. ... 118 7-3 Seizure onset, at 1486 seconds, is associated with an acceleration of
the patient's heart rate. ... ... .. 119 7-4 Block diagram of patient-specific seizure onset detector that combines
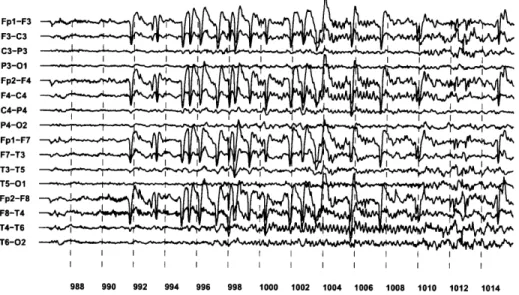
features extracted from the EEG and ECG signals. . ... 120 7-5 Initiation of VNS following computerized detection of the onset of a
seizure from Patient A. Seizure onset begins with rapid eye blinking at 992 seconds. The detector declared seizure onset at 996 seconds, and initiated VNS in response. Beginning at 1002 seconds, a spike-train appears on the "VNS" channel confirming the initiation of vagus nerve stimulation. ... .. ... .. ... . 120 7-6 Seizure onset, at 992 seconds, is associated with an acceleration of the
patient's heart rate. . ... ... 121 7-7 Typical EEG change associated with onset of Patient B's seizure. The
seizure, which begins at 1340 seconds, involves an electrodecrement most prominent on the occipital channels P3 - 01 and P4- 02. Next, at the 1348 seconds, a 3-5 Hz occipital rhythm emerges from the elec-trodecrement and rapidly generalizes. By 1360 seconds, muscle activity associated with the tonic-clonic phase of the seizure becomes visible. . 123 7-8 Block diagram of patient-specific seizure onset detector that uses
7-9 Initiation of VNS following computerized detection of the onset of a seizure from Patient B. The seizure begins with an electrodecrement at 1485 seconds. At 1501 seconds, the computerized system detected the muscle activity associated with the tonic-clonic phase of the seizure and initiated VNS in response. Evidence of VNS generator activity can be seen on the VNS channel at the conclusion of the seizure as shown in Figure 7-10 ... 124 7-10 The spike-train seen on the VNS channel between 1555-1565 seconds
confirms the automatic initiation of vagus nerve stimulation following the onset of the seizure illustrated in Figure 7-9. . ... . 124 7-11 Example of a seizure within the scalp EEG of Patient C. The seizure,
which begins at 248 seconds, involves a 14 second period of low-amplitude EEG activity across most EEG channels. Later, at 262 seconds, gen-eralized, rhythmic activity develops. . ... . 126 7-12 Initiation of VNS following computerized detection of the onset of a
seizure from Patient C. The seizure begins with an electrodecrement at 56 seconds. The computerized system noted seizure activity at 59 seconds and initiated vagus nerve stimulation in response. Evidence of VNS generator activity can be seen on the VNS channel starting at 69 seconds. . ... . . ... .. 127 7-13 The spike-train seen on the VNS channel (first channel from the
bot-tom), between 68-84 seconds, confirms the automatic initiation of va-gus nerve stimulation following the onset of the seizure illustrated in Figure 7-12. ... 127
8-1 SPECT Image taken outside the seizure state (Interictal) and during the seizure state (Ictal I). During a seizure the seizure focus is hyper-perfused and appears as a bright spot in a SPECT Image. The third image (Ictal II) is the result of subtracting the first two images. . . 130
8-2 Delay associated with injecting the ictal SPECT radiotracer ranges be-tween 10-130 seconds for 18 pediatric patients undergoing ictal SPECTs
at Children's Hospital Boston. ... 131
8-3 Block diagram of system for automatic infusion of ictal SPECT
radio-tracer. ... 132
8-4 Protocol for evaluating automatic system for infusion of ictal SPECT radiotracer. See section 8.2.2 for details. . ... . . . . 133
8-5 Comparison of delay between seizure onset and completion of radio-tracer infusion by the clinical team (Group 1) and the computerized
system (Group 2) ... 135
8-6 Latency and number of false detections declared by the computerized system during eight Ictal SPECT studies ... 136
9-1 Block diagram of a patient-specific seizure detection algorithm that uses spectral and spatial features extracted from two iEEG channels. 139
9-2 Superposition of a nonlinear SVM boundary requiring Nsv = 50 terms (solid line) and an approximation of that boundary using Msv = 8
terms (dashed line) ... ... ... 142
9-3 Block diagram of patient non-specific seizure detection algorithm. .. 143
9-4 Comparison of the detection latencies of the patient-specific and pa-tient non-specific seizure detectors. The papa-tient-specific detector that used a nonlinear SVM detected seizures within 8.5 ± 5.1 seconds. The same detector using a linear SVM detected seizures within 9.3±4.8 sec-onds. The patient non-specific algorithm (with T=3) detected seizures
9-5 Comparison of the number of false detections declared by the patient-specific and patient non-patient-specific seizure detectors during 40 hours of non-seizure data. The patient-specific detector with a nonlinear SVM declared 19 false detections. The same detector using a linear SVM declared 28 false detections. The patient non-specific detector (with T=3) declared 126 false detections. . ... 145 9-6 Comparison of the number of false detections declared by the
patient-specific and patient non-patient-specific seizure detectors during 40 hours of non-seizure data. The patient-specific detector with a nonlinear SVM declared 19 false detections. The same detector using a linear SVM declared 28 false detections. The patient non-specific detector (with T=10) declared 17 false detections. . ... 146 9-7 Comparison of the detection latencies of the patient-specific and
pa-tient non-specific seizure detectors. The papa-tient-specific detector that used a nonlinear SVM detected seizures within 8.5 ± 5.1 seconds. The same detector using a linear SVM detected seizures within 9.3 ± 4.8 seconds. The patient non-specific algorithm (with T=10) detected seizures within 18.7 ± 10.8 seconds. . ... 146 9-8 Comparison of latency of detectors that use support-vector machines
with different number of support-vectors . ... 147 9-9 Comparison of number of false detections declared by detectors that
use support-vector machines with different number of support-vectors 147 9-10 Example of a seizure within the iEEG of Patient 6. The seizure, which
begins at 2 seconds, consists of a few spikes that evolve into a high-amplitude spike train. The patient-specific detector recognized the seizure at 16 seconds, while the patient non-specific detector did so at
40 seconds. ... 148
9-11 Example of a seizure within the iEEG of Patient 5. The seizure, which begins at 6 seconds, consists of a high-frequency rhythm that increases in amplitude and decreases in frequency as the seizure progresses. . . 149
9-12 Example of a burst of rhythmic non-seizure activity within the iEEG of Patient 5. The patient non-specific detector declared this burst as a seizure event even though its spatial and spectral character differs significantly from that of the seizure shown in Figure 9-11. ... 150 9-13 Detection delay relative to the clinical onset of a seizure. An alarm
based on detecting the electrical onset of a seizure using our patient-specific method could provide some patients, such as patients 3 and 6, enough time to prepare for the clinical onset of a seizure. ... 151 9-14 Implementation of our machine-learning based, patient-specific
detec-tor on the hardware described in [2]. An analog front-end processes two iEEG channels, and for each channel, extracts the spectral power within two configurable frequency bands. A digital back-end samples the analog power profile, assembles these samples into a feature vector,
List of Tables
Chapter 1
Introduction
1.1
Epilepsy
Epilepsy is a chronic disorder of the central nervous system that predisposes individ-uals to experiencing recurrent seizures. A seizure is a sudden, transient aberration in the brain's electrical activity that produces disruptive symptoms. These symp-toms range between a lapse in attention, a sensory hallucination, or a whole-body convulsion. In the book "Brainstorms: Epilepsy in Our Words" [49], individuals with epilepsy describe what it is like to have a seizure:
I only experience my seizures as I am falling off to sleep...my symptoms include a shock-like feeling inside my head, a twitch of one or more limbs, a shock that makes the trunk of my body jump.
I experience a combination of deja vu with extreme fear. Nothing I do takes me out of the deja vu...the general feeling is of being in front of an oncoming train with no way to escape.
Epilepsy is not a single disease, but a family of syndromes that share the feature of recurrent seizures. Epilepsy may develop as a result of inheriting a mutation in a molecular mechanism that regulates neuron behavior, migration, or organization. Alternatively, it may develop as a result of brain trauma such as a severe blow to the head, a stroke, a cerebral infection, or a brain malignancy [8].
Fifty million people world-wide are diagnosed with epilepsy. In the United States epilepsy affects 3 million people and is the third most common neurologic disorder after Alzheimer's disease and stroke. In an unfortunate subset of 1.2 million indi-viduals, frequent, unpredictable seizures persist despite treatment by one or multi-ple anti-epileptic drugs. These types of seizures are known as medically intractable seizures.
The worst part of having seizures is knowing that they can happen anytime and even though drugs control mine most of the time they occasionally break through.
Medically intractable seizures severely limit the independence and mobility of an individual and, as a consequence, can result in social isolation and economic hardship. Most concerning is that refractory seizures significantly increase an individual's chance of experiencing burns, lacerations, skull fractures, and even sudden unexpected death
[16, 17].
I knew, also instantaneously, that I must keep this affliction secret, and that this condition and the dark secret of it set me apart from others. I was to live my life feeling this isolation and separation.
The negative influence of uncontrolled seizures extends beyond the individual to affect their family members, friends, and the whole of society. The families and friends of people with epilepsy experience chronic anxiety and rearrange their lives to ensure the safety of their loved one. Society incurs an annual loss of 12.5 billion dollars in health care costs and losses in productivity [6]. There is a need for novel therapies that better control seizures as well as technology that helps both the individual and their family to cope with the consequences of seizures.
Computerized seizure onset detection will enable the engineering of novel ther-apeutic and alerting systems that may ease the burden of intractable seizures. A therapeutic system capable of detecting and reacting to the onset of a seizure could administer a local electrical [60], thermal [47], or neurochemical [69] stimulus that
halts the progression of a seizure prior to the development of clinical symptoms. Moreover, just-in-time, local therapy could relieve patients of the toxic side-effects that accompany systemic administration of multiple anti-epileptic drugs. An alerting system equipped with seizure onset detection could warn the patient of the seizure prior to the development of debilitating symptoms, or could notify a family member so that the consequences of a seizure are limited. Knowledge that a reliable warn-ing will be issued rapidly followwarn-ing seizure onset may restore within individuals the confidence to overcome the limits on life that accompany seizures.
In this thesis, we describe a patient-specific algorithm capable of rapidly detecting seizure onset through analysis of the brain's electrical activity alone or in concert with other physiologic signals. Moreover, we demonstrate the feasibility of using our detector to control the Vagus Nerve Stimulator (an implantable neurostimulator for the treatment of intractable seizures), and to initiate ictal SPECT (a functional neuroimaging modality useful for localizing the cerebral site of origin of a seizure).
In this chapter, we describe different types of seizure detectors and their potential role in diagnosistic, therapeutic, and alerting applications. We also highlight the challenges associated with the computerized detection of seizures using the brain's electrical activity. Finally, we review the methodology and performance of previously published algorithms and highlight how our approach contributes to the field of seizure detection.
1.2
Seizure Detection Algorithms and Applications
A seizure detector can be classified as either a seizure onset detector or as a seizure event detector. The purpose of a seizure onset detector is to recognize that a seizure has started with the shortest possible delay, but not necessarily with the highest possible accuracy. In contrast, the purpose of a seizure event detector is to identify seizures with the greatest possible accuracy, but not necessarily with the shortest de-lay. Seizure onset detectors are suited for applications requiring a rapid response to a seizure, while seizure event detectors are suited for applications requiring an
accu-rate account of seizure activity over a period of time. The following sections present applications of both detector types and discuss how the specifics of an application dictate how to balance detection delay against accuracy of detection.
1.2.1
Applications of Seizure Onset Detection
Computerized seizure onset detection can facilitate the initiation of delay-sensitive di-agnostic, therapeutic, and alerting procedures. Within the realm of diagnosis, seizure onset detection could be used to quickly initiate functional neuroimaging studies de-signed to localize the cerebral origin of a seizure. In this case, rapid initiation is important since the accuracy of such imaging studies diminishes the greater the delay between seizure onset and infusion of the imaging radiotracer [10]. Within the realm of therapy, seizure onset detection could be used to trigger neurostimulators designed to affect the progression of a seizure [60]. In this application, rapid initiation is im-portant since the likelihood of affecting a seizure seems to decrease the longer the delay between the onset of a seizure and the start of stimulation [22]. Finally, within the realm of alerting, seizure onset detection could prompt a patient or care provider to ensure safety or administer a fast-acting anticonvulsant. In this scenario, waiting too long to alert the patient or care provider increases the chances that symptoms of the seizure will leave them unable to respond.
1.2.2
Applications of Seizure Event Detection
Computerized seizure event detectors can enable physicians to better titrate therapy (pharmacologic or otherwise) over time. Currently, anti-seizure therapy is dispensed based on a individual's account of the number of and severity of the seizures they experienced between clinic visits. Unfortunately, too many patients produce an inac-curate tally [24], which may lead a physician to prescribe too much, too little, or the incorrect medication. Prescribing too much medication results in toxic side-effects while prescribing too little means a continuation of frequent seizures. A wearable device capable of computerized seizure event detection within the ambulatory setting
could provide physicians with a summary of the number, frequency, duration and time of day an individual experiences seizures. By correlating this information with different medication regimens a physician could more quickly converge on a treatment plan that maximally benefits the individual.
1.2.3
Application Dependant Performance
For a seizure onset detector the speed with which a seizure is recognized can be increased at the expense of seizure detection accuracy. The degree to which one favors detection speed or accuracy is dictated by the problem to be solved. For instance, an application such as automatically infusing a radiotracer for the purpose of a neuroimaging study requires excellent detection accuracy even if it is at the expense of latency. In contrast, applications such as automatically initiating neurostimulation call for emphasizing detection speed over accuracy because of the benign effect of delivering many types of neurostimulation outside of the seizure state [60].
1.3
Why is Seizure Detection Challenging?
Seizure onset and event detection is most often accomplished through analysis of the Electroencephalogram (EEG). The EEG is a multichannel recording of the electrical activity generated by collections of neurons within the brain; different channels reflect the activity within different brain regions. When the EEG is measured using non-invasive electrodes arrayed on an individual's scalp it is referred to as scalp EEG; and when it is measured using electrodes placed on the surface of the brain or within its depths it is referred to as intracranial EEG.
The property of scalp and intracranial EEG that most complicates the seizure detection task is its variability across individuals with epilepsy [18], both in the seizure and non-seizure states. Typically, following the onset of a seizure, a set of EEG channels develops rhythmic activity that reflects underlying neuronal hypersynchrony. Both the location of the involved EEG channels as well as the spectral content of the rhythmic activity varies across individuals. Furthermore, the EEG signature of one
patient's seizure may closely resemble the signature of abnormal, non-seizure EEG gathered from the same patient or from a different patient [46].
Within the scalp EEG the seizure detection task is further complicated by the physical properties of the signal. The scalp EEG is most sensitive to the activity of neurons on the brain surface; consequently, the activity of neurons within deep brain structures has almost no influence on the scalp EEG. When the epileptic neural network is deep within the brain, the scalp EEG may reflect physical sequelae of the seizure, such as repetitive eye-blinks (eye flutter) or muscle contractions, before reflecting hypersynchronous neural activity. Seizures of this type are difficult to detect with high specificity and low latency since activity such as eye flutter and muscle contractions are routinely observed as an individual partakes in the activities of daily life.
Another property of scalp EEG that makes seizure detection challenging is its sus-ceptibility to contamination by non-physiologic sources. The sway of EEG electrode cables, alterations in the electrode-skin interface, and the coupling of AC harmonics from electric machinery can all produce spectral changes that affect the performance of a seizure detector.
1.4
Related Work
Research into seizure detection methods began with the development of seizure event detectors [18]. The detectors developed were meant to detect the seizures of any indi-vidual with epilepsy, i.e., they were patient non-specific. The variability within EEG, along with the challenges discussed in Section 1.3, severely limited the detection ac-curacy of these patient non-specific detectors. To improve performance, investigators developed patient-specific event detectors, i.e., detectors that could be tailored to the EEG of an individual [44]. These detectors exhibited improved performance because seizure and non-seizure EEG recorded from an individual exhibits less variability as shown in Chapter 3. Years later, the development of diagnostic and therapeutic ap-plications that require initiation following seizure onset motivated the development
of seizure onset detection algorithms.
1.4.1
Scalp EEG Seizure Event Detectors
One of the earliest patient non-specific seizure event detectors was the one developed
by Gotman [18] in 1982. The Gotman algorithm searches for the hallmark sign of
seizures: sustained rhythmic activity. The algorithm sequentially searches a number of EEG channels for the presence of rhythmic activity with a dominant frequency between 3-20 Hz and an amplitude at least 3 times greater than that of a background window; whenever the degree of rhythmicity exceeds a threshold on at least two channels and persists for 4 seconds a seizure is declared.
The Gotman algorithm successfully detects seizures whose evolution includes sus-tained rhythmic activity with a fundamental below 20 Hz; it is not successful in detecting seizures consisting of EEG containing a mixture of frequencies or those with low amplitude high frequency activity. Since the scalp EEG of individuals with epilepsy contains pathologic, normal, and artifact-induced bursts of rhythmic activ-ity, a significant fraction of detections produced by the Gotman algorithm are not associated with seizures [18]. A recent evaluation of the Gotman algorithm on 652 hours of scalp EEG that included 126 seizures from 28 patients [48] demonstrated that this approach detects 50% of test seizures and declares 0.5 false detections per hour.
Since Gotman's work, investigators have developed seizure event detectors that utilize more sophisticated signal processing to characterize the rhythmicity associated with seizures as well as more sophisticated schemes for determining whether that activity is representative of an ongoing seizure. An example of such efforts is the Reveal seizure detector developed by Wilson [64]. The Reveal algorithm decomposes 2 second EEG epochs from each input channel into time-frequency atoms using the Matching Pursuit algorithm. Reveal then employs hand-coded and neural network rules to determine whether features derived from the atoms of a channel are consistent with a seizure taking place on that channel. The thresholds for some of the neural network rules are determined using both archetypal seizures from individuals with
epilepsy and background EEG from individuals without epilepsy.
In [64] Wilson reported that the Reveal algorithm detected 76% of 672 seizures gathered from 426 individuals with epilepsy, and that it declared false detections at a rate of 0.11 false detections per hour when tested on data from individuals without epilepsy. When the Reveal algorithm is made patient-specific [65, 66], they reported that it improved the specificity of the original algorithm from 0.62 false-detection per hour to 0.34 false detections per hour while improving the sensitivity to 78%. The Reveal algorithm has a sensitivity superior to that of the classic Gotman algorithm, but as we show in Chapter 3, it has poor specificity when processing the scalp EEG of patients with abnormal, non-seizure rhythmic activity.
1.4.2
Scalp EEG Seizure Onset Detectors
Saab developed a patient non-specific seizure onset detector [48]. Saab's algorithm uses features derived from a wavelet decomposition of each EEG channel to estimate the probability of a seizure event. Whenever the probability exceeds a user defined threshold for a given period of time, the algorithm declares the onset of a seizure. When evaluated on 652 hours of scalp EEG that included 126 seizures from 28 pa-tients, Saab's algorithm detected 78% of seizures with a median detection latency of 9.8 seconds and a false detection rate of 0.86 false detections per hour. Saab reported that missed seizures included those with onsets characterized by focal activity, mixed frequencies, or short duration; and that false detections were mainly caused by short bursts of rhythmic activity, rapid eye blinking, and chewing.
Qu developed the first patient-specific seizure onset detection algorithm [43, 44, 45, 46]. Qu's patient-specific algorithm relies on a nearest-neighbor classifier to assign a list of features, or feature vector, to the seizure or non-seizure class. The classifier is trained on seizure and non-seizure feature vectors from a single individual. The fea-ture vector consists of measures of the EEG's average amplitude, dominant frequency, and rhythmicity. The classifier sequentially classifies feature vectors derived from the available EEG channels, and declares a seizure if the set of positively classified chan-nels matches half of those chosen by an expert. When tested by Qu on 29.7 hours and
47 seizures from 12 patients, the method detected 100% of seizures with an average delay of 9.35 seconds and a false alarm rate of 0.03 false detections per hour. The non-seizure EEG that Qu used to calculate the false detection rate of his algorithm was formed by concatenating segments of EEG extracted at regular intervals from several days of data. When compared to Saab's work, Qu's work illustrates that a patient-specific approach can result in improved sensitivity and specificity, but not
necessarily an improvement in detection latency.
Meier developed a seizure onset detection system that is patient non-specific but is seizure-specific [35]. Meier grouped seizures in a database into 6 categories based on the frequency of the dominant rhythm that appears following seizure onset. He then trained a set of support-vector machines, one for each seizure type, to determine whether a feature vector extracted from an EEG epoch is consistent with one of the seizure types. Rather than extract and then classify feature vectors from one channel after another, Meier extracts a single feature vector that includes the average, across channels, of signal properties such as the number of zero-crossings, wavelet coefficient power, and cross-correlation. When evaluated on 91 seizures and 1,360 hours of non-seizure EEG from 57 patients, Meier's algorithm detected 96% of the test non-seizures with an average detection delay of 1.6 seconds and false alarm rate of 0.45 false detections per hour. Meier's approach depends on the test seizure being a member of one of the 6 defined categories as well as it being recorded using the same number and position of channels used to record the training seizures. Seizures whose onsets lack the development of rhythmic activity and instead reflect physical sequelae of the seizure, such as eye-flutter, do not fall within the defined categories; consequently, such seizures will be detected later or not at all.
1.5
Thesis Contributions
In this thesis we develop a patient-specific algorithm for detecting seizure onset that improves technically upon existing methods in the following ways:
patient and tested on 844 hours of continuous scalp EEG from 23 pediatric subjects, our algorithm detected 96% of 163 test seizures with a median de-tection delay of 3 seconds (average 4.6 seconds) and a median false dede-tection rate of 0.07 false detections per hour (average 0.13 false detection per hour). When evaluated on the same data set, the Reveal algorithm [64] detected 61% of seizures with a false detection rate of 1.6 false detections per hour.
Relative to Saab's algorithm [48], our algorithm exhibits a shorter detection delay, a higher seizure detection rate, and a lower false detection rate.
Relative to Qu [46], our detector exhibits a shorter detection delay, comparable seizure detection rate, and a higher false detection rate. Unlike Qu's algorithm, ours does not require an expert to identify relevant EEG channels. Furthermore, to estimate the seizure detection rate of our method, we used a larger data set than that used by Qu (163 seizures from 23 patients vs 47 seizures from 12 patients). We also used all 844 hours of non-seizure EEG in order to reliably estimate the false detection rate of our algorithm. In contrast, Qu tested his algorithm on 29.7 hours of non-seizure EEG formed by concatenating EEG segments extracted at regular intervals from several days of data.
Relative to Meier [35], our detector has a longer detection delay, equal seizure detection rate, and a lower false detection rate. However, unlike Meier's algo-rithm, ours is not restricted to detecting a defined set of seizure types from a particular population of individuals with epilepsy.
It is important to note that each of Saab, Qu, and Meier used different data sets from our own when evaluating the performance of their algorithms. * Uses Multiple Physiologic Signals: Our method can automatically learn
how to use multiple sources of physiologic information to detect seizures when-ever the scalp EEG alone is unreliable. This capability is important for the detection of seizures whose onsets lack the development of rhythmic activity and instead reflect physical sequelae of the seizure such as eye-flutter, muscle contractions, or changes in heart rate. Such seizures are not easily grouped into
the categories defined by Meier [35] and therefore will be detected later or not at all.
* Minimal User Intervention: Our algorithm does not require a user to define the values of key algorithm parameters. In our approach, a user only needs to define the onset of activity associated with a seizure in a set of physiologic signals. The relationships between these signals that distinguish the seizure and non-seizure periods are automatically learned.
* Suitable for Implantable Medical Devices: Our algorithm can be adapted for the detection of seizure onset within intracranial EEG, and can be imple-mented on the low-power hardware of an implantable neurostimulator. When evaluated on 81 hours of intracranial EEG containing 61 seizures and gath-ered from 17 adult subjects, our algorithm detected 60/61 seizures within 9.3 seconds, declared a total of 28 false detections, and consumed 12pA when im-plemented on the hardware in [2]. When evaluated on the same data set and hardware, a patient non-specific algorithm based on [38] detected 41/61 seizures within 18.7 seconds, declared a total of 17 false detections, and consumed 32pA. In this thesis we also discuss the application of our patient-specific algorithm to the following delay-sensitive therapeutic and diagnostic applications:
* Non-invasive Closed-Loop Control of the Vagus Nerve Stimulator: Using our seizure onset detector we designed and clinically evaluated the first non-invasive system that initiates Vagus Nerve Stimulation (VNS) in response to detecting the onset of a seizure using multiple physiologic signals [57]. As an example of the system's capabilities, during an 81 hour clinical test of the system on a patient, the computerized system detected 5/5 seizures and initiated VNS within 5 seconds of the appearance of ictal discharges in the EEG.
* Computerized Initiation of Ictal SPECT Studies: Using our seizure onset
detector we designed and clinically evaluated a system for initiating a functional neuroimaging study following seizure onset. The neuroimaging modality, ictal
SPECT, is used to radiographically localize the cerebral origin of a seizure. Our system could initiate injection of the radiotracer used for ictal SPECT within 19.3 ± 2.3 seconds in 8/8 prospective trials, while the clinical team required 27.7 + 8.5 seconds, and failed to initiate ictal SPECT in one of the trials.
1.6
Thesis Outline
This thesis is organized as follows: In Chapter 2 we provide background material on seizures and both the scalp and intracranial electroencephalograms. Next, in Chapters 3-5, we develop and analyze the performance of a machine-learning based, patient-specific algorithm for the detection of seizure onsets within scalp EEG. In Chapter 6, we illustrate how the detector in Chapter 3 can be extended with information from other physiological signals in order to detect seizures whose onset does not immediately involve the development of rhythmic activity within the scalp EEG.
We then present applications of our seizure detection methodology. In Chapter 7 we illustrate how the methods developed in Chapters 3 and 6 were integrated into a real-time system that initiates vagus nerve stimulation in response to detecting the onset of a seizure. Chapter 8 illustrates how the method developed in Chapter 3 was used in a real-time system that infuses the radiotracer used in ictal SPECT following seizure onset detection. Finally, in Chapter 9, we adapt the feature extraction and classification stages of our detector so that it may be embedded within a low-power, implantable medical device.
Chapter 2
Seizures and the
Electroencephalogram
This chapter reviews the pathophysiology underlying seizures as well as their clin-ical manifestation and categorization. This chapter also reviews properties of the electroencephalogram and the electrographic characteristics of seizures.
2.1
Epileptic Seizures
Neurons are cells within the brain capable of generating, propagating, and process-ing electric signals. Neurons connect to other neurons in order to form functional networks, and the brain can be viewed as a collection of interacting neural networks. The inputs to a neural network can be excitatory or inhibitory. Excitatory inputs promote activity among neurons within a network and inhibitory inputs suppress it
[30].
Epileptic seizures are transient periods involving the hyperactivity and hypersyn-chronization of a large number of neurons within one or more neural networks. These transient states arise because of a perturbation that creates an imbalance favoring the excitation of a neural network over its inhibition. The imbalance may arise because of defects within a neuron, such as an ion channel dysfunction; defects in connections between neurons, such as deficient inhibitory neurotransmitter synthesis; or defects in
neural network organization, such as the formation of aberrant excitatory connections between neurons. Defects within neurons, neuronal connections, or neural network orginization may result from a genetic disorder or from trauma to the central nervous system during life.
Epileptic seizures are broadly classified according to their cerebral site of origin and spread. Focal seizures arise from a localized region of the brain's cortex and have clinical manifestations that reflect that region of the brain. As an example, a focal seizure originating in the temporal lobe, the part of the brain that processes emotions and short-term memory, may result in feelings such as euphoria, fear, and deja vu or hallucinations of taste or smell. Focal seizures may spread to involve other regions of the brain or the entire brain. As an example, a seizure originating in the left motor cortex may result in jerking movements of the right upper extremity. When the seizure spreads to adjacent areas and then the entire brain, whole-body convulsions ensue.
Generalized seizures begin with abnormal electrical activity that appears to
en-compass the entire cerebral cortex. The manifestations of such widespread abnormal electrical activity often includes the loss of consciousness. Motor manifestation of these seizures may include whole-body rigidity and jerking (generalized tonic-clonic seizure) or whole-body loss of muscle tone (atonic seizure). A seizure that begins focally and then generalizes is referred to as a secondarily generalized seizure.
2.2
Scalp Electroencephalogram
The scalp electroencephalogram (scalp EEG) is a non-invasive measure of the elec-trical potentials generated by the activity of tens of millions of neurons within the brain. The scalp EEG is usually measured through electrodes that are symmetrically arrayed on the scalp as shown in Figure 2-1. An EEG signal, or channel, is formed by taking the difference between potentials measured at two electrodes. For exam-ple, the channel FP1 - F7 is formed by taking the difference between the potentials