Zsolt Szucs-Farkas Tamara Strautz Michael A. Patak Luzia Kurmann Peter Vock Sebastian T. Schindera Received: 28 November 2008 Accepted: 21 February 2009 Published online: 31 March 2009 # European Society of Radiology 2009
Is body weight the most appropriate criterion
to select patients eligible for low-dose
pulmonary CT angiography? Analysis
of objective and subjective image quality
at 80 kVp in 100 patients
Abstract The objective of this retro-spective study was to assess image quality with pulmonary CT angiogra-phy (CTA) using 80 kVp and to find anthropomorphic parameters other than body weight (BW) to serve as selection criteria for low-dose CTA. Attenuation in the pulmonary arteries, anteroposterior and lateral diameters, cross-sectional area and soft-tissue thickness of the chest were measured in 100 consecutive patients weighing less than 100 kg with 80 kVp pulmo-nary CTA. Body surface area (BSA) and contrast-to-noise ratios (CNR) were calculated. Three radiologists analyzed arterial enhancement, noise, and image quality. Image parameters between patients grouped by BW (group 1: 0–50 kg; groups 2–6: 51– 100 kg, decadally increasing) were compared. CNR was higher in patients
weighing less than 60 kg than in the BW groups 71–99 kg (P between 0.025 and <0.001). Subjective ranking of enhancement (P=0.165–0.605), noise (P=0.063), and image quality (P=0.079) did not differ significantly across all patient groups. CNR corre-lated moderately strongly with weight (R=−0.585), BSA (R=−0.582), cross-sectional area (R=−0.544), and an-teroposterior diameter of the chest (R=−0.457; P<0.001 all parameters). We conclude that 80 kVp pulmonary CTA permits diagnostic image quality in patients weighing up to 100 kg. Body weight is a suitable criterion to select patients for low-dose pulmona-ry CTA.
Keywords Pulmonary CT
angiography . Radiation exposure . Image quality
Introduction
The use of low tube energy is a very attractive way to reduce patient exposure with CT angiography (CTA), since the attenuation of iodinated contrast media increases at low kVp [1–3]. The method is especially interesting for use with the chest, where the increase in image noise at low kilovoltage is less pronounced due to the low x-ray absorption of the lungs [4]. Clinical studies have already confirmed the practicability of 100 kVp pulmonary CTA protocols to provide a good contrast-to-noise ratio (CNR) and subjective image quality at a reduced radiation dose, as compared to 120 and 140 kVp [5,6]. It has also been shown that the use of 80 kVp offers a further reduction in patient exposure by 40% compared to
100 kVp in patients weighing less than 100 kg [7]. Nevertheless, there is a concern that increasing noise in patients weighing more than 80 kg could deteriorate image quality. Furthermore, other patient measures, such as body mass index (BMI), body surface area (BSA), or transverse chest dimension, could also be eligible parameters to select patients in whom 80 kVp pulmonary CTA delivers diagnos-tic image quality. However, the impact of these parameters on image quality in pulmonary CTA is less known.
Therefore, the aim of our retrospective study was to assess if image quality is sufficient with pulmonary CTA using 80 kVp in patients weighing up to 100 kg and to find the anthropomorphic parameter that best correlates with objective and subjective image quality.
Z. Szucs-Farkas . T. Strautz . M. A. Patak (*) . L. Kurmann . P. Vock . S. T. Schindera Department of Diagnostic,
Interventional and Paediatric Radiology, University Hospital and
University of Berne, Freiburgstrasse 4, Berne 3010, Switzerland e-mail: [email protected] Fax: +41-31-6320570
Materials and methods
Patients
In November 2007, we optimized our routine pulmonary CTA protocol based on scientific evidence [4, 8]. Since then, patients with suspected pulmonary embolism (PE) and weight less than 100 kg have been routinely examined using a tube voltage of 80 kVp, while 100 kVp has been used in patients weighing more than 100 kg or those with other indications than PE. Our electronic database was retrospectively searched for pulmonary CTAs performed between November 2007 and August 2008. Ten percent of patients weighed more than 100 kg and were examined with 100 kV. The last 100 consecutive patients with body weights of less than 100 kg and examined with 80 kVp pulmonary CTA were enrolled in this study. Patient weight and height were recorded in the examination protocol. The indication of pulmonary CTA was based on patient history, clinical examination, elevated level of D-dimers, and/or positive results of duplex sonography of the lower limbs. The institutional review board approved the retrospective study protocol, and informed consent was waived.
Pulmonary CTA protocol
All patients were examined with a 16-row CT system (Somatom Sensation 16, Siemens, Erlangen, Germany), using real-time automatic mAs-modulation (CareDose4D). Parameters of data acquisition (80 kVp tube energy, quality reference mAs of 150, 16×0.75 mm collimation, 0.5 s tube rotation time, and 1.15 pitch) were kept constant. Seventy-five milliliters of commercially available contrast medium (CM) with 300 mgI/mL (iobitridol, Xenetix 300, Guerbet, Aulnay-sous-Bois, France) was administered in an ante-cubital vein through a 20- or 18-gauge canula at a flow-rate of 3 mL/s using a standard injector (Envision CT, Medrad, Pittsburgh, PA). Bolus tracking (Care Bolus, Siemens) was used for optimal timing of the CM in the pulmonary arteries. Image acquisition was started 4 s after reaching the threshold of 100 Hounsfield units (HU) in the main pulmonary artery. Transverse images were reconstructed at 5 and 1 mm using a standard kernel (B30f). Overlapping maximum intensity projections (MIP; 10 mm thick) in the coronal plane were calculated at 2-mm increments on the workstation provided by the manufacturer. These MIP reconstructions are routinely used at our institute to aid in localizing pulmonary emboli. All images were stored in PACS.
Analysis of quantitative image parameters
Quantitative image parameters were analyzed by Z.S.F. and L.K. The anteroposterior (AP) and lateral chest diameter
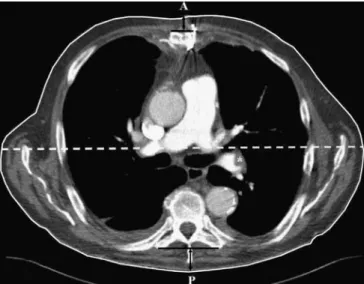
were measured in all patients at the level of the pulmonary trunk. At the same level, the outer margin of the chest was traced manually to obtain the transverse cross-sectional area. The thickness of the soft tissues of the chest wall was measured between the ventral surface of the sternum and skin and from the dorsal skin to the plane of the transverse processes of the thoracic vertebra, usually of Th 6. (Fig.1).
BMI was defined as follows: BMI=weight (kg)/height (m)2. The scaling formula was used to estimate BSA: BSA (m2)=[0.1173×weight (kg)]0.6466[9].
Attenuation was measured in the pulmonary trunk, the left and right pulmonary arteries, the five lobar pulmonary arteries, and the lingular artery (nine arteries) on the 1-mm-thick transverse images by placing circular regions of interest (ROI) in the center of the contrasted vessels
(SIvessel). Each artery was measured in its proximal,
middle, and distal thirds, and the mean of these values was used for further calculations. The ROI size was adapted to the vessel diameter and varied between 80 and 100 mm2in the pulmonary trunk. The attenuation in the peripheral pulmonary arteries was evaluated by reporting the highest window level at which the vessels were just visualized on the monitor using a window width of one. The mean of the window levels obtained with this method in the upper, middle, and lower thirds of the chest was used as the arterial attenuation on the periphery. Values in the central and peripheral arteries were averaged to obtain the
Fig. 1 Transverse CT image (5 mm thick) at the level of the main pulmonary artery demonstrating the morphologic measurements used in the study. The 65-year-old male patient underwent a 80 kVp pulmonary CT angiography with the clinical suspicion of pulmonary embolism. The area enclosed by the white solid line corresponds to the transverse cross-sectional area of the chest. The sum of the distances signaled by the anterior and posterior black vertical arrows equals the soft-tissue thickness of the chest wall. The lateral chest diameter is marked by the white dashed line. The distance between the points A and P represents the anteroposterior chest diameter. The asterisk marks an embolus in the left lower lobe pulmonary artery
mean attenuation of the pulmonary arteries. An attenuation threshold of 300 HU was used as a criterion for optimal vessel enhancement as proposed in the literature [10].
Aortic attenuation was measured in the ascending aorta at the level of the pulmonary trunk. The ratio of the attenuations in the main pulmonary artery and aorta was used to characterize if the imaging was timed correctly. A ratio above 1 was accepted as correct timing, and a ratio below 1, i.e., a higher signal in the aorta compared to the main pulmonary artery, was regarded as a delayed start of the imaging.
Noise was defined as the mean of the standard deviations of the CT numbers measured in three ROIs placed in the pulmonary trunk. Background signal
(SIbackgr) was defined as the average attenuation
mea-sured in the paraspinal muscles at the level of the pulmonary trunk. The signal-to-noise ratio (SNR) and contrast-to-noise ratio (CNR) were calculated separately for the central and peripheral pulmonary arteries as follows: SNR=SIvessel/noise and CNR=(SIvessel−
SIbackgr)/noise.
CT dose index (CTDIvol) was noted for each patient.
The estimated effective dose was calculated by multi-plying CTDIvol by the scan length and the correction
factor of 0.016 mSv/(mGy×cm), which was proposed for our CT scanner at 80 kVp in the chest [11]. By definition, CTDIvol only characterizes absorbed dose
correctly in intermediate patients but not in thin or obese patients. Thus, dose values were not used for comparisons between the weight groups.
Analysis of subjective image quality
Three radiologists (T.S., S.T.S., M.A.P.) with CT experi-ence of 10 months, 4 years, and 10 years, independently evaluated all pulmonary CTA examinations. To standardize the evaluation, five patients not included in the study were read in consensus prior to the qualitative assessment. The observers rated arterial enhancement separately in the main, left, and right pulmonary arteries, in all lobar arteries, and the lingular artery on a five-point scale (1 = bad; 5 = excellent). Image noise was assessed both in the pulmonary arteries and the mediastinum (1 = major, 2 = substantial, 3 = moderate, 4 = minor, 5 = none). Causes of reduced image quality (related to CM flow, bolus timing, obesity, motion, lung pathology, and external metallic artifacts) were recorded. All parameters were separately assessed both on the 1-mm-thick transverse slices and coronal MIP images. Adjustment of window level and width was allowed. The readers also reported the most distal detectable ramification of the pulmonary arteries and the overall image quality on a five-point scale (1 = bad, no diagnosis possible; 2 = poor, diagnostic confidence significantly reduced; 3 = moderate, but sufficient for diagnosis; 4 = good; 5 = excellent).
Both quantitative and qualitative image analyses were performed on high-definition LCD monitors routinely used for reporting CT images (ME355i2, Totoku Electric, Japan).
Statistical analysis of data
Statistical analysis was performed with the Statistica 7 software package (StatSoft, Tulsa, OK) and the MedCalc software (MedCalc, Mariakerke, Belgium). A P value less than 0.05 was considered statistically significant. Patient data and image parameters were tested for normal distri-bution with the Shapiro-Wilk W test. Patients were grouped by body weight into six groups (group 1: 0–50 kg, group 2: 51–60 kg, group 3: 61–70 kg, group 4: 71–80 kg, group 5: 81–90 kg, and group 6: 91–99 kg). The parameters with normal distribution were compared between the groups using the analysis of variance (ANOVA) and post-hoc tests. Non-normally distributed data were analyzed by the Kruskal-Wallis test. Pearson’s r was used to characterize the correlation between continuous variables and Spear-man’s R was applied for the same purpose in nonparame-trical data. The linear regression model was used to describe the relationship between CNR in the pulmonary arteries and subjective image quality and each of the following parameters: weight, BMI, BSA, chest AP diameter, chest cross-sectional area, and soft-tissue thick-ness of the chest wall. The effect of the morphologic parameters on CNR and subjective image quality was analyzed by forward stepwise regression.
The interobserver agreement regarding overall image quality was assessed using Cohen’s kappa statistics.
Results
All morphological patient data were normally distributed (P> 0.05). Age, attenuation in pulmonary arteries, noise, SNR, CNR, and rankings given by the readers showed non-normal distributions (P<0.05). The mean CTDIvol in the
100 patients was 3.59±0.46 mGy corresponding to an estimated effective dose of 1.9±0.29 mSv.
Demographic and morphological patient data
Except for age, all demographic and morphometric patient data were significantly different between patient groups with various weights (Table 1). Comparing the consecutive weight groups yielded a significant differ-ence only between the 51–60 and 61–70 kg groups for BMI (P=0.005), the AP and lateral diameters (P=0.016 and 0.002), and cross-sectional area (P<0.001) of the chest. Weight and BSA were constantly increasing across the groups (P<0.001).
Objective and subjective image quality in different body-weight groups
There was a trend toward lower attenuations in the pulmonary arteries as patient weight increased, but the differences between the weight groups did not reach statistical significance (P=0.089, Table 2). We measured significantly higher noise in patients with body weights above 80 kg compared to those weighing less than 60 kg (Table 3). CNR decreased with increasing body weight, reaching statistical significance for body-weight groups 71–99 kg compared to patients weighing 60 kg or less (P between 0.025 and <0.001; Fig.2).
The readers rated image quality better at higher atten-uation and CNR in the pulmonary arteries (R=0.583 and 0.591; P<0.001). There was no apparent relationship between the subjective image quality and measured image noise (P=0.36).
The subjective grading of enhancement in the separately analyzed arteries (P=0.165–0.605), noise in the vessels (P=0.063), and noise in the mediastinum (P=0.094) yielded no significant difference across the patient groups. The readers could delineate pulmonary arteries virtually to the same level of ramification in all patients (P=0.656). The differences in overall image quality between consecutive patient groups were not significant (P=0.26–1.0). The mean interobserver agreement for overall image quality wasκ=0.40.
Patients with delayed start of CT acquisition and suboptimal enhancement
In 10 patients, the attenuation in the ascending aorta was higher than in the main pulmonary artery due to a delayed
start of CT data acquisition. In these patients, the attenuation in all pulmonary arteries (309.9±78 vs. 429.8±115 HU, P=0.002), CNR (16.7±2.9 vs. 23.6±8.6, P=0.005), subjective vessel enhancement (3.89±0.57 vs. 4.41±0.43, P<0.001), and image quality (3.63±0.53 vs. 4.04±0.53, P=0.023) were significantly lower compared to the other 90 patients. In 5 out of 10 patients (50%), the mean pulmonary arterial attenuation was lower than 300 HU, corresponding to a suboptimal enhancement. In two patients weighing 60 and 74 kg, the mean quality rating by the readers was 2.67 (moderate to poor). Image quality was moderate or better in all other patients.
Attenuation in the pulmonary arteries exceeded 300 HU in all but six patients (6.7%) with correct bolus timing. These six patients had an average weight of 72.7 kg and a BSA of 1.87 m2, which were not different from the rest of the population (P=0.66 and 0.48, respectively).
Effect of anthropomorphic parameters on image quality
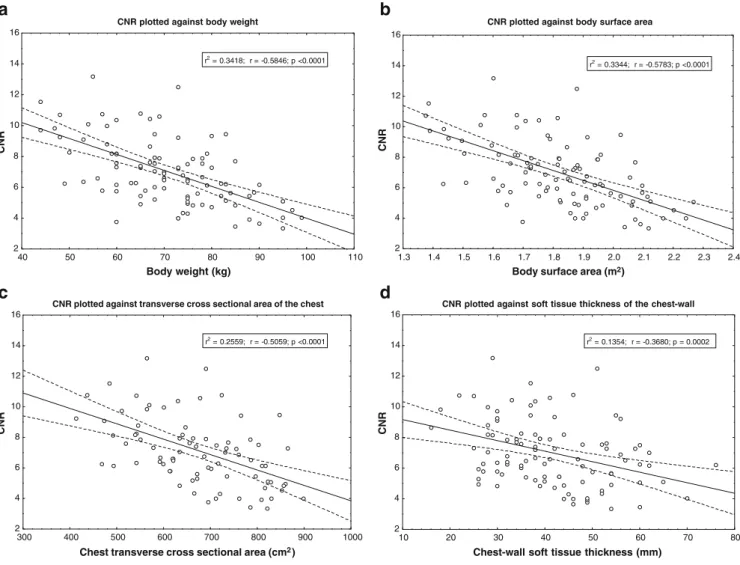
CNR correlated best with weight and BSA and worst with BMI (Table3). The linear regression calculations on CNR yielded moderately high r values for BSA, weight, and transverse area of the chest (Fig.3). Correlations between subjective image quality and morphologic patient data were weak, with the cross-sectional chest area showing the second highest R value after weight (Table4).
From the stepwise regression analysis, body weight showed the largest effect on CNR (beta=−0.60, P<0.001), followed by BSA (beta=−0.59; P<0.001); the beta values for the other morphologic parameters were not significant. The stepwise regression model on the subjective image
Table 1 Descriptive statistics of demographic and morphologic data of 100 consecutive patients examined at 80 kVp pulmonary CTA
All patients Patients grouped by body weight P
0–50 kg 51–60 kg 61–70 kg 71–80 kg 81–90 kg 91–99 kg Number 100 7 20 25 28 14 6 Female/male 51/49 7/0 16/4 11/14 14/14 3/11 0/6 Age (years) 62.3±15.5 57.3±22.4 58.7±20.0 65.1±13.1 63.3±13.6 63.1±14.7 61.0±9.8 0.734 Weight (kg) 70.6±12.7 47.1±2.3 57.3±2.9 67.3±2.1 75.9±2.4 85.5±2.9 96.0±1.7 <0.001 Height (cm) 169.0±9.8 155.3±6.8 164.4±7.3 167.6±8.7 171.0±9.1 176.4±6.0 179.5±9.1 <0.001 BMI (kg/m2) 24.7±3.7 19.7±2.2 21.3±1.5 24.2±2.6 26.2±3.1 27.6±2.0 30.0±2.8 <0.001 BSA (m2) 1.81±0.2 1.43±0.0 1.62±0.1 1.77±0.1 1.90±0.1 2.0±0.1 2.2±0.1 <0.001 Chest AP diameter (cm) 22.9±2.7 20.2±2.7 20.6±1.8 23.1±2.1 23.6±2.7 24.7±1.5 26.0±1.3 <0.001
Chest transverse area (cm2) 693.2±128 522.6±60 557.8±68 696.1±59 730±88 835.4±84 871.8±68 <0.001
Chest soft-tissue thickness (cm) 4.0±1.2 3.0±0.6 3.2±0.7 3.9±1.0 4.3±1.1 5.2±1.3 5.6±0.9 <0.001
Data are means and standard deviations. Parameters describing the transverse chest dimensions were measured at the level of the main pulmonary artery. The last column contains P values from comparing patients grouped by body weight
T able 2 Means and standard deviations of quantitative image parameters and median values along with lower and upper quartiles of mean subjective ratings as g iven by three independent readers All patients Patients grouped by body weight P 0– 50 kg 51 –60 kg 61 –70 kg 71 –80 kg 81 –90 kg 91 –99 kg Objective image parameters Attenuation all P A (HU) 418.5 ± 1 17 482.4 ± 108 448.8 ± 138 459.8 ± 1 17 382.7 ± 104 388.1 ± 9 3 316.3 ± 2 6 0.089 Attenuation aorta (HU) 268.0 ± 84.8 310.7 ± 55.5 303.0 ± 98.0 246.2 ± 104.5 274.7 ± 66.0 241.7 ± 37.7 219.1 ± 81.5 0.064 Noise (HU) 53.1 ± 1 1.2 46.0 ± 9.3 45.9 ± 7.8 56.2 ± 14.1 51.5 ± 7.2 60.1 ± 8.1 63.5 ± 10.9 <0.001 SNR 8.1 ± 2.5 10.6 ± 1.8 10.0 ± 3.3 8.2 ± 1.6 7.5 ± 1.9 6.5 ± 1.6 5.1 ± 0.8 <0.001 CNR 7.1 ± 2.5 9.4 ± 1.7 8.9 ± 3.2 7.3 ± 1.6 6.5 ± 1.9 5.6 ± 1.6 4.3 ± 0.7 <0.001 Subjective image parameters Enhancement all P A axial 4.43 (4.1 1, 4.67) 4.67 (4.44, 4.85) 4.48 (4.1 1, 4.70) 4.52 (4.26, 4.78) 4.20 (3.80, 4.61) 4.35 (4.0, 4.67) 4.37 (3.81, 4.59) 0. 051 Enhancement all P A MIP 4.67 (4.22, 4.78) 4.67 (4.48, 4.89) 4.76 (4.48, 4.95) 4.67 (4.44, 4.81) 4.44 (4.09, 4.67) 4.44 (4.15, 4.67) 4.65 (3.96, 4.93) 0.0 88 Noise P A 3.50 (3.33, 3.67) 4.00 (3.33, 4.0) 3.67 (3.33, 3.67) 3.67 (3.33, 4.0) 3.33 (3.33, 3.67) 3.33 (3.0, 3.67) 3.17 (2.67, 3.67) 0.063 Noise mediastinum 3.0 (2.83, 3.33) 3.33 (3.0, 3.67) 3.0 (3.0, 3.67) 3.33 (3.0, 3.33) 3.0 (3.0, 3.33) 3.0 (2.67, 3.0) 3.67 (2.67, 3.33) 0.094 Ramification 3.83 (3.33, 4.33) 3.67 (3.33, 4.67) 3.83 (3.67, 4.33) 3.95 (3.67, 4.33) 3.83 (3.33, 4.33) 3.67 (3.33, 4.0) 3.50 (3.33, 4.00) 0.656 Overall image quality 4.0 (3.67, 4.33) 4.33 (4.0, 4.67) 4.0 (3.83, 4.50) 4.0 (3.67, 4.33) 3.83 (3.67, 4.0) 3.67 (3.33, 4.67) 4.17 (3.33, 4.33) 0.079 Except for ramification, all ratings were done on a 5-point scale (1 = worst, 5 = best image quality). For all subjective grading, there was no dif ferenc e between the patient groups with dif ferent body weights PA Pulmonary artery ,SNR signal-to-noise ratio, CNR contrast-to-noise ratio, CTDI vol volume CT dose index, MIP maximum intensity projection
quality found no significant beta values for the morpho-logical patient data.
Discussion
In the current series we retrospectively analyzed 100 low-dose pulmonary CTAs using 80 kVp in patients with a body weight of less than 100 kg. The objective and the subjective image qualities were broadly similar in all patients between 50 and 100 kg. We found that body weight is the simplest and most suitable parameter to select patients eligible for low kilovoltage pulmonary CTA.
It is widely accepted that heavy patients need more CM than slim individuals to reach the same vessel enhancement during CTA. In the last 2 years, body weight, BSA, and body fat percentage have all been proposed as factors reflecting blood vessel volume and thus, as the basis to calculate contrast-material dose for CTA [10, 12–14]. Recently, a chest-phantom study, simulating stationary conditions and ignoring effects of dilution or dispersion, presented decreased attenuation of iodinated contrast media with increasing transverse dimension of the phan-tom. The observation was explained by beam hardening and the higher fraction of scattered radiation [8]. Thus, it seems obvious that the cross-sectional dimensions of the examined region should have an effect not only on noise but also on enhancement in patients examined with CTA. Since the aerated lungs represent low attenuation and bone thickness is minimally variable with patient weight in
adults, x-ray absorption of the chest is expected to be attributed mainly to the variable thickness of the soft tissues of the chest wall.
Our findings only verified these assumptions in part. Cross-sectional area showed the strongest correlation with CNR among the parameters describing the transverse chest dimension. However, cross-sectional area is dependent on the position of the breasts in females and its measurement needs a large enough field of view. Furthermore, CNR correlated best with weight, which makes the cumbersome area measurement unnecessary. BSA, which was derived directly from weight and ignored other factors including height, showed a somewhat lower correlation with objec-tive image quality. Therefore, weight seems to be the simplest suitable parameter to select patients in whom low-kVp CTA will yield diagnostic image quality. The corre-lation between vessel enhancement and body surface area and body weight, respectively, was worse than that found by Bae et al. [12] and comparable with the results of other investigators [15,16].
The most important outcome of our study is the verification of good image quality of low-dose pulmonary CTA using 80 kVp in patients weighing up to 100 kg. Our routine pulmonary CTA with a mean effective dose of less than 2 mSv represents a significant reduction in patient exposure compared to the mean dose of 15 mSv (range, 13–40 mSv) of the currently used pulmonary CTA protocols as reported by Mettler et al. [17]. This is only an approximate comparison since we did not include patients with a body weight of more than 100 kg, which, however, corresponded only to 10% of all patients referred to us with Table 3 Detailed list ofP values from comparison of body-weight groups with regard to noise (lower left) and contrast-to-noise ratio (CNR, upper right) Noise CNR CNR 0-50 kg 51-60 kg 61-70 kg 71-80 kg 81-90 kg 91-99 kg 0-50 kg 1.0 0.395 0.025* 0.004* 0.001* 51-60 kg 1.0 0.239 0.003* <0.001* <0.001* 61-70 kg 0.269 0.011* 1.0 0.266 0.036* 71-80 kg 1.0 0.851 1.0 1.0 1.0 1.0 0.397 81-90 kg 0.042* 0.001* 0.135 1.0 91-99 kg 0.031* 0.004* 0.126 1.0 Noise Significant results are marked with asterisks
suspected PE. The fraction of patients ineligible for 80 kVp can be higher in populations with more obese individuals.
Although the mean CNR and subjective image quality decreased at higher body weights, no cut-off value was found above which image quality was moderate or worse. Interestingly, subjective quality correlated with vessel enhancement but not with image noise. Personal commu-nications with the readers revealed that they had adjusted window settings to the high vascular attenuation and thus eliminated the disturbing effect of noise at 80 kVp.
The volume of contrast medium was kept constant in our series and was not adapted to body weight or BSA. It has been shown that the calculation of administered contrast medium based on body weight can optimize vessel enhancement at CTA and reduce iodine load [15,18,19]. However, timing becomes much more crucial if the injection time is very short due to small CM volume. In our experience, the start of image acquisition may be
delayed in thin young adults with good cardiac function, resulting in suboptimal quality and occasionally in the need to repeat the examination. In this group of patients, the time the CT table needs to move from the triggering site to the scanning start position at the lung apex is longer than the duration of the CM plateau phase in the pulmonary arteries. On the other hand, CM volumes in obese patients calculated from body weight may far exceed the optimum, which results in an unnecessary iodine load for the kidneys [12]. If we apply the iodine dose proposed in the literature for 120 kVp pulmonary CTA [10], corresponding to 1.4 mL/kg CM with 300 mgI/mL concentration, we should have used CM volumes between 62 and 139 mL in patients weighing 44–99 kg. In contrast, the use of 80 kVp tube energy and a constant volume of 75 mL CM at a concentration of 300 mgI/ mL and a flow rate of 3 mL/s provided a mean arterial attenuation of more than 300 HU in all but six patients with correct bolus timing. Therefore, low-kVp pulmonary CTA is Fig. 2 Transverse sections (1-mm-thick) at the level of the right
pulmonary artery from low-dose pulmonary CT angiograms using 80 kVp in four patients with different body weights. a A 44-year-old female weighing 44 kg. Body surface area (BSA), 1.36 m2; cross-sectional area of the chest, 485 cm2; soft-tissue thickness of the chest, 3.7 cm; mean attenuation of the pulmonary arteries, 530 Hounsfield units (HU). b A 71-year-old male weighing 65 kg. BSA, 1.74 m2; cross-sectional area of the chest, 734 cm2; soft-tissue
thickness of the chest, 4.2 cm; mean attenuation of the pulmonary arteries, 501 HU. c A 44-year-old female weighing 83 kg. BSA, 2.04 m2; cross-sectional area of the chest, 941 cm2; soft-tissue thickness of the chest, 7.6 cm; mean attenuation of the pulmonary arteries, 452 HU. d A 56-year-male weighing 95 kg. BSA, 2.23 m2;
cross-sectional area of the chest, 1002 cm2; soft-tissue thickness of
the chest, 6.5 cm; mean attenuation of the pulmonary arteries, 344 HU
warranted for routine use not only in younger patients to reduce exposure but also in the elderly with diabetes or impaired renal function to reduce iodine load [4].
We think that our low-dose pulmonary CTA protocol has a potential to be used in pregnant females with suspected PE. Our routine iodine delivery rate of 0.9 gI/s, which ensured a mean attenuation of 418 HU in 100 patients and was entirely sufficient in our collective, can be simply doubled by using 370 mgI/mL CM at a rate of 5 mL/s to counteract the increased cardiac output and plasma volume in pregnancy [20–22]. Furthermore, if we accept that subsegmental emboli do not have an impact on therapeutic decisions, the anatomical range to be covered can be limited from the level of the aortic arch to the right hemidiaphragm. Although the justification of such limited anatomical coverage may be a subject of debate in older standard patients, it would reduce the estimated effective dose of our pulmonary CTA protocol by nearly 50% CNR plotted against body weight
40 50 60 70 80 90 100 110 Body weight (kg) 2 4 6 8 10 12 14 16 CNR r2 = 0.3418; r = -0.5846; p <0.0001
CNR plotted against body surface area
1.3 1.4 1.5 1.6 1.7 1.8 1.9 2.0 2.1 2.2 2.3 2.4
Body surface area (m2)
2 4 6 8 10 12 14 16 CNR r2 = 0.3344; r = -0.5783; p <0.0001
CNR plotted against transverse cross sectional area of the chest
300 400 500 600 700 800 900 1000
Chest transverse cross sectional area (cm2)
2 4 6 8 10 12 14 16 CNR r2 = 0.2559; r = -0.5059; p <0.0001
CNR plotted against soft tissue thickness of the chest-wall
10 20 30 40 50 60 70 80
Chest-wall soft tissue thickness (mm)
2 4 6 8 10 12 14 16 CNR r2 = 0.1354; r = -0.3680; p = 0.0002
a
b
c
d
Fig. 3 Scatterplots showing contrast-to-noise ratio as function of a body weight, b body surface area, c transverse cross-sectional area, and d soft-tissue thickness of the chest wall. Solid lines are the
best-fit linear regression lines, dotted lines are the 95% regression bands. CNR Contrast-to-noise ratio, BSA body surface area
Table 4 Correlation of contrast-to-noise ratio (CNR) and subjective image quality with morphologic parameters of patients (n=100)
CNR Subjective quality ranking R P R P Weight −0.585 <0.001 −0.272 0.006 BMI −0.430 <0.001 −0.235 0.019 BSA −0.582 <0.001 −0.251 0.012 Chest AP diameter −0.457 <0.001 −0.234 0.019 Chest lateral diameter −0.364 <0.001 −0.162 0.116, ns Chest cross-sectional area −0.544 <0.001 −0.260 0.018 Chest soft-tissue thickness −0.394 <0.001 −0.227 0.023 CNR Contrast-to-noise ratio, BMI body mass index, BSA body surface area, AP anteroposterior, ns nonsignificant
to an average of 1 mSv and reduce the secondary irradiation to the fetus, not least by increasing the distance between the inferior margin of the primary radiation and uterus.
There are some limitations of our study. First, we concentrated on the objective and subjective qualitative image criteria for low-dose pulmonary CTA. The evalua-tion of detecevalua-tion rate of emboli was not our goal and thus we did not perform a follow-up of the patients or correlate the images with clinical findings. Second, because of ethical considerations, 80 kVp was not applied in individuals with a body weight exceeding 100 kg, since
phantom measurements had predicted a significant dete-rioration in image quality in these patients. Third, we did not analyze the utility of the low-dose CT protocol for the diseases of the lung parenchyma. The thorough investiga-tion of this issue remains for a further study.
We conclude that pulmonary CTA using 80 kVp and 75 mL of iodinated contrast media provides a good diagnostic image quality in patients weighing up to 100 kg and that weight is an appropriate parameter to select those patients eligible for low-dose pulmonary CTA.
References
1. Kubo T, Lin PJ, Stiller W, Takahashi M, Kauczor HU, Ohno Y, Hatabu H (2008) Radiation dose reduction in chest CT: a review. AJR Am J Roentgenol 190:335–343 2. McCollough CH, Bruesewitz MR,
Kofler JM Jr (2006) CT dose reduction and dose management tools: overview of available options. Radiographics 26:503–512
3. Wintersperger B, Jakobs T, Herzog P, Schaller S, Nikolaou K, Suess C, Weber C, Reiser M, Becker C (2005) Aorto-iliac multidetector-row CT angiography with low kV settings: improved vessel enhancement and simultaneous reduction of radiation dose. Eur Radiol 15:334–341
4. Holmquist F, Nyman U (2006) Eighty-peak kilovoltage 16-channel multide-tector computed tomography and reduced contrast-medium doses tailored to body weight to diagnose pulmonary embolism in azotaemic patients. Eur Radiol 16:1165–1176
5. Heyer CM, Mohr PS, Lemburg SP, Peters SA, Nicolas V (2007) Image quality and radiation exposure at pul-monary CT angiography with 100- or 120-kVp protocol: prospective rando-mized study. Radiology 245:577–583 6. Schueller-Weidekamm C,
Schaefer-Prokop CM, Weber M, Herold CJ, Prokop M (2006) CT angiography of pulmonary arteries to detect pulmonary embolism: improvement of vascular enhancement with low kilovoltage set-tings. Radiology 241:899–907
7. Szucs-Farkas Z, Kurmann L, Strautz T, Patak MA, Vock P, Schindera ST (2008) Patient exposure and image quality of low-dose pulmonary puted tomography angiography: com-parison of 100- and 80-kVp protocols. Invest Radiol 43:871–876
8. Szucs-Farkas Z, Verdun FR, von Allmen G, Mini RL, Vock P (2008) Effect of X-ray tube parameters, iodine concen-tration, and patient size on image quality in pulmonary computed tomography angiography: a chest-phantom-study. Invest Radiol 43:374–381
9. Livingston EH, Lee S (2001) Body surface area prediction in normal-weight and obese patients. Am J Physiol Endocrinol Metab 281:E586– E591
10. Bae KT, Tao C, Gurel S, Hong C, Zhu F, Gebke TA, Milite M, Hildebolt CF (2007) Effect of patient weight and scanning duration on contrast en-hancement during pulmonary multide-tector CT angiography. Radiology 242:582–589
11. Huda W, Ogden KM, Khorasani MR (2008) Converting dose-length product to effective dose at CT. Radiology 248:995–1003
12. Bae KT, Seeck BA, Hildebolt CF, Tao C, Zhu F, Kanematsu M, Woodard PK (2008) Contrast enhancement in car-diovascular MDCT: effect of body weight, height, body surface area, body mass index, and obesity. AJR Am J Roentgenol 190:777–784
13. Kondo H, Kanematsu M, Goshima S, Tomita Y, Miyoshi T, Hatcho A, Moriyama N, Onozuka M, Shiratori Y, Bae KT (2008) Abdominal multidetec-tor CT in patients with varying body fat percentages: estimation of optimal contrast material dose. Radiology 249:872–877
14. Bae KT, Heiken JP, Brink JA (1998) Aortic and hepatic contrast medium enhancement at CT. Part I. Prediction with a computer model. Radiology 207:647–655
15. Roggenland D, Peters SA, Lemburg SP, Holland-Letz T, Nicolas V, Heyer CM (2008) CT angiography in suspected pulmonary embolism: impact of patient characteristics and different venous lines on vessel enhancement and image quality. AJR Am J Roentgenol 190: W351–W359
16. Arakawa H, Kohno T, Hiki T, Kaji Y (2007) CT pulmonary angiography and CT venography: factors associated with vessel enhancement. AJR Am J Roentgenol 189:156–161
17. Mettler FA Jr, Huda W, Yoshizumi TT, Mahesh M (2008) Effective doses in radiology and diagnostic nuclear medi-cine: a catalog. Radiology 248:254–263 18. Fleischmann D (2005) How to design injection protocols for multiple detec-tor-row CT angiography (MDCTA). Eur Radiol 15 Suppl 5:E60–E65 19. Nakaura T, Awai K, Yauaga Y,
Naka-yama Y, Oda S, Hatemura M, Na-gayoshi Y, Ogawa H, Yamashita Y (2008) Contrast injection protocols for coronary computed tomography angi-ography using a 64-detector scanner: comparison between patient weight-adjusted- and fixed iodine-dose proto-cols. Invest Radiol 43:512–519 20. Schaefer-Prokop C, Prokop M (2008)
CTPA for the diagnosis of acute pul-monary embolism during pregnancy. Eur Radiol 18:2705–2708
21. U-King-Im JM, Freeman SJ, Boylan T, Cheow HK (2008) Quality of CT pulmonary angiography for suspected pulmonary embolus in pregnancy. Eur Radiol 18:2709–2715
22. Andreou AK, Curtin JJ, Wilde S, Clark A (2008) Does pregnancy affect vas-cular enhancement in patients under-going CT pulmonary angiography? Eur Radiol 18:2716–2722