ORIGINAL ARTICLE
Reduction of artefacts caused by hip implants in CT-based
attenuation-corrected PET images using 2-D interpolation
of a virtual sinogram on an irregular grid
Mehrsima Abdoli&Johan R. de Jong&Jan Pruim&
Rudi A. J. O. Dierckx&Habib Zaidi
Received: 24 May 2011 / Accepted: 29 July 2011 / Published online: 18 August 2011 # The Author(s) 2011. This article is published with open access at Springerlink.com
Abstract
Purpose Metallic prosthetic replacements, such as hip or knee implants, are known to cause strong streaking artefacts in CT images. These artefacts likely induce over- or underestimation of the activity concentration near the metallic implants when applying CT-based attenuation correction of positron emission tomography (PET) images. Since this degrades the diagnostic quality of the images, metal artefact reduction (MAR) prior to attenuation correction is required.
Methods The proposed MAR method, referred to as virtual sinogram-based technique, replaces the projection bins of the sinogram that are influenced by metallic implants by a 2-D Clough-Tocher cubic interpolation scheme performed in an irregular grid, called Delaunay triangulated grid. To assess the performance of the proposed method, a physical phantom and 30 clinical PET/CT studies including hip prostheses were used. The results were compared to the method implemented on the Siemens Biograph mCT PET/ CT scanner.
Results Both phantom and clinical studies revealed that the proposed method performs equally well as the Siemens
MAR method in the regions corresponding to bright streaking artefacts and the artefact-free regions. However, in regions corresponding to dark streaking artefacts, the Siemens method does not seem to appropriately correct the tracer uptake while the proposed method consistently increased the uptake in the underestimated regions, thus bringing it to the expected level. This observation is corroborated by the experimental phantom study which demonstrates that the proposed method approaches the true activity concentration more closely.
Conclusion The proposed MAR method allows more accurate CT-based attenuation correction of PET images and prevents misinterpretation of tracer uptake, which might be biased owing to the propagation of bright and dark streaking artefacts from CT images to the PET data following the attenuation correction procedure.
Keywords PET/CT . Attenuation correction . Metal artefacts . Virtual sinogram . Delaunay triangulation . Clough-Tocher interpolation
Introduction
The presence of metallic implants in patients undergoing X-ray computed tomography (CT) scans, manifesting itself in the form of dark and bright streak artefacts, is considered to be one of the most important sources of artefacts. Depending on the implant size, these artefacts can degrade image quality in the regions surrounding the metallic object or of the whole image. CT-based attenuation correction of positron emission tomography (PET) images is the standard technique imple-mented on commercial PET/CT systems [1]. Following application of this procedure, metal artefacts can propagate and cause errors in the attenuation-corrected PET images.
M. Abdoli
:
J. R. de Jong:
J. Pruim:
R. A. J. O. Dierckx:
H. ZaidiDepartment of Nuclear Medicine and Molecular Imaging, University Medical Center Groningen, University of Groningen, 9700 RB Groningen, The Netherlands
H. Zaidi (*)
Division of Nuclear Medicine and Molecular Imaging, Geneva University Hospital,
1211 Geneva, Switzerland e-mail: [email protected] H. Zaidi
Geneva Neuroscience Center, Geneva University, 1205 Geneva, Switzerland
The artefactual CT images lead to erroneous attenuation coefficients in some region of the generated attenuation map (μmap). This results in inaccurate quantification of the tracer uptake in the attenuation-corrected PET data in the regions corresponding to the streak artefacts [2–5]. In patients with prosthetic replacements, such as hip or knee metallic implants, severe artefacts usually cause over/underestimation of the activity concentration around the prostheses. Decreased image quality impacting diagnostic accuracy has been also reported in some cases [3,6].
After total hip replacement, local complications most likely take place including infection, mechanical loosening, prosthetic and preprosthetic fractures, etc. The diagnosis of such complications might be influenced by artefacts caused by a metallic hip prosthesis [7–9]. Although moderate or minor CT streak artefacts might not affect the visual quality of the attenuation-corrected PET images [10], it definitely influences the quantitative accuracy to some extent, thus leading to some bias when quantification of physiological or pharmacokinetic processes occurring in the region of interest is desired. To enable accurate quantification of PET data, the reduction of all sources of errors and artefacts, including those generated by metallic implants, is required. The challenging issue of metal artefact reduction (MAR) has been addressed by several approaches which can be generally categorized into sinogram- and image-based methods [11]. Sinogram-based methods manipulate the raw CT data in the sinogram space; linear interpolation of the missing sinogram bins being one of them [12,13]. This approach detects metallic objects using a thresholding technique and then identifies the sinogram bins affected by metallic objects by forward projection of the segmented image. The affected bins are then replaced by linear interpolation of the neighbouring bins of the same projection angle. Cubic spline interpolation of the neigh-bouring bins is another similar method belonging to sinogram-based approaches [14]. Jeong and Ra applied a linear interpolation scheme on the projection data obtained from a metal-free image prepared such that the intensities of metallic regions are replaced by those of non-metallic surrounding pixels [15]. Veldkamp et al. performed metal object segmentation in sinogram space using a Markov random field model and replaced the corresponding values using different interpolation schemes [16]. One-dimensional spline interpolation of the projec-tion bins of a virtual sinogram is another sinogram-based MAR technique [17].
Image-based methods are directly applied to the recon-structed image. Iterative deblurring methods [18], wavelet-based techniques [19, 20], knowledge-based approaches [21] and pattern recognition-based methods [4] are exam-ples belonging to this category. The main complication associated with this category of methods is the fuzziness of
CT numbers in the artefactual regions and the surrounding tissues, which makes the metallic object and the surround-ing tissues undistsurround-inguishable and might result in lower performance.
Despite the fact that the sinogram-based methods usually result in more accurate correction [22], the practical implementation of such techniques is challenging owing to the encrypted proprietary format, manufacturer depen-dency and large size of the raw CT data. The advantage of our proposed MAR method is that it utilizes a virtual sinogram as an alternative to overcome the above-mentioned drawbacks. It must be emphasized, however, that the smooth pattern of the sinogram has to be preserved after correction since smoothness is an inherent property of sinograms and any discontinuity and roughness can introduce extra artefacts in the reconstructed image. Therefore, the correction method has to be chosen cautiously so that the smoothness and continuity criterion will be met.
The purpose of this study is to develop a novel MAR approach by generating a smooth and continuous virtual sinogram. Since metallic hip prostheses are known to produce severe streaking artefacts and non-negligible activity concentration bias [3], the main focus of the proposed method is on reducing metallic artefacts associated with metal hip implants.
Materials and methods Metal artefact reduction
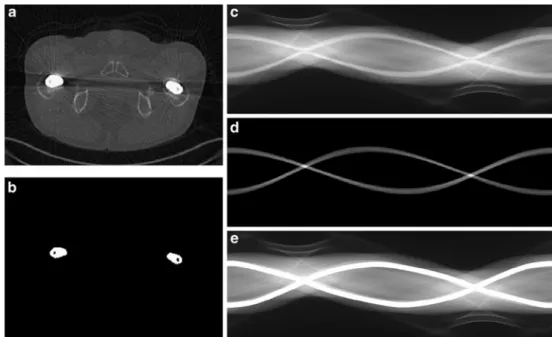
The various steps involved in the implementation of the MAR algorithm are shown in Fig. 1. In this method, the virtual sinogram is obtained by forward projection of the reconstructed CT image (Fig. 1c). The scanner geometry and the projection parameters are defined according to the actual CT scanner specifications and parameters. The projection bins affected by the metallic objects are detected as described below.
Detection of projection bins affected by metallic objects
In order to detect the projection bins affected by metallic objects in the virtual sinogram, the metals are segmented in the original CT image. Since the HU of metallic objects are much higher than that of biological tissues including bone, they can be detected using a thresholding technique (Fig. 1b). Although this simple approach might introduce errors by misclassification of pixels containing very strong artefacts, its negligible impact on the final corrected image suggests that there is no need for a more sophisticated segmentation technique [23].
Forward projection of the segmented image will give the position of the affected projection bins: the bins having a value greater than zero represent the location of the affected projection data (Fig. 1d). The next step consists in the replacement of the corrupted value of the projection data by a more accurate value. As mentioned earlier, the replace-ment procedure must result in a smooth and continuous sinogram. Hence, utilizing a 2-D interpolation scheme would be superior to the 1-D techniques. Since some pixels of the sinogram grid corresponding to the affected projection bins are removed by the MAR procedure, the regular data become scattered (Fig. 1e). Considering the fact that general 2-D cubic interpolation techniques require a regular grid, an irregular cubic interpolation-compatible grid had to be defined in the sinogram domain to render cubic interpolation of the scattered data feasible. We used the Delaunay triangulation gridding technique, which is further explained in the following subsection.
Delaunay triangulation
Delaunay triangulation was proposed in 1934 [24] and was used in many mathematical applications. We assume that there is a set, V, representing a set of N≥3 points in the Euclidean plane, and that these points are not collinear and any four points are not co-circular. The Delaunay triangu-lation of this set, DT(V), divides the plane into triangles with vertices located on the points, which intersect in a common side. Delaunay triangulation has the property that the circumcircle of the triangles are empty, i.e. they contain no point of V in their interior (Fig.2). To ensure that none of the points is inside the circumcircle of one triangle, an incircle test is applied to four distinct points. Consider the points A, B, C and D in Fig. 3. If A, B and C define a
counterclockwise-oriented triangle, point D will be inside the circumcircle of the triangle ABC if the following condition is met: xA yA x2Aþ y2A 1 xB yB x2Bþ y2B 1 xC yC x2Cþ y2C 1 xD yD x2Dþ y2D 1 > 0: The proof can be found in [25].
After defining an irregular grid on the data points of the sinogram matrix which are not affected by metallic objects, we need to use an interpolation technique.
Fig. 2 Example of Delaunay triangulation. Note that none of the points is inside the circumcircle of all triangles
Fig. 1 Detection of
projections affected by metallic artefacts: a original CT image, b segmented image using thresholding, c original sinogram, d metal-only sinogram and e scattered data
Clough-Tocher interpolation
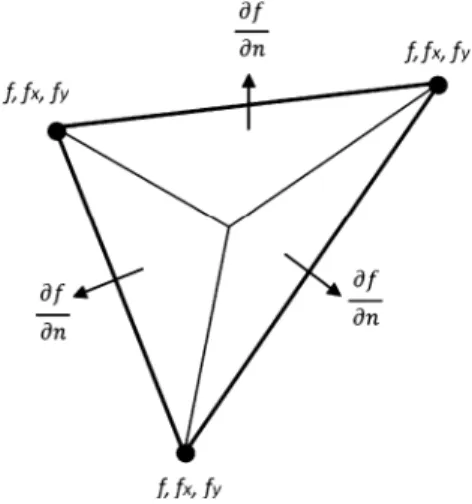
This specific interpolation technique was developed by Clough and Tocher in 1965 [26]. It can be applied on each triangle in a triangulated grid to generate a surface over the entire domain. First, each triangle is divided into three sub-triangles by joining each vertex to the centroid of the triangle. An interpolating cubic polynomial is then con-structed on each sub-triangle to enable a smooth interpolant over the entire triangle. Twelve parameters (called nodal values) are required to define such cubic polynomials on the sub-triangles (Fig. 4). These parameters include the function value at each vertex, first derivative of the function with respect to x and y at each vertex, and normal derivative at each midpoint of each side of the triangle. The basis of the interpolant will be defined by 12 cubic polynomial cardinal functions in each sub-triangle. To evaluate the interpolant value at each point, the 12 cardinal functions of the corresponding sub-triangle have to be determined first. Thereafter, each function value will be multiplied by the
corresponding nodal value and the results added up to obtain the final value of the target point [27].
This method can be conveniently applied to our Delaunay triangulated sinogram grid to obtain a smooth and continuous interpolated surface over the projection bins associated with the affected bins. It was implemented using a MATLAB toolbox routine. Once the corrected sinogram is obtained, it is reconstructed using a MATLAB routine filtered backward projection algorithm to generate the corrected CT images.
Phantom experiment
A phantom experiment was performed using a 20-cm diameter cylinder uniformly filled with 37 MBq of 18F to evaluate the performance of the proposed method. Two metallic cardiac pacemakers were inserted into the phantom to produce streaking artefacts (Fig. 5). The black arrows indicate the location of metallic objects. The phantom was scanned on the Biograph Hi-Rez TP 64-slice PET/CT scanner (Siemens Medical Solutions, Erlangen, Germany). A low-dose CT scan was acquired using the following protocol: 120 kVp, 65 mAs, 24×1.2 collimation and a pitch of 0.45:1. The PET scan was performed immediately after the CT scan for 20 min in one bed position. PET data were reconstructed using the 2-D ordered subsets expectation maximization iterative algorithm with the following parame-ters: 6 iterations, 8 subsets, zoom of 2 and a post-processing Gaussian smoothing with full-width at half-maximum (FWHM) of 5.0 mm.
Clinical studies
Thirty clinical PET/CT studies of patients with metal hip prostheses (in one or both sides) performed on a Biograph mCT 64-slice scanner (Siemens Medical Solutions, Erlangen, Germany) were used in this study. Patients were injected with
Fig. 5 Photograph of the cylindrical phantom used in the experimental study. The black arrows show the metallic inserts used to generate streaking artefacts
Fig. 4 The 12 parameters used in the Clough-Tocher cubic interpolation scheme
5 MBq/kg of18F-fluorodeoxyglucose (FDG) after a 4-h fast and were scanned according to the routine protocol. The PET scan was performed around 60 min after injection. Scanning time per bed position was correlated with patient’s weight: 1 min per bed position for patients below 60 kg, 2 min per bed position for patients between 60 and 100 kg and 3 min per bed position for patients above 100 kg. CT data are acquired under the following parameters: 100 kVp, 30 mAs (using CARE Dose4D automatic tube current modulation), 16×1.2 colli-mation and a pitch of 1.5. Time-of-flight PET data were reconstructed using the Siemens Ultra-HD algorithm using 3 iterations and 21 subsets, a zoom of 1 and a post-processing Gaussian kernel with FWHM of 5.0 mm.
Assessment strategy
For each patient, five slices containing metallic artefacts were used for data analysis. In each slice nine identical circular regions of interest (ROIs) having a diameter of 10 mm were manually defined on PET images, three of which were located on regions corresponding to the bright streaking artefacts, three on those corresponding to dark streaks and three on artefact-free regions (45 ROIs in total for each patient). The results of the proposed MAR method were also compared to the results obtained using the Siemens built-in MAR algorithm. The latter is an image-based MAR technique referred to as a knowledge-image-based method developed originally for cardiac metallic pace-makers [21]. In this image-based method, the bright and
dark artefacts are detected using thresholding techniques followed by morphological operations. Uniform values are then assigned to bright and dark streaking artefact regions to reduce the over- and/or underestimation of tracer uptake in the attenuation-corrected PET data.
The results were analysed using Bland-Altman plots to illustrate the changes made on regions corresponding to bright and dark artefacts, as well as artefact-free regions. Mean relative differences between the tracer uptake in the uncorrected and corrected PET images were also calculated for the same regions. For the phantom study, the uncorrect-ed and correctuncorrect-ed images using both MAR techniques were also compared to the actual activity concentration within the phantom, serving as reference.
Results
PET images of the uniform cylindrical phantom corrected for attenuation using uncorrected and corrected CT images using the proposed and Siemens MAR methods are shown in Fig.6. Since the MAR procedure is an intermediary step for PET image reconstruction and the Siemens software does not provide the user with this intermediary data, only uncorrected and corrected CT using the proposed MAR are illustrated in this figure. The strong streaking artefacts are reduced after applying the proposed MAR method as shown in Fig. 6b. However, the correction procedure introduces additional streaks to the corrected CT image
Fig. 6 PET/CT images of the experimental phantom study showing uncorrected (a) and corrected (b) CT images using the proposed MAR method. CT-based attenuation-corrected PET images using uncorrected (c) and corrected CT images obtained using the proposed MAR approach (d) and Siemens MAR technique (e)
owing to the fact that the modification of one projection bin in the sinogram space would influence one line of response in the reconstructed image. Since the interpolation scheme unlikely achieves the exact actual value of the projection bins, a slight deviation in the intensities of the reconstructed images is expected. As can be seen in Fig. 6c, the bright and dark streaking artefacts in the CT image have caused overestimation and underestimation of the activity concen-tration in the corresponding attenuation-corrected PET image. The proposed technique improves the visual quality of PET images and reduces to a great extent the errors in both overestimated and underestimated regions (Fig. 6d). The Siemens method successfully decreases the activity concentration in the overestimated regions, while the activity concentration remains almost similar to the uncorrected image in the underestimated regions.
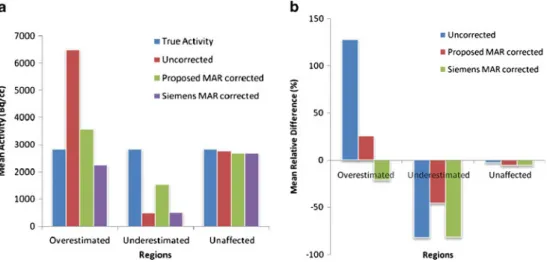
Figure7acompares the mean activity concentration of 45 ROIs defined on overestimated, underestimated and unaffected regions of PET images (15 on each region) with the actual activity concentration inside the phan-tom. Figure 7b shows the mean relative difference between the estimated and actual activity concentration in the defined regions. Both graphs confirm that the proposed method approaches the actual value in all regions, while the Siemens method overcorrects the activity concentration in the overestimated regions, result-ing in corrected values less than the actual value. Moreover, it does not correct for the underestimated regions. In the unaffected regions, both methods yield values close to the actual value.
Figures8and9show representative CT and PET images of two clinical PET/CT studies. It can be seen that the proposed method suppresses the streaking artefacts in the
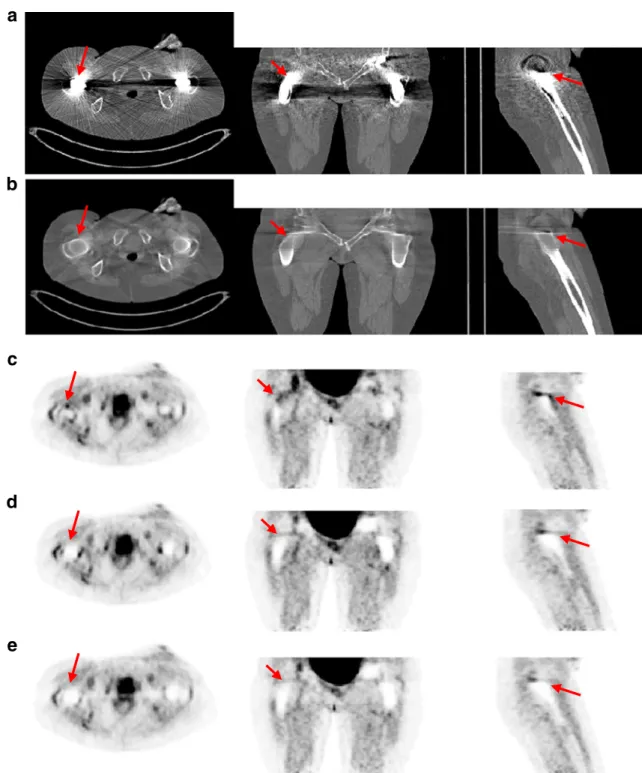
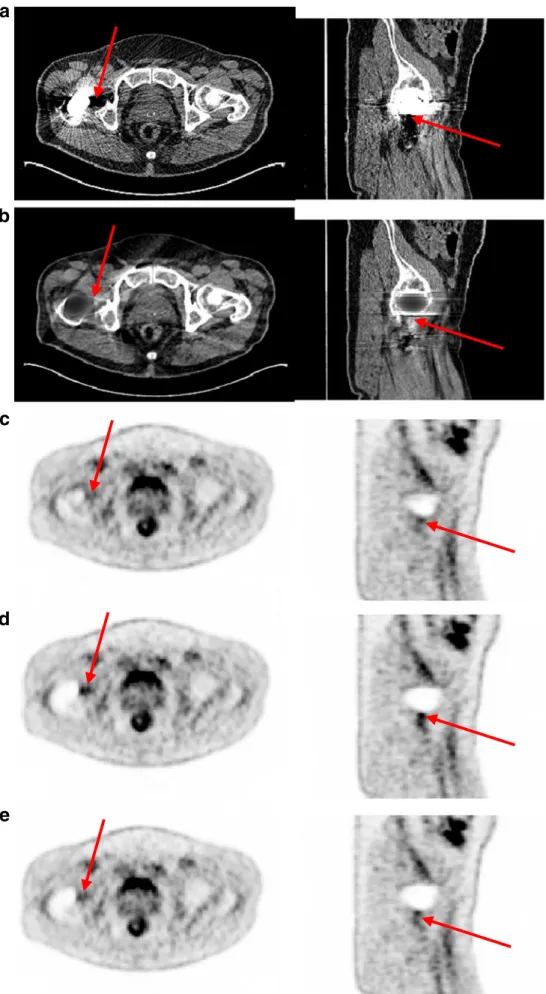
CT images. The arrows in Fig.8aindicate a bright streaking artefact region in the uncorrected CT image, which results in an overestimation of the tracer uptake in the corresponding attenuation-corrected PET data (Fig. 8c). This high uptake disappears owing to the reduction of the streaking artefacts after correction using the proposed MAR algorithm (Fig. 8d). The Siemens technique also corrects for this artefact reasonably well as can be seen in Fig. 8e. Figure9shows the influence of the proposed method on the underestimated regions where the arrows indicate the dark streaking artefact region on the CT image. In this case, the corrected PET image using the proposed MAR technique presents higher uptake (Fig. 9d), whereas the Siemens method keeps the uptake almost unchanged compared to the uncorrected image (Fig.9e).
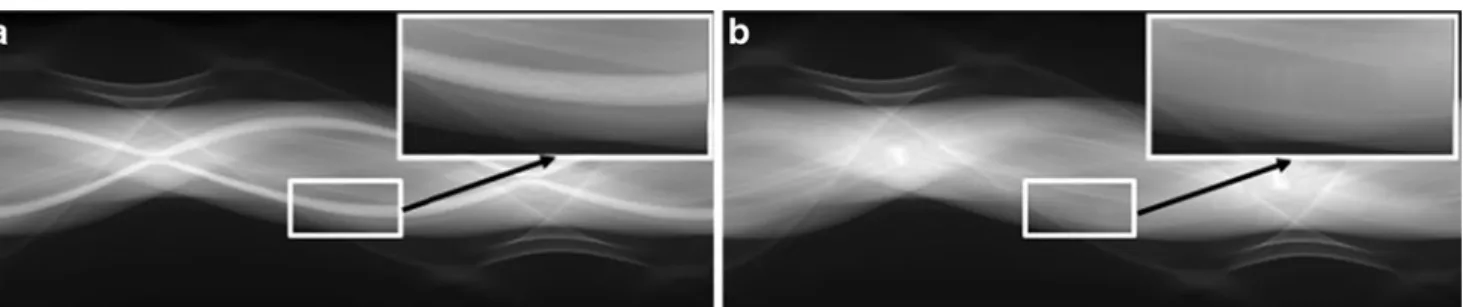
The performance of the proposed MAR technique in sinogram space is illustrated in Fig.10. It achieves well the defined objective of this study to obtain a smooth and continuous sinogram after MAR. The zoomed regions clearly show that the smoothness and continuity of the corrected sinogram are preserved. Moreover, the intensity levels of the affected projection bins are approximately the same as the surrounding bins, which is desirable.
A Bland-Altman plot generated for the 30 clinical cases is illustrated in Fig. 11. This plot shows the difference between the tracer uptake of the uncorrected and corrected PET images for overestimated (red), underestimated (blue) and unaffected (green) regions (45 ROIs for each patient). It is expected to have all the red data points in the positive part of the plot, all the blue points in the negative part and all the green points around the zero value. The difference between the uncorrected and corrected PET images using the proposed MAR method satisfies the above-mentioned
Fig. 7 a Mean activity concentration (Bq/cc) in different regions of uncorrected and corrected phantom PET images using the proposed and Siemens MAR methods. The actual activity concentration in the phantom is also shown. b Mean relative difference (%) between the
uncorrected, corrected PET images obtained using the proposed and Siemens MAR methods and the actual activity concentration within the phantom
criteria (Fig.11a). In contrast, the difference between the uncorrected and corrected PET images using the Siemens MAR method does not present with the expected pattern. Half of the blue points are situated in the positive part of the plot and the green points are higher than the previous plot.
Figure 12a shows the mean tracer uptake of the uncorrected and corrected PET images using the proposed and Siemens MAR techniques for the overestimated, underestimated and unaffected regions. Figure 12b shows the mean relative difference between the uptake in the uncorrected and corrected images using both MAR
a
b
c
d
e
Fig. 8 Representative images of one clinical study showing three planes of uncorrected (a) and corrected (b) CT images using the proposed MAR method. The corresponding planes of PET images corrected for attenuation using uncorrected (c) and corrected (d) CT
images. e Same as d using the Siemens MAR method. The arrows indicate a bright streaking artefact region in the uncorrected CT image and the corresponding region in the rest of the images
a
b
c
d
e
Fig. 9 Representative images of a second clinical study showing three planes of uncorrected (a) and corrected (b) CT images using the proposed MAR meth-od. The corresponding planes of PET images corrected for atten-uation using uncorrected (c) and corrected (d) CT images. e Same as d using the Siemens MAR method. The arrows indicate a dark streaking artefact region in the uncorrected CT image and the corresponding region in the rest of the images
approaches for the same regions. Although both MAR methods perform equally well in the overestimated and unaffected regions, the proposed MAR method is clearly superior in the underestimated regions. This is in agreement with observations made in the phantom study.
Discussion
Metallic hip prostheses are known to generate strong streaking artefacts in CT images. These artefacts will likely propagate to the corresponding CT-based attenuation-corrected PET images, thus causing over- and/or underes-timation of tracer uptake in the region surrounding the metallic implant. Reduction of metallic artefacts in CT images prior to attenuation correction of PET data is required to improve the diagnostic quality of PET images and to achieve accurate quantification.
The proposed MAR method corrects these artefacts in a virtual sinogram space. The projection bins affected by
metallic objects are substituted using a 2-D cubic interpo-lation scheme, which requires an irregular gridding on the unaffected data. A Delaunay triangulated grid was used for this purpose. Regular cubic interpolation is not compatible with this triangulated grid, and as such, Clough-Tocher interpolation was utilized as a 2-D interpolation technique. A 2-D interpolation scheme is superior to a 1-D scheme since it results in smoother sinogram pattern, which is an inherent feature of a sinogram. Continuity of the intensity levels is also an important factor which can influence the reconstructed image. As can be seen in Fig.10, both above-mentioned criteria are met. In the zoomed region of Fig. 10b, one can observe that the corrected sinogram is smooth and the intensity levels of the interpolated projec-tion bins and the surrounding unaffected bins vary continuously, while the zoomed region of the uncorrected sinogram (Fig. 10a) shows a significant discontinuity between the affected and the unaffected projection bins.
The phantom study revealed that the proposed MAR algorithm results in visually acceptable PET images. The
0 1 2 3 4 5 6 x 10⁴ -8000 -6000 -4000 -2000 0 2000 4000 6000 8000
Bland Altman plot
Mean of two measures (Bq/cc)
Difference between two measures (Bq/cc)
0 1 2 3 4 5 6 x 10⁴ -8000 -6000 -4000 -2000 0 2000 4000 6000 8000
Bland Altman plot
Mean of two measures (Bq/cc)
Difference between two measures (Bq/cc)
a
b
× overestimated + underestimated unaffected —— mean —— ± 1.96 SDFig. 11 Bland-Altman plots generated from uncorrected and corrected PET images of the 30 clinical studies. a Difference between activity uptake of uncorrected and corrected PET images using the proposed MAR technique. b Same as a using the Siemens MAR technique
Fig. 10 a Uncorrected sinogram. b Corrected sinogram using the proposed MAR algorithm. The zoomed regions allow a clear observation of the smoothness and continuity of the corrected sinogram
black and white regions in Fig. 6c represent over- and underestimation of activity concentration since the phantom is filled with uniform activity. These artefacts are caused by the bright and dark streaks shown in Fig.6a. It can be seen that the proposed method has successfully suppressed erroneous estimations around the metallic object (Fig. 6b). However, the Siemens method fails to correct the underes-timation (white regions around the metallic object), although it appropriately corrects the overestimated regions.
The quantitative analysis further demonstrates that the estimated activity concentration approaches the actual activity concentration within the phantom when using the proposed MAR method. Although there is a slight difference between the corrected and actual activity concentration (Fig. 7a), this difference was reduced from over 120% in the overestimated regions to less than 30% and from about−80 to −45% in the underestimated regions (Fig. 7b). On the other hand, the Siemens MAR method overcorrects the activity concentration (the difference decreases from ~120 to −20%) in the overestimated regions. However, the method does not seem to appropri-ately handle the underestimated regions where the activity concentration remains similar to the uncorrected data. In the unaffected regions, both methods keep the original uptake unchanged, which is desirable.
The clinical PET/CT studies had a similar trend. While the uncorrected PET image shows a high activity uptake in the region corresponding to bright streaking artefacts in the CT image (Fig. 8), both corrected PET images have low uptake in the same region, which confirms that both MAR methods perform similarly in overestimated regions. In the underestimated regions, the uncorrected PET image has no significant uptake in the corresponding region (Fig. 9), which corresponds to dark streaking artefact regions in the CT image. After correction using the proposed MAR, a high activity uptake is visible in the same region, while the image corrected using the Siemens MAR technique remains
unchanged. These results are in agreement with the phantom study. The non-attenuation-corrected PET images were also examined for visual comparison of the results obtained without and with the proposed and Siemens MAR methods. Similar conclusions as those reported in earlier studies [2,3,6] were drawn and as such this comparative study did not bring any new knowledge. Moreover, since the main aim of this study is to improve the quantitative accuracy of the PET data, the non-attenuation-corrected images were excluded from further analysis.
The Bland-Altman plots further confirm these results (Fig.11). Since it is expected that the uncorrected data have higher activity concentration than the corrected images in the overestimated regions, the red data points representing these regions are expected to be located in the positive region of the plot (upper part). Likewise, the blue data points representing the underestimated regions are expected to be in the negative region of the plot (lower part), and the unaffected regions (green) should remain unchanged (i.e. located around the x- axis). These criteria are met in Fig. 11a confirming that the proposed approach modifies the tracer uptake as desired. However, the Siemens MAR approach does not follow the same trend (Fig.11b). The red data points representing the overestimated regions are mainly located in the positive region, although some of them are situated on the x-axis because their values have not changed after correction. The blue data points are scattered around the x-axis, some of them being in the positive part of the plot, which confirms that the Siemens method fails to successfully compensate for the under-estimated regions. Similar to the results obtained using the proposed method, the unaffected regions remain unchanged compared to the uncorrected data.
The plots shown in Fig. 12 are also in agreement with the previous results. Both MAR methods reduce the tracer uptake in the overestimated regions by up to ~50%. The proposed method has increased the values of the
under-Fig. 12 a Mean activity concentration (Bq/cc) in different regions of
uncorrected and corrected PET images using the proposed and Siemens MAR methods for the 30 clinical studies. b Mean relative difference (%) between the uncorrected and corrected PET images using the proposed and Siemens MAR methods in different regions for the 30 clinical cases
estimated regions by up to ~45%, while the Siemens approach keeps the uptake almost unchanged in these regions. In the unaffected regions, both techniques introduce negligible change of the uptake, although the Siemens method causes a slightly higher difference between uncorrected and corrected images in these regions.
It must be emphasized that in the absence of a gold standard for the clinical studies, it is challenging to draw general conclusions with respect to the relevance of MAR in the clinical setting. Nevertheless, the phantom study revealed that the activity concentration in regions corresponding to bright and dark streaking artefacts best matches the actual activity concentration after applying the proposed MAR technique. This supports the opinion that the clinical results obtained using the proposed method are also more reliable than the uncorrected data as well as those obtained using the Siemens method.
Conclusion
We presented an approach for reduction of artefacts in PET/ CT images caused by metallic hip prostheses allowing the generation of a smooth and continuous sinogram. The performance of the proposed method in regions corresponding to bright streaking artefacts and artefact-free regions is similar to the method proposed by Hamill et al. [21]implemented on Siemens PET/CT scanners. However, the proposed method is superior in the regions corresponding to dark streaking artefacts. This approach makes CT-based attenuation correc-tion of PET images more accurate and prevents misinterpre-tation of activity uptake in some regions which might be biased due to the propagation of bright and dark streaking artefacts of CT images. The proposed method increases both the quantitative accuracy and the diagnostic image quality of PET images when compared to the Siemens method.
Acknowledgments This work was supported by the Swiss National Science Foundation under grant SNSF 31003A-125246, Geneva Cancer League and a research grant from Siemens Healthcare. Conflicts of interest None.
Open Access This article is distributed under the terms of the Creative Commons Attribution Noncommercial License which per-mits any noncommercial use, distribution, and reproduction in any medium, provided the original author(s) and source are credited.
References
1. Zaidi H, Hasegawa BH. Determination of the attenuation map in emission tomography. J Nucl Med 2003;44:291–315.
2. Kamel EM, Burger C, Buck A, von Schulthess GK, Goerres GW. Impact of metallic dental implants on CT-based attenuation
correction in a combined PET/CT scanner. Eur Radiol 2003;13:724–8.
3. Goerres GW, Ziegler SI, Burger C, Berthold T, Von Schulthess GK, Buck A. Artifacts at PET and PET/CT caused by metallic hip prosthetic material. Radiology 2003;226:577–84.
4. Kennedy JA, Israel O, Frenkel A, Bar-Shalom R, Azhari H. The reduction of artifacts due to metal hip implants in CT-attenuation corrected PET images from hybrid PET/CT scanners. Med Biol Eng Comput 2007;45:553–62.
5. Lemmens C, Montandon M-L, Nuyts J, Ratib O, Dupont P, Zaidi H. Impact of metal artefacts due to EEG electrodes in brain PET/ CT imaging. Phys Med Biol 2008;53:4417–29.
6. Heiba SI, Luo J, Sadek S, Macalental E, Cacavio A, Rosen G, et al. Attenuation-correction induced artifact in F-18 FDG PET imaging following total knee replacement. Clin Positron Imaging 2000;3:237–9.
7. Griffiths HJ, Priest DR, Kushner DM, Kushner D. Total hip replacement and other orthopedic hip procedures. Radiol Clin North Am 1995;33:267–87.
8. Cyteval C, Hamm V, Sarrabère MP, Lopez FM, Maury P, Taourel P. Painful infection at the site of hip prosthesis: CT imaging. Radiology 2002;224:477–83.
9. Stumpe KD, Nötzli HP, Zanetti M, Kamel EM, Hany TF, Görres GW, et al. FDG PET for differentiation of infection and aseptic loosening in total hip replacements: comparison with conventional radiography and three-phase bone scintigraphy. Radiology 2004;231:333–41.
10. Nahmias C, Lemmens C, Faul D, Carlson E, Long M, Blodgett T, et al. Does reducing CT artifacts from dental implants influence the PET interpretation in PET/CT studies of oral cancer and head and neck cancer? J Nucl Med 2008;49:1047–52.
11. Zaidi H, Montandon M-L, Alavi A. Advances in attenuation correction techniques in PET. PET Clin 2007;2:191–217. 12. Kalender WA, Hebel R, Ebersberger J. Reduction of CT artifacts
caused by metallic implants. Radiology 1987;164:576–7. 13. Yazdi M, Gingras L, Beaulieu L. An adaptive approach to metal
artifact reduction in helical computed tomography for radiation therapy treatment planning: experimental and clinical studies. Int J Radiat Oncol Biol Phys 2005;62:1224–31.
14. Bazalova M, Beaulieu L, Palefsky S, Verhaegen F. Correction of CT artifacts and its influence on Monte Carlo dose calculations. Med Phys 2007;34:2119–32.
15. Jeong KY, Ra JB. Metal artifact reduction based on sinogram correction in CT. IEEE Nucl Sci Symp Conf Rec (NSS/MIC); 2009; pp. 3480–83.
16. Veldkamp WJH, Joemai RMS, van der Molen AJ, Geleijns J. Development and validation of segmentation and interpolation techniques in sinograms for metal artifact suppression in CT. Med Phys 2010;37:620–8.
17. Abdoli M, Ay MR, Ahmadian A, Zaidi H. A virtual sinogram method to reduce dental metallic implant artefacts in computed tomography-based attenuation correction for PET. Nucl Med Commun 2010;31:22–31.
18. Robertson DD, Yuan J, Wang G, Vannier MW. Total hip prosthesis metal-artifact suppression using iterative deblurring reconstruc-tion. J Comput Assist Tomogr 1997;21:293–8.
19. Zhao S, Robertson DD, Wang G, Whiting B, Bae KT. X-ray CT metal artifact reduction using wavelets: an application for imaging total hip prostheses. IEEE Trans Med Imaging 2000;19:1238–47. 20. Zhao S, Bae K, Whiting B, Wang G. A wavelet method for metal artifact reduction with multiple metallic objects in the field of view. J Xray Sci Technol 2002;10:67–76.
21. Hamill JJ, Brunken RC, Bybel B, DiFilippo FP, Faul DD. A knowledge-based method for reducing attenuation artefacts caused by cardiac appliances in myocardial PET/CT. Phys Med Biol 2006;51:2901–18.
22. Lemmens C, Faul D, Nuyts J. Suppression of metal artifacts in CT using a reconstruction procedure that combines MAP and projection completion. IEEE Trans Med Imaging 2009;28:250– 60.
23. Abdoli M, Ay M, Ahmadian A, Dierckx R, Zaidi H. Reduction of dental filling metallic artefacts in CT-based attenuation correction of PET data using weighted virtual sinograms optimized by a genetic algorithm. Med Phys 2010;37:6166–77.
24. Delaunay P. Sur la sphère vide. Bull Acad Sci USSR 1934;6:793–800.
25. Guibas L, Stolfi J. Primitives for the manipulation of general subdivisions and the computation of Voronoi. ACM Trans Graph 1985;4:74–123.
26. Clough R, Tocher J. Finite element stiffness matrices for analysis of plates in blending. Proceedings of Conference on Matrix Methods in Structural Analysis. Wright-Patterson A.F.B., Ohio; 1965; pp. 515–45.
27. Lancaster P, Salkauskas K. Curve and surface fitting, an introduction. London: Academic Press; 1986.