Dynamics of Shifting Cultivation Landscapes in Northern
Lao PDR Between 2000 and 2009 Based on an Analysis
of MODIS Time Series and Landsat Images
Kaspar Hurni&Cornelia Hett&Andreas Heinimann& Peter Messerli&Urs Wiesmann
Published online: 8 December 2012
# Springer Science+Business Media New York 2012
Abstract The rotational nature of shifting cultivation poses several challenges to its detection by remote sensing. Consequently, there is a lack of spatial data on the dynamics of shifting cultivation landscapes on a regional, i.e. sub-national, or national level. We present an approach based on a time series of Landsat and MODIS data and landscape metrics to delineate the dynamics of shifting cultivation landscapes. Our results reveal that shifting cultivation is a land use system still widely and dynamically utilized in northern Laos. While there is an overall reduction in the areas dominated by shifting cultivation, some regions also show an expansion. A review of relevant reports and articles indicates that policies tend to lead to a reduction while market forces can result in both expansion and reduction. For a better understanding of the different factors affecting shifting cultivation landscapes in Laos, further research should focus on spatially explicit analyses.
Keywords Shifting cultivation . MODIS . Landsat . landscape metrics . Lao PDR
Introduction
In Montane Mainland Southeast Asia (MMSEA), shifting cultivation has been the dominant land use practice for centu-ries, and today remains an important subsistence agriculture system (de Rouw et al.2005; Inoue et al.2010,2007; Mertz et al. 2009). In the uplands of northern Lao PDR (hereafter Laos), shifting cultivation has remained the predominant land use type (Delang2007; Ducourtieux et al.2005; Roder et al. 1997; Seidenberg et al. 2003). Since the mid-nineties, this traditional upland agriculture system has undergone dramatic transformations (de Rouw et al. 2005; Ducourtieux 2005; Ducourtieux et al.2005; World Bank2008). Population pres-sure, in combination with economic and political factors, is mainly responsible for these changes. Increased exposure to the neighboring economies of China, Thailand and Vietnam through trade relations and transportation linkages has provid-ed farmers with new opportunities. In addition, national pol-icies blaming shifting cultivation for deforestation encourage its transformation into a more intensive, specialized agricul-tural production system (Padoch et al. 2007; Roder et al. 1997; Seidenberg et al.2003; World Bank2008).
Various case studies in northern Laos reveal that the transformation of traditional shifting cultivation, and espe-cially the speed of this change, has had important conse-quences for environmental service provision and rural livelihoods (de Rouw et al. 2005; Padoch et al. 2007; Roder et al. 1997; Watanabe et al.2004). Despite the sig-nificance of these changes, reliable information on the ex-tent and the dynamics of change in shifting cultivation landscapes, particularly on a regional scale, remains scarce (Fox et al.2009; Padoch et al.2007). Region-wide data is either derived from approximations based on population estimates or from the analysis of aerial photographs (Schmidt-Vogt et al.2009). However, these appraisals date from the early nineties and show large variations in their K. Hurni (*)
:
C. Hett:
A. Heinimann:
P. Messerli:
U. Wiesmann
Swiss National Centre of Competence in Research (NCCR) North-South, Centre for Development and Environment (CDE), Institute of Geography, University of Bern, Hallerstrasse 10,
3012 Berne, Switzerland e-mail: kaspar.hurni@cde.unibe.ch C. Hett e-mail: cornelia.hett@cde.unibe.ch A. Heinimann e-mail: andreas.heinimann@cde.unibe.ch P. Messerli e-mail: peter.messerli@cde.unibe.ch U. Wiesmann e-mail: urs.wiesmann@cde.unibe.ch DOI 10.1007/s10745-012-9551-y
estimations of the area under shifting cultivation (Mertz et al.2009; Schmidt-Vogt et al. 2009). The most recent esti-mate of shifting cultivation landscapes in Laos is provided by Messerli et al. (2009), who delineated the area under shifting cultivation and other types of landscapes from 2002 land cover data by utilizing a moving window approach. While this approach is considered to provide a credible estimate of the extent of the shifting cultivation landscapes, it relies on the availability of national land cover inventories. Often these inventories are carried out only at ten-year intervals and are therefore significantly limited in the fre-quency of data updates (Mertz et al.2009). The inclusion of time series information and change detection has been rec-ommended in order to reveal the changes in landscapes dominated by shifting cultivation (Mertz et al.2009).
This paper presents an approach to addressing this infor-mation gap through the use of 10 years of MODIS time series data along with Landsat images, which allows for the delin-eation of those areas where shifting cultivation prevails. We used the Landsat images to identify land cover dynamics and the MODIS time series data to map them for the whole of northern Laos. Shifting cultivation landscapes show a specific spatio-temporal combination of land cover dynamics. In the MODIS classification, we assessed these characteristics using landscape metrics. Our results revealed not only those land-scapes in northern Laos where shifting cultivation dominates but also their dynamics at the provincial to national scale.
Description of the Study Site
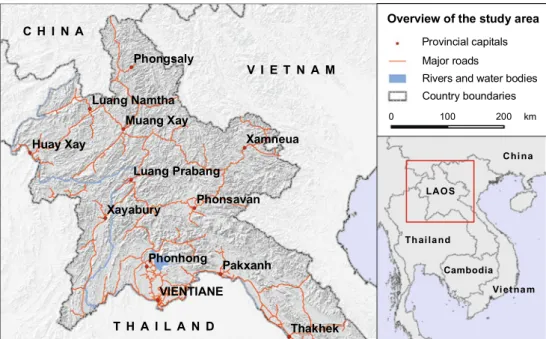
Much of the land area of Laos is mountainous, particularly in the northern uplands, which are characterized by steep
slopes and narrow river valleys (see Fig. 1). In flat valley bottoms, paddy fields of varying lengths but only a couple of meters in width often occur. On the hill-sides, a land cover mosaic of freshly cleared agricultural plots and different stages of fallow land cover can be observed. These hills are used predominantly for shift-ing cultivation (Hett et al. 2011; Roder et al. 1997). Various case studies have reported that in northern Laos, especially in the provinces of Luang Namtha, Oudomxay, and Luang Prabang, shifting cultivation is still widespread (Inoue et al. 2010, 2007; Leek 2007; Linquist et al. 2007; Roder 2001; Saito et al. 2006; Yamamoto et al. 2009; Yokoyama 2004)
A good road network connects provincial and most dis-trict capitals in northern Laos. However, away from these major transport networks accessibility, in terms of practica-ble transportation, decreases and travel time to these centers thereby increases. Consequently, changes from and to the shifting cultivation land use practice primarily take place along the major transport routes and the border regions with the introduction of a variety of cash crops and agricultural plantations (Alton et al. 2005; Cramb et al. 2009; Ducourtieux et al. 2006; Fox et al. 2009; Padoch et al. 2007).
Our study area was limited to northern Laos and al-though our methodology would have allowed an assess-ment of the whole country, the multiple processing steps and the additional amount of data required for this led us to focus on this region only. This substantially reduced the workload but still allowed us to include the most impor-tant shifting cultivation regions in Laos (Delang 2007; Ducourtieux et al. 2005; Roder et al. 1997; Seidenberg et al. 2003).
Fig. 1 Lao PDR, a landlocked country in Southeast Asia between Cambodia, China, Myanmar, Thailand, and Vietnam. The study region covers the area of northern Laos
Approach
The rotational nature of shifting cultivation has implications for assessing the area under this land use. Newly cleared agricultural plots, as well as the different stages of fallow land (plots cultivated in previous years and since left to natural regrowth), need to be taken into consideration. Attempts to map these different stages of forest re-growth using medium resolution images (e.g. Landsat) can suffer inaccuracies in mountainous areas due to terrain shadows (Dorren et al. 2003). It is thus impossible to assess the area under shifting cultivation using images taken at only a single point in time. While different stages of forest re-growth cannot be distin-guished in the images, it is still possible to separate newly cleared agricultural plots from vegetated land cover. Thus using time series images, the spatio-temporal dynamics of these plots allow for an assessment of shifting cultivation landscapes (Heinimann2006; Schmidt-Vogt et al.2009).
Still, there are constraints when working with a time series of Landsat images on a regional or national level since data availability is often highly limited due to frequent cloud cover and haze. As a result, consistent and free of charge Landsat time series images at these levels are not yet available. Up to
now, studies focusing on shifting cultivation in Laos are either spatially limited, as in Inoue et al. (2007) or Yamamoto et al. (2009), or show a temporal limitation in comparing only two time steps, as in Heinimann (2006).
In order to overcome these constraints, we present an approach using yearly Landsat images, time series of MODIS data, and landscape metrics. The medium spatial and temporal resolution of the Landsat data allowed the accurate mapping of the land cover change trajectories for the extent of one Landsat scene over 10 years. Mertens and Lambin (2000) define land cover change trajectories as successions of land cover types over more than two obser-vations. Due to the limitations of the Landsat data, this approach does not provide consistent coverage. In Fig. 2, 1c, the data gaps can be seen as blank areas between the change trajectories (represented by different colors).
MODIS time series data has the potential to provide spatially continuous data. While the low spatial resolution provided by MODIS is less than that of Landsat, the high temporal resolution of MODIS data allows for the elimina-tion of most of the data gaps caused by cloud cover and haze. In addition, each land cover change trajectory repre-sents a specific vegetation dynamic over time. Having data
1 (a)
5 km
) c ( ) b (5 km
10 km
2 km
2 (a) (b)10 km
30 km
3 (a) (b)Fig. 2 Three-step approach to assessing the dynamics of shifting cultivation landscapes in northern Laos using a post-classification comparison of Landsat images, the classifica-tion of MODIS time series data and landscape metrics. See Figs.4and6for a legend to the maps
with a high temporal resolution is thus beneficial for the detection of these trajectories.
Since the MODIS time series data could not be classified without prior knowledge of the major land cover and its dynamics, we used the information on land cover change trajectories from the Landsat analysis to derive training sam-ples for the classification of the MODIS time series. This allowed us to map the prevailing land cover change trajecto-ries for northern Laos. Using landscape metrics, we then delineated the landscapes dominated by shifting cultivation. As illustrated in Fig.2, the approach has three main steps: 1. Assessment of the land cover change trajectories occurring:
We applied a binary classification of “medium to high biomass density” (HB) and “low to no biomass density” (NB) to each of a time series of Landsat images at yearly intervals. Post-classification comparison revealed the type, location, and incidence of stable HB and NB land cover, and of the land cover change tra-jectories. An analysis of the sequence of the two classes (HB and NB) over 10 years allowed us to relate a land cover change trajectory to a certain process, such as shifting cultivation (Heinimann 2006; Mertens and Lambin2000; Yamamoto et al.2009).
2. Identification of the prevailing land cover change trajectories for the whole of northern Laos:
MODIS time series data covering the area of northern Laos was classified. Training areas were derived from the Landsat post-classification comparison. A specific land cover change trajectory was selected as training area if it covered more than 75 % of a MODIS pixel and if these MODIS pixels, representing a specific land cover change trajectory, occurred in a certain number. 3. Detection and delineation of shifting cultivation
landscapes and their dynamics:
We calculated landscape metrics using the classified MODIS data. Shifting cultivation can be characterized by a spatio-temporal dynamic of field cultivation (Heinimann2006; World Bank2008). Shifting cultiva-tion landscapes show a specific mosaic of the different land cover change trajectories in the classified MODIS data. We used landscape metrics to assess the occur-rence and area of land cover change trajectories to delineate shifting cultivation landscapes.
Classification of Landsat Images
Image Data and Pre-Processing
We used a time series of yearly Landsat images to assess the land cover and its change trajectories. The Landsat path/row
129/46 proved to be an appropriate image location. It over-laps with those provinces where, based on the available case studies, shifting cultivation is expected to predominate. For each of the years from 2000–2009, a Landsat image was used. Each year’s image was taken in the early dry season between October and December, which is the period after harvesting and before clearing new plots for shifting culti-vation (Fujisaka1991; Roder et al.1997; Yamamoto et al. 2009).
We applied the Tasseled Cap Transformation to the data and calculated the Normalized Difference Vegetation Index (NDVI). Image stacking combined the multispectral image data, the transformed data, and the vegetation index into a single image. Clouds were masked by threshold classifica-tion of the Landsat band 1 and the thermal band(s).
Image Classification and Definition of Land Cover Change Trajectories
Several studies have used Landsat images to look at shifting cultivation in northern Laos. Heinimann (2006); Yamamoto et al. (2009), and Inoue et al. (2010) performed post-classification change detection of a binary image classifica-tion. Such a classification of each time step into the classes NB and HB enables the detection of shifting cultivation when using a time series of images (Heinimann2006; Yamamoto et al.2009). Post-classification comparison (Fig.2, section 1 (b)) of the binary image classification provided a complete matrix of the land cover change trajectories occurring, includ-ing those representinclud-ing shiftinclud-ing cultivation and the corresponding crop-fallow rotation cycles (Lu et al.2004).
As shown in Fig.2, section 1(a), the Landsat images were basically divided into two classes: NB and HB. In addition, we used the classes“shadow” and “water” to exclude these areas in the analysis of change. This reduced misinterpreta-tions in areas of cloud shadows and edges of water bodies. Following the approach of Robichaud et al. (2009), we selected training sites for the supervised classification on the image using the authors’ knowledge of the study area. The images were classified with the support vector machine (SVM) classifier using the tool imageSVM. ImageSVM is an implementation for the classification of remote sensing images with the non-parametric SVM classifier. SVMs con-stitute machine learning and outperform most other classi-fication approaches (Janz et al. 2007). For each Landsat image the classification accuracy was assessed using a ran-dom stratified sample of 50 points per class. The accuracies ranged between 86.5 % and 98.5 %.
Subsequently, we removed the classes “shadow” and “water” from the classified images. Post-classification com-parison of the 10 images (Fig.2, section 1(b)) then yielded 1,024 different land cover change trajectories (see Fig. 2, section 1(c)). Each color represents a specific sequence of
the classes NB and/or HB over the 10 years. The post-classification comparison revealed the spatial distribution of areas with different dates of clearance and/or different crop-fallow rotation cycles, the areas with stable low bio-mass density, and the areas with stable high biobio-mass density.
Classification of MODIS Data
Image Data and Pre-Processing
We analyzed the land cover and land cover changes for northern Laos using the MODIS Enhanced Vegetation Index (EVI) data of the MOD13Q1 product. It provides the EVI as a 16-day composition image, selecting on a pixel basis the best observation of the 16 preceding daily image acquisitions. This provides both a spatial and temporal con-sistency in vegetation index values (Huete et al.2002).
Although the data constitutes a 16-day image composi-tion (limiting the problems caused by cloud cover, haze, etc.), the vegetation index values still showed spikes, espe-cially during the months of May to September. Due to the persistent cloud cover in monsoon Asia during the rainy season, certain locations still lacked cloud-free pixels even when multiple images were taken across a period of 16 days. To enhance the data quality by getting rid of these spikes, we processed the images using Timesat (Eklundh and Jönsson2010; Jönsson and Eklundh 2002,2004). Timesat fits smooth functions to the data, returning files containing even renditions of the original data, and we used the double logistic function as it showed the best performance. Similar experiences have been reported by other authors dealing with noisy data, e.g. (Beck et al. 2006; Eklundh and Jönsson2010; Hird and McDermid2009). We applied the fitting function to data covering the area of northern Laos over the period of 2000–2009.
Image Classification and Definition of Land Cover Change Trajectories
To classify the MODIS EVI time series, we used the change trajectories derived from the post-classification comparison of the Landsat images. Training areas were thus derived from only one Landsat scene located in the center of north-ern Laos to classify the MODIS data covering the whole area of northern Laos. See Knorn et al. (2009) for a valida-tion of this approach.
We based the training data selection from the Landsat change trajectories on the approaches of Clark et al. (2010) and DeFries et al. (1999). These authors used a majority cover of a change trajectory within a pixel of the low-resolution data as selection criteria. Considering that the threshold of the majority cover also affects the number of
samples that can be derived (the higher the threshold, the fewer samples and vice versa), we found a cover of at least 75 % to be appropriate. We selected a specific change trajectory as a potential training area if it showed at least 75 % cover within a MODIS pixel. This reduced the number of land cover change trajectories considered for the classi-fication of the MODIS EVI time series data from 1,024 to 46. Section 2(a) of Fig.2shows an example of the sample selection: the grid represents the size of the MODIS pixels with the points marking the pixels where a land cover change trajectory shows a cover of 75 % or more.
The trajectories of stable HB and stable NB over the ten-year period showed the highest number of training areas for the classification. These two trajectories were followed by the change trajectories showing only one clearance over the de-cade (each showing nine HB and one NB incidences over the 10 years studied). These ten change trajectories can be related to shifting cultivation land use. Forest (classified as HB) is cleared in one year (resulting in NB), the plot is cultivated and left fallow in the subsequent years (classified as HB) (World Bank 2008). The remaining 34 change trajectories showed different sequences of HB and NB. These may also be related to shifting cultivation (i.e. fallow periods shorter than those mentioned above) or to other land cover dynamics in the region (i.e. the expansion of permanent agriculture). Certain studies on northern Laos report short fallow periods of be-tween 3 and 7 years (de Rouw et al.2005; Roder et al.1997; Seidenberg et al. 2003; Sprenger 2006). Most likely these shorter fallow periods are represented by some of the change trajectories with different sequences of HB and NB already described. Most of these change trajectories, however, share the problem that they provide only a very limited number of training areas for classification. In order to assess the impor-tance of the change trajectories within the region we calculat-ed the shares of area they cover within the Landsat training data. Table1summarizes this analysis and provides an over-view of the included and omitted change trajectories of the classification and their area shares.
The table shows that the change trajectories used as train-ing areas for the classification of the MODIS time series data account for 89 % of the Landsat area. The exclusion of the first group of change trajectories was inevitable as this group included 978 different change trajectories, but covered only 5 % of the Landsat area. None of these change trajectories covered at least 75 % of a MODIS pixel. These dynamics are on a scale that cannot be depicted by the MODIS images and can thus not be included in the classification. The second group of change trajectories excluded consists of 34 different land cover change trajectories and covers only 6 % of the area. While these change trajectories covered more than 75 % of a MODIS pixel, they only provided a limited number of training areas for classification. Using a small number of training areas along with a large number of classes has a negative effect on
the accuracy of the classification (Pan et al.2010; Sordo and Zeng2005; Wästfelt et al. 2012). Including these change trajectories in the classification would thus degrade the accu-racy of the whole classification, while excluding them means accepting an inaccuracy that affects 6 % of the study area. We opted for the latter as this would result in a more accurate classification of the change trajectories that represent 89 % of the study area. During the classification process, MODIS pixels showing one of the excluded change trajectories were assigned a class representing one of the change trajectories included in the classification, which was most likely one of the classes representing a change trajectory with only one clear-ance per year. Such a partial misclassification (as presumably one of the multiple clearances within the 10 years was labeled correctly) was inevitable.
Consequently, stable HB, stable NB, and the ten change trajectories showing only one clearance per year were used as training areas. Figure 3 provides an overview of these change trajectories.
The MODIS EVI time series data was classified with the SVM classifier. In a first run, the classification was per-formed using imageSVM and the 12 selected classes (Janz et al.2007). In a second run, a thirteenth class derived from the Landsat images, “stable shadow”, was included. This improved the classification output as the terrain shadows in mountainous northern Laos resulted in misclassifications (mainly through terrain shadows being classified as“stable NB”). The class “stable water” was not included, as the water bodies were masked using auxiliary data. Section 2 (b) of Figs. 2 and 4 show the classified MODIS data for selected areas in northern Laos.
Accuracy assessment of the MODIS EVI time series classification was performed using a time series of Landsat images from 2000–2009 in the area of five Landsat scenes (128/46; 129/45; 129/46; 129/47; 130/46) covering most of northern Laos. The image acquisition dates range from October to December. Random stratified sampling of the MODIS classification provided 50 points per class within the Landsat scenes for accuracy assessment and the overall accuracy of the MODIS classification was 81 %.
Delineation of Shifting Cultivation Landscapes Using a Landscape Metric Approach
In order to distinguish those regions under shifting cultiva-tion from those showing other dynamics or processes of change, we considered the characteristics of the different agricultural production systems in northern Laos. Two main systems can be distinguished, namely shifting agriculture, the system of central interest to this study, and different types of permanent agriculture or tree plantations (World Bank 2008). One way to assess whether a landscape is dominated by shifting cultivation is by calculating the R value (dividing the cultivated area by the area of arable land) (Ruthenberg1971; van Noordwijk1999). Unfortunately, the R value could not be calculated in the study at hand as the Table 1 Shares of the different change trajectories within the area of
the Landsat change trajectories (covering 15,975 km2, change trajec-tories containing“water” or “shadow” were excluded)
Change trajectory groups Number of change trajectories
Percentage of area
Stable HB 1 67
Stable NB 1 1
Included shifting cultivation change trajectories (once NB and nine times HB over 10 years)
10 21
Excluded change trajectories 1 (none covering more than 75 % of a MODIS pixel)
978 5
Excluded change trajectories 2 (insufficient amount of training areas) 34 6 stable NB stable HB cleared in 2000 cleared in 2001 cleared in 2002 cleared in 2003 cleared in 2004 cleared in 2005 cleared in 2006 cleared in 2007 cleared in 2008 cleared in 2009 2000 - 2001 - 2002 - 2003 - 2004 - 2005 - 2006 - 2007 - 2008 - 2009
medium to high biomass density low to no biomass density
Fig. 3 Land cover change trajectories used for the classification of the MODIS EVI time series
MODIS classification did not show the total area of arable land, but rather the location and time of the prevailing land cover change trajectories. As a result, the spatio-temporal dynamic of plot cultivation could be detected in the MODIS classification and used to distinguish the shifting cultivation system from other systems.
In order to measure the spatio-temporal dynamic, we used landscape metrics, or algorithms that quantify specific spatial characteristics of patches (McGarigal et al. 2002). Within a moving window for each pixel, statistics were calculated based on that pixel’s own value and the values of the surrounding pixels. According to Messerli et al. (2009), the window size is a key factor of this analysis, as it should match the average reach of a rural actor. Based on a study showing the impact of accessibility on land cover change, their findings define a window size of 5 × 5 km as being meaningful. Within this window size, the regions with shifting cultivation characteristics were assumed to include a low share of the classes “stable HB” and “stable NB”,
while showing similarly sized shares of each change class. Subsistence production in a shifting cultivation system was presumed to occupy or clear every year similarly sized plots. Other production systems in northern Laos were either already classified as stable NB or, in the case of tree planta-tions (e.g. teak, rubber), classified as stable HB. Expansion of production systems other than shifting cultivation (e.g. cash cropping and industrial tree plantations) during the 2000–2009 period were likely to be represented as one of the change classes. However, these are one-time changes and do not show the co-occurrence of several change classes in the 5 × 5 km window as the production systems with rotational characteristics do (World Bank2008). In section 3 (a) of Fig.2, the 5 × 5 km grid is displayed along with the classified MODIS data to give an impression of how the change trajectories manifest themselves within the window size used to calculate the landscape metrics.
Prior to the moving window analysis, we removed patches of the change classes covering areas larger than Fig. 4 Major land cover
change trajectories, stable HB, and stable NB from 2000 - 2009 classified using time series of MODIS EVI data
650 ha, as they represent dynamics other than those of shifting cultivation (Ducourtieux et al. 2005; Giri et al. 1998; Inoue et al. 2010; Padoch et al. 2007). Using the moving window approach, the following spatial statistics were derived for a 5 × 5 km window:
1. Percentage of the area covered by all change classes together
2. Coefficient of variation (CV) of the areas the change classes cover
With these two landscape metrics it was possible to separate the regions where shifting cultivation occurs from areas where no or other production systems mainly prevail. The first landscape metric was used to distinguish areas with land cover changes from the regions where no change occurred. The second metric provided information on how the change classes were represented in the area the moving window covered. A low CV indicated that the change
classes covered more or less equal area shares within the moving window while a high CV indicated the opposite. The regions where shifting cultivation prevailed as the pre-dominant land use practice were characterized by a high area share of change classes, as well as a low CV of the areas of the change classes within the moving window.
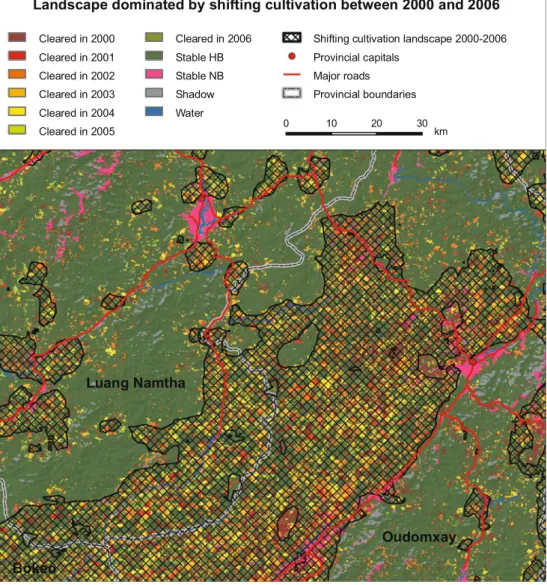
As stressed by Mertz et al. (2009), it is also important to map the dynamics of the landscapes dominated by shifting cultivation. The MODIS classification, showing the pre-dominant land cover change trajectories over 10 years, allowed for such an analysis. We calculated the shifting cultivation areas for the periods of 2000–2006 and 2003– 2009. Change classes not used for the calculation of the shifting cultivation area (i.e. for 2000–2006, those classes showing change in 2007, 2008, and 2009) were considered as belonging to the class of“stable HB”. Figure5shows the shifting cultivation landscapes from 2000–2006 together with the classified land cover change trajectories used for
Fig. 5 Landscapes where shifting cultivation prevails from 2000– 2006. In the background is the MODIS classification of land cover change trajectories, stable HB, and stable NB usedto calculate the landscape metrics
delineation (change trajectories“cleared in 2007”, “cleared in 2008” and “cleared in 2009” are included in the class “stable HB”).
Combining the two time steps revealed the areas where shifting cultivation had disappeared as the dominant land use from 2000–2003, where it had remained predominant from 2000–2009, and where it had emerged as the predominant land use from 2006–2009. In Fig.6, the dynamics of shifting cultivation landscapes in northern Laos are presented.
It would have been ideal to assess the dynamics using two time periods from 2000–2004 and 2005–2009. However, as the landscape metrics are based on the change classes, a better estimate of the area where shifting cultiva-tion prevailed can be provided when a longer period is considered. We found the calculation of the landscape met-rics for a period of 7 years (2000–2006 and 2003–2009) to be appropriate.
Validation of the Delineated Shifting Cultivation Landscapes
Field verification of the delineated shifting cultivation land-scapes over space and time was beyond the capacity of this study and a verification using time series of medium to high resolution satellite images was limited by data availability and the subjective spatial interpretation of the dynamics by the researcher. Therefore, we chose a cost-effective ap-proach that still allowed a certain accuracy statement: 13 publications on shifting cultivation in northern Laos (look-ing at 39 villages) from 2000–2006 were used to assess the shifting cultivation landscape delineated by our analysis. Only one article with a study period later than 2006 was available; therefore, this assessment was only performed for the period from 2000–2006. Still, for both of the periods, the delineation of the area where shifting cultivation prevailed
Fig. 6 Shifting cultivation dominated landscapes and their dynamics from 2000– 2009 in northern Laos
was derived from the same MODIS EVI classification by using the same methodology; thus levels of accuracy can be assumed to be similar.
The validation was one-sided; we could only test whether the villages reported to have shifting cultivation also contained shifting cultivation areas mapped from the MODIS data. Unfortunately we could not check the reverse, as studies looking at other land use practices or land cover types within a certain area do not necessarily exclude the possibility of the co-occurrence of a shifting cultivation practice (Schmidt-Vogt et al.2009). Consequently, the val-idation provided an error of exclusion (or omission error– excluding an area from a category to which it belongs), but not an error of inclusion (or commission error– including an area in a category it does not belong) (Congalton et al.1998; Delang2007).
A list of case study villages of publications used and their share of land mapped as shifting cultivation for the period 2000–2006 is given in Table2.
Five villages reported to be practicing shifting cultivation did not overlap with the mapped shifting cultivation area, while 17 villages revealed a 100 % overlap. We considered calculating the error of exclusion using the shares of overlap as inappropriate. On the one hand, we do not know what other types of land use or land cover occurred in the villages (e.g. paddy fields, grasslands, unused forest areas). On the other hand, the map is suitable for the provincial level, taking into consideration the resolution of the MODIS data and the additional moving window analysis (Bagan et al. 2005; Foody2002; Hansen et al. 2005). In order to check whether the distribution of the mapped shifting cultivation area was accurate, we performed a binary assessment by dividing the villages into“shifting cultivation villages” and “not shifting cultivation villages”. Villages showing a shift-ing cultivation share of 30 % or more were assumed to be “shifting cultivation villages”, the others not. This resulted in an error of exclusion of 77 %, or in other words, 77 % of the shifting cultivation villages are labeled as such on the map.
Results and Discussion
Approach
We found the three-step approach appropriate for mapping landscapes dominated by shifting cultivation on a regional or national level. First, through a post-classification com-parison of yearly Landsat images, we gained information on the land cover change trajectories occurring. In the second step, we mapped the prevailing land cover change trajecto-ries for the whole region using MODIS time setrajecto-ries data. Third, we used landscape metrics to take into account the
spatio-temporal dynamics of land cover change trajectories related to shifting cultivation. This allowed us to map land-scapes dominated by shifting cultivation and their dynamics and, based on the accuracy assessments, the three-step ap-proach developed worked well. Performing an accuracy assessment of the output of each step of the approach independently ensured that no classification errors accumu-lated without being quantified.
Classification of Landsat Images
The Landsat analysis in the first step provided information on the incidence and spatial distribution of the different processes occurring in northern Laos. The accuracy of the classified Landsat images ranged from 86.5– 98.5 %. This confirmed the findings of the study of Heinimann (2006), who demonstrated that a binary classification into high and low biomass classes of Landsat images is very robust.
The post-classification comparison of the Landsat classi-fication provided a complete matrix of the land cover change trajectories and their frequency. This allowed a quantification of the dynamics occurring in the area of the Landsat scene. In Table1, we showed that out of the 1024 land cover change trajectories mapped (not including the classes “water” and “shadow”), it is possible to explain 89 % of the dynamics in the area with only 12 change trajectories. Over the 10 years analyzed, 68 % of the area showed a stable land cover (67 % stable HB, and 1 % stable NB). At least 21 % of the area displayed change trajectories that could clearly be related to shifting cultivation (showing nine incidences of HB and one of NB over the decade analyzed). The remaining 11 % of the area showed a great variety of dynamics, as it is represented by 978 different change trajectories. Considering the high number of change trajectories within this small area, it can be assumed that each change trajectory covers only a small area and/or is relevant for a specific location rather than for the whole study region. These change trajectories may also be related to shifting cultivation (with different sequences of HB and NB over the decade) and to other land cover dynamics, for example the expansion of permanent agriculture.
Classification of MODIS Data
Classification of the prevailing land cover change trajecto-ries for northern Laos was performed using MODIS time series data as a consistent time series of Landsat images was not available for this area. Therefore, the medium spatial resolution of the Landsat data had to be sacrificed for a lower spatial resolution, but a high temporal resolution of the MODIS data. As the different land cover change trajec-tories represent specific temporal patterns of vegetation dynamics, the high temporal resolution was a benefit.
The assessment of the 75 % majority cover of the Landsat change trajectories within a MODIS pixel for the sample selection had an additional benefit. It allowed us to assess the potential of the scale of the MODIS data to map land cover change trajectories in northern Laos. This analysis showed that the MODIS data is able to detect land cover change trajectories that represent 94.5 % of the area. Using MODIS, it is thus possible to map most of the land cover changes in northern Laos. In our analysis, however, we used
only the 12 most frequently occurring land cover change trajectories, thus covering 89 % of the study area. The reason for doing so was the very limited amount of training data that could be retrieved from the other land cover change trajectories (a small number of training areas reduces the classification accuracy). A higher number of classes also results in a less accurate classification (Pan et al. 2010; Sordo and Zeng2005; Wästfelt et al.2012). This approach thus increased the accuracy of the classes representing 89 % Table 2 Share of the village
ar-ea being mapped as “predomi-nated by shifting cultivation”
Publication Village Name Study Period Shifting Cultivation Area Share (%)
Linquist et al. (2007) B. Namo-Nua 1962– 2002 68
Linquist et al. (2007) B. Pangdou 1962– 2002 97
Linquist et al. (2007) B. Houayluang 1962– 2002 95
Linquist et al. (2007) B. Houaythoum 1962– 2002 99
Linquist et al. (2007) B. Pakchek 1962−2002 100
Linquist et al. (2007) B. Khonkham 1962– 2002 100
Linquist et al. (2007) B. Houayman 1962– 2002 0
Linquist et al. (2007) B. Thapho 1962– 2002 41
Watanabe et al. (2004) B. Phonxai 2000 97
Watanabe et al. (2004) B. Thinkeo 2000 88
Watanabe et al. (2004) B. Longluat 2000 100
Seidenberg et al. (2003) B. Phiangxai 2000 26
Seidenberg et al. (2003) B. Khangkhao 2000 30
Seidenberg et al. (2003) B. Keoxik 2000 54
Sprenger (2006) B. Takheung 2000– 2005 100 Yokoyama (2004) B. Hommok 2001 71 Yokoyama (2004) B. Cheng-Kang 2001 100 Yokoyama (2004) B. Pakbout 2001 100 Yokoyama (2004) B. Houaylo-Theung 2001 100 Yokoyama (2004) B. Kongmouang 2001 100 Yokoyama (2004) B. Paklong 2001 100 Yokoyama (2004) B. Houaylo-Soung 2001 96 Yokoyama (2004) B. Houaysi 2001 100 Yokoyama (2004) B. Hatsa 2001 100 Yokoyama (2004) B. Phonxana 2001 100 Yokoyama (2004) B. Gnotsi 2001 100
Saito et al. (2006) B. Hatmat 2001– 2002 0
Saito et al. (2006) B. Houaykha 2001– 2002 99
Saito et al. (2006) B. Phathung 2001– 2002 100
Saito et al. (2006) B. Somsanouk 2001– 2002 10
de Rouw et al. (2005) B. Lak10 2001– 2003 0
LSUAFRP (2003) B. Kioulan 2002 21
LSUAFRP (2003) B. Pangthong 2002 100
Ducourtieux (2005) B. Yapoung 2002– 2003 7
Ducourtieux (2005) B. Tete 2002– 2003 1
Darr (2003) B. Napo 2002– 2003 0
Yokoyama et al. (2006) B. Naxao 2003 0
Alton et al. (2005) B. Hatgnao 2004 86
of the change trajectories, while we accepted a misclassifi-cation of 11 % of the occurring land cover change trajecto-ries. The classification of the MODIS data resulted in an overall accuracy of 81 %.
Although most of the changes occurring in northern Laos can be depicted using MODIS data, the low spatial resolution compromised the problem of mixed pixels. During the classi-fication, these pixels were assigned only one of the multiple classes they represent. As a result, the classification of these pixels can be considered neither completely wrong nor com-pletely right (Congalton et al.1998; Foody2002). Comparing the change in areas of the different classes was therefore inappropriate. However, we were able to overcome this limi-tation of the MODIS classification by looking at the spatio-temporal dynamics using landscape metrics (Heinimann 2006; Schmidt-Vogt et al.2009; Yamamoto et al.2009). Landscape Metrics
The output of the landscape metrics showed the extent of shifting cultivation landscapes for the years 2000–2006 and 2003–2009. Verification of the delineated shifting cultiva-tion landscapes resulted in an error of exclusion of 77 % (77 % of the shifting cultivation villages are labeled as such on the map). As discussed, the verification of this step is limited, thus no error of inclusion or overall accuracy could be provided. Additionally, the assessment could only be performed for the first period of the delineated shifting cultivation landscapes (2000–2006) as the second period (2003–2009) lacked relevant literature. This is not consid-ered a critical shortcoming as the accuracy can be expected to be similar, especially as the contextual interpretation of the results below shows that the mapped dynamics are in line with respective known processes.
Interpretation of Results
Our data shows that shifting cultivation landscapes are still widespread throughout northern Laos. The provinces of Luang Prabang, Phonsaly, Oudomxay, Bokeo, and Luang Namtha can be considered to host the core area under shift-ing cultivation in northern Laos (see Fig.6). In these prov-inces, shifting cultivation landscapes are vast and spatially
continuous. Two major patches can be identified, one across much of Luang Prabang and southern Phongsaly provinces and the other around the borders of Oudomxay, Luang Namtha and Bokeo provinces.
In the other provinces of northern Laos, shifting cultiva-tion landscapes are also found, but they cover smaller, patchy areas.
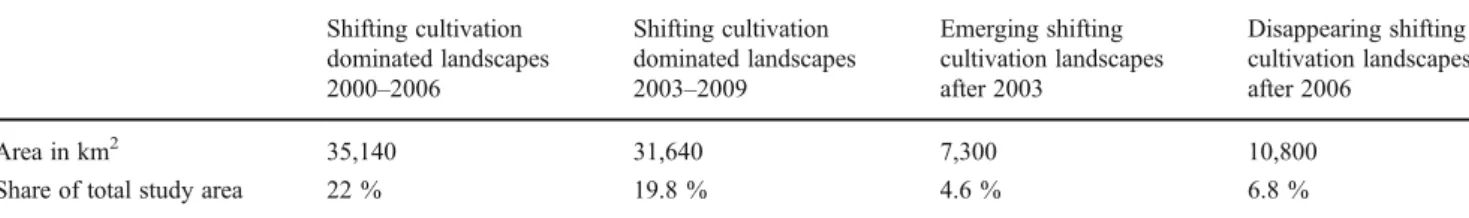
The analysis of our data from the two time periods showed that the area of shifting cultivation dominated land-scapes in northern Laos decreased by almost 10 % (from 35,140 km2 in 2000–2006 to 31,640 km2 in 2003–2009). An overview of these dynamics is given in Table3.
The net change in landscapes dominated by shifting cultivation constitutes only 2.2 % of the study area. However, an examination of emerging and disappearing shifting cultivation landscapes reveals that both are very dynamic. On the one hand, the landscapes dominated by shifting cultivation from 2000–2006 were reduced by 30 %, with almost one third of the area under shifting cultivation in this period changing to another land use after 2006. On the other hand, some shifting cultivation areas emerged in land-scapes that were not used for shifting cultivation from 2000–2002. Within the area of landscapes dominated by shifting cultivation from 2003–2009, 23 % had not been used for shifting cultivation from 2000–2002. With the MODIS EVI time series data and analysis only dating back to the year 2000, there is no direct evidence that there was no shifting cultivation in these areas before 2000 (i.e. areas may have been under a long fallow period, thus no activity was observed from 2000–2002). However, the size of the moving window used to calculate the landscape metrics as well as the spatial distribution of the emerging shifting cultivation landscapes suggest that this dynamic represents an expansion and is not just a result of a long fallow that was not covered by the analysis period.
Given the highly dynamic nature of shifting cultivation landscapes, not only their net change but also the spatial distribution of their changes as depicted in Fig.6should be considered. As already described, the core regions of shift-ing cultivation were those most affected by the decrease, with the biggest decreases being observed around the pro-vincial capitals of Luang Prabang and Oudomxay, and around Phongsaly. Those areas where shifting cultivation has emerged as the dominant land use seem to be more
Table 3 Area and dynamics of landscapes dominated by shifting cultivation in northern Laos
Shifting cultivation dominated landscapes 2000–2006 Shifting cultivation dominated landscapes 2003–2009 Emerging shifting cultivation landscapes after 2003 Disappearing shifting cultivation landscapes after 2006 Area in km2 35,140 31,640 7,300 10,800
widely dispersed throughout northern Laos. Regions which are easily accessible, as well as the rather peripheral ones both show patches of new shifting cultivation landscapes. While the demise of shifting cultivation in most provinces outweighs its rise, Luang Namtha and Bokeo show an increase. An overview of the dynamics of the area under shifting cultivation in the northern provinces of Laos is given in Table4.
As can be seen in Table 4, the dynamics of landscapes dominated by shifting cultivation vary greatly between the provinces of northern Laos. Though it is beyond the scope of this study to analyze the drivers that could have led to these different dynamics, we reviewed relevant reports and journal articles in order to shed some light on the land cover changes. While such an analysis does not constitute evi-dence on the drivers of change, it does highlight the spatial variability of factors affecting shifting cultivation land-scapes in northern Laos and the importance of further re-search in this field.
Given the very swift market integration of more accessi-ble areas of northern Laos in the last decade, the decrease observed in shifting cultivation landscapes, especially in Luang Prabang and Oudomxay, is not surprising (Fox et al.2009). Around provincial capitals and along roads, the accessibility of domestic and international markets (espe-cially those of the neighboring countries of China, Thailand, and Vietnam) has led to an increase in the permanent culti-vation of not only rice, maize, and sesame but also of tree crops, and a consequent decrease in the practice of shifting cultivation (Alexander et al.2010; Leek2007). Meanwhile,
in the east of Laos, in Houaphanh Province, the reduction in the area where shifting cultivation prevails may very well be related to increased market integration. Infrastructure invest-ments and reduced taxes for exports to Vietnam have en-couraged farmers in Houaphan Province to switch to the production of cash crops like maize, vegetables, and even cotton (Viau et al. 2009). The land use planning and land allocation program, one of the government tools to stabilize and eradicate shifting cultivation, may also have affected the reduction of shifting cultivation. Still, the (unregulated) increase of market based economies has clearly been the dominant force behind changes in shifting cultivation in the majority of provinces in northern Laos (Ducourtieux et al. 2006; Lestrelin2010; Nowak et al.2008).
The provinces of Bokeo and Luang Namtha have been exposed to increasing market forces in a similar manner. Nevertheless, a net increase in shifting cultivation land-scapes was detected between the two periods considered in this paper (cf. Table4). This relates to the large expansion of smallholder rubber plantations since 2003 as a response to the Chinese demand for rubber (Shi 2008). According to Alton et al. (2005) rubber is being planted on land previ-ously under short-term fallow. During the first 2 years, rubber is intercropped with upland rice, but in the third year, rice yields decline. As income from rubber can only be generated after 7 years (when the trees are big enough for the latex to be tapped), farmers encroach on forest areas and previously unused land for food security reasons. This (temporary) expansion of the shifting cultivation areas from 2006–2009 related to the establishment of many young rubber plantations can be confirmed by our results. Aside from the expansion of rubber plantations, growing popula-tion pressure on allocated land is also a factor in the expan-sion of the shifting cultivation area mapped. Thongphanh et al. (2011) found that in Bokeo Province, people returned to shifting cultivation after the land allocation process due to the shortage of the allocated agricultural land. While no causality can be concluded from the data itself, the findings reviewed contribute great insight into the rise in the total area under shifting cultivation in Bokeo and Luang Namtha provinces.
It is interesting to note that Xayabouly Province in west-ern Laos, which has seen an extraordinary expansion of maize grown for export to the neighboring Thai market since early 2000, now shows a counter intuitive slight in-crease in shifting cultivation landscapes. Ducourtieux et al. (2005) indeed reveal a connection between the expansion of the shifting cultivation area, the expansion of maize produc-tion and the land allocaproduc-tion policy. Poorer families are forced to continue with shifting cultivation for food security reasons, to invest in allocated land (e.g. in chemical fertil-izers), or to pay taxes for allocated land. Additionally, after land allocation, the wealthier families tend to hold more Table 4 Changes in the shifting cultivation landscapes in the northern
provinces of Laos between the periods 2000–2006 and 2003–2009. The two time steps overlap as the methodology used to identify shift-ing cultivation landscapes required a time span of 7 years for a reliable delineation
Province Area covered by shifting cultivation landscapes 2000–2006 in % of total area Area covered by shifting cultivation landscapes 2003–2009 in % of total area Luang Prabang 56.3 39.8 Oudomxay 55.7 47.1 Phongsaly 28.9 25.6 Luang Namtha 27.1 36.5 Houaphan 23.7 22.1 Bokeo 21.6 30.3 Vientiane Prefecture 13.0 11.7 Xayabouly 7.8 9.8 Xiengkhouang 4.8 3.2 Bolikhamxay 1.7 2.2 Vientiane Municipality 1.1 4.6
land than the poor. When this land is not being used for cash crops, poorer families borrow it for upland rice cultivation. However, the mediocre quality and the insecure tenure of the borrowed plots force the families to clear protected forest hilltop areas as well. Even though there are fines for doing so, these are perceived more as the price of access to the land than penalties. Last but not least clandestine slash-ing is also performed by wealthier families in order to expand their agricultural land.
A similar pattern to that found in Xayabouly Province is expected to surface in Vientiane Province. In recent years, commercial agriculture has expanded rapidly along roads, replacing shifting cultivation with more permanent systems (largely maize based). Nevertheless, rice based shifting cul-tivation, which is still necessary for certain population seg-ments (see above), increased partly through encroachment into older bush fallows and occasionally into forest areas distant from roads.
Conclusion and Recommendations
Our presented approach is based on data that for the most part is available free of charge. As MODIS makes it possible to cover large areas, this approach has the potential to detect and monitor shifting cultivation dominated landscapes be-yond northern Laos at regular intervals. The main shortcom-ing is related to the limited time span covered by our study rather than to the methodology itself. Using the MODIS data in combination with landscape metrics makes it difficult to separate the recent smallholder conversion of forest or fal-low land to permanent agricultural land from the rotational characteristics of shifting cultivation. An analysis of a lon-ger time series could resolve this problem by showing whether the changes are of a permanent or a temporary nature. This could reveal whether shifting cultivation will disappear in Luang Namtha Province as soon as more rub-ber plantations mature to tapping age. Similarly, in Xayabouly Province, a longer time series could more accu-rately distinguish between those regions under shifting cul-tivation and those that are undergoing smallholder expansion of permanent agriculture.
The results of this study represent an innovation in gen-erating spatially coherent data on the extent and the dynam-ics of shifting cultivation landscapes. This allowed for the interpretation of the observed dynamics using information from reports and studies on land use and land cover trans-formations in northern Laos. The review of reports and journal articles indicates that in the center of northern Laos, policies and economic forces have led to the expected reduction in shifting cultivation landscapes, while in Luang Namtha Province, Chinese demand for rubber has led to a boom in rubber plantations and to a presumably temporary
expansion of shifting cultivation into formerly unused areas (Alexander et al.2010; Alton et al.2005; Fox et al.2009; Leek2007). Xayabouly Province showed similar dynamics, but the underlying causes seem to be related to land alloca-tion policy and to the Thai demand for maize there (Ducourtieux et al.2005).
Our findings underline the importance of further research related to the delineation of the extent and dynamics of shifting cultivation landscapes as well as the analysis of the underlying drivers of change. Using a longer time series of remote sensing data could improve the assessment of the dynamics of shifting cultivation landscapes. However, a longer time series also means more change trajectories and thus the inclusion of more classes in the analysis. Further research is required to assess how to best deal with the interlinked problems of overall classification accuracy, the greater number of classes, and the highly varying number of training areas within these classes available for classifica-tion. With regards to the drivers of change, the review of reports and articles did not allow a spatially consistent interpretation of the dynamics. Regardless, it indicated how different configurations of market forces and policies effect changes in the areas dominated by shifting cultiva-tion. On the basis of the existing spatially coherent data of the area dominated by shifting cultivation and its dynamics, further research should focus on spatially explicit analyses of the interactions between policies, socio-economic char-acteristics, and influences of the (international) markets in these areas. This would give insight into the trade-offs between the different factors that lead to transformation processes in the areas dominated by shifting cultivation.
Acknowledgments This work was supported by the Swiss National Centre of Competence in Research (NCCR) North–South and co-funded by the Swiss National Science Foundation (SNF) and the Swiss Agency for Development and Cooperation (SDC). Furthermore, this research has benefited from collaborations of the I-REDD+ project of the European Commission Framework Project (FP7-ENV-2010), The Agrobiodiversity Initiative in Lao PDR (TABI) project funded by SDC as well as a grant from the Danish Social Science Research Council, and the exchange within the Global Land Project (GLP)
References
Alexander, K. S., Millar, J., and Lipscombe, N. (2010). Sustainable development in the uplands of Lao PDR. Sustainable Development 18(1): 62–70.
Alton, C., Blum, D., and Sananikone, S. (2005). Para Rubber Study: Hevea Brasiliensis Lao PDR. GTZ, Lao German Program Rural Development in Mountainous Areas of Northern Lao PDR. Vientiane, Lao PDR
Bagan, H., Wang, Q., Watanabe, M., Yang, Y., and Ma, J. (2005). Land cover classification from MODIS EVI times-series data using SOM neural network. International Journal of Remote Sensing 26(22): 4999–5012.
Beck, P. S. A., Atzberger, C., Høgda, K. A., Johansen, B., and Skidmore, A. K. (2006). Improved monitoring of vegetation dynamics at very high latitudes: A new method using MODIS NDVI. Remote Sensing of Environment 100(3): 321–334. Clark, M. L., Aide, T. M., Grau, H. R., and Riner, G. (2010). A scalable
approach to mapping annual land cover at 250 m using MODIS time series data: A case study in the Dry Chaco ecoregion of South America. Remote Sensing of Environment 114(11): 2816– 2832.
Congalton, G. R., Balogh, M., Bell, C. A., Green, K., Milliken, J. A., and Ottman, R. (1998). Mapping and Monitoring Agricultural Crops and Other Land Cover in the Lower Colorado River Basin. Photogrammetric Engineering and Remote Sensing 64(11): 7. Cramb, R., Colfer, C., Dressler, W., Laungaramsri, P., Le, Q.,
Mulyoutami, E., Peluso, N., and Wadley, R. (2009). Swidden Transformations and Rural Livelihoods in Southeast Asia. Human Ecology 37(3): 323–346.
Darr, D. (2003). Farm forestry in semi-subsistence and monetary economies and its interdependency with the land tenure system -Case studies from central Laos [MSc Thesis]. Dresden University of Technology, Faculty of Forest, Geo and Hydro Sciences, Dresden, Germany
de Rouw, A., Soulilad, B., Phanthavong, K., and Dupin, B. (2005). In Bouahom, B., Glendinning, A., Nilsson, S., and Victor, M. (eds.), The adaptation of upland rice cropping to ever-shorter fallow periods and its limit. Poverty reduction and shifting cultivation stabilisation in the uplands of Lao PDR. NAFRI, Vientiane, pp. 139–148.
DeFries, R. S., Townshend, J. R. G., and Hansen, M. C. (1999). Continuous fields of vegetation characteristics at the global scale at 1-km resolution. Journal of Geophysical Research 104(D14): 16,911–16,923.
Delang, C. O. (2007). Ecological Succession of Usable Plants in an Eleven-Year Fallow Cycle in Northern Lao P.D.R. Ethnobotany Research and Applications 5: 331–350.
Dorren, L. K. A., Maier, B., and Seijmonsbergen, A. C. (2003). Improved Landsat-based forest mapping in steep mountainous terrain using object-based classification. Forest Ecology and Management 183(1–3): 31–46.
Ducourtieux, O. (2005). In Bouahom, B., Glendinning, A., Nilsson, S., and Victor, M. (eds.), Shifting cultivation and poverty eradication: A complex issue. Poverty reduction and shifting cultivation stabi-lisation in the uplands of Lao PDR. NAFRI, Vientiane, pp. 71–94. Ducourtieux, O., Laffort, J. R., and Sacklokham, S. (2005). Land Policy and Farming Practices in Laos. Development and Change 36(3): 499–526.
Ducourtieux, O., Visonnavong, P., and Rossard, J. (2006). Introducing Cash Crops in Shifting Cultivation Regions – The Experience with Cardamom in Laos. Agroforestry Systems 66(1): 65–76. Eklundh, L., and Jönsson, P. (2010). TIMESAT 3.0 - Software Manual.
Lund University, Lund.
Foody, G. M. (2002). Status of land cover classification accuracy assessment. Remote Sensing of Environment 80(1): 185–201. Fox, J., Fujita, Y., Ngidang, D., Peluso, N., Potter, L., Sakuntaladewi,
N., Sturgeon, J., and Thomas, D. (2009). Policies, Political-Economy, and Swidden in Southeast Asia. Human Ecology 37 (3): 305–322.
Fujisaka, S. (1991). A diagnostic survey of shifting cultivation in northern Laos: targeting research to improve sustainability and productivity. Agroforestry Systems 13(2): 95–109.
Giri, C. P., Pradhan, D., Ofren, R. S., and Kratzschmar, E. (1998). Land use/land cover change in South-East Asia. Environment Assessment Technical Reports. UNEP Environment Assessment Programme for Asia and the Pacific, Bangkok.
Hansen, M. C., Townshend, J. R. G., DeFries, R. S., and Carroll, M. (2005). Estimation of tree cover using MODIS data at global,
continental and regional/local scales. International Journal of Remote Sensing 26(19): 4359–4380.
Heinimann, A. (2006). Patterns of Land Cover Change in the Lower Mekong Basin: The relevance of mesoscale approaches [PhD Thesis]. University of Berne, Philosophisch-naturwissenschaftlichen Fakultät, Berne
Hett, C., Heinimann, A., and Messerli, P. (2011). Spatial assessment of carbon stocks of living vegetation at the national level in Lao PDR. Geografisk Tidsskrift-Danish Journal of Geography 111(1): 11–26.
Hird, J. N., and McDermid, G. J. (2009). Noise reduction of NDVI time series: An empirical comparison of selected techniques. Remote Sensing of Environment 113(1): 248–258.
Huete, A., Didan, K., Miura, T., Rodriguez, E. P., Gao, X., and Ferreira, L. G. (2002). Overview of the radiometric and biophys-ical performance of the MODIS vegetation indices. Remote Sensing of Environment 83(1–2): 195–213.
Inoue, Y., Qi, J., Olioso, A., Kiyono, Y., Horie, T., Asai, H., Saito, K., Ochiai, Y., Shiraiwa, T., and Douangsavanh, L. (2007). Traceability of slash-and-burn land-use history using optical sat-ellite sensor imagery: a basis for chronosequential assessment of ecosystem carbon stock in Laos. International Journal of Remote Sensing 28(24): 5641–5647.
Inoue, Y., Kiyono, Y., Asai, H., Ochiai, Y., Qi, J., Olioso, A., Shiraiwa, T., Horie, T., Saito, K., and Dounagsavanh, L. (2010). Assessing land-use and carbon stock in slash-and-burn ecosystems in trop-ical mountain of Laos based on time-series satellite images. International Journal of Applied Earth Observation and Geoinformation 12(4): 287–297.
Janz, A., van der Linden, S., Waske, B., and Hostert, P. (2007). imageSVM - A user-oriented tool for advanced classification of hyperspectral data using support vector machines. 5th EARSeL Workshop on Imaging Spectroscopy. Bruges, Belgium.
Jönsson, P., and Eklundh, L. (2002). Seasonality Extraction by Function Fitting to Time-Series of Satellite Sensor Data. IEEE Transactions on Geoscience and Remote Sensing 40(8): 1824– 1832.
Jönsson, P., and Eklundh, L. (2004). TIMESAT–a program for analyz-ing time-series of satellite sensor data. Computers & Geosciences 30(8): 833–845.
Knorn, J., Rabe, A., Radeloff, V. C., Kuemmerle, T., Kozak, J., and Hostert, P. (2009). Land cover mapping of large areas using chain classification of neighboring Landsat satellite images. Remote Sensing of Environment 113(5): 957–964.
Leek, K. E. (2007). Rural Livelihood Strategies and Natural Resources in Oudomxay, Lao PDR [MSc Thesis]. University of Natural Resources and Applied Life Sciences, Vienna; Lincoln University, Christchurch, NZ, Natural Resources Management and Ecological Engineering.
Lestrelin, G. (2010). Land degradation in the Lao PDR: Discourses and policy. Land Use Policy 27(2): 424–439.
Linquist, B., Trösch, K., Pandey, S., Phouynyavong, K., and Guenat, D. (2007). Montane Paddy Rice: Development and Effects on Food Security and Livelihood Activities of Highland Lao Farmers. Mountain Research and Development 27(1): 40–47. LSUAFRP (2003). Report on the Diagnostic Survey in Namo District:
Socioeconomics Component. Ministry of Agriculture and Forestry, National Agriculture and Forestry Research Institute, Lao Swedish Upland Agriculture and Forestry Research Programme, Vientiane.
Lu, D., Mausel, P., Brondizio, E., and Moran, E. (2004). Change detection techniques. International Journal of Remote Sensing 25(12): 2365–2407.
McGarigal, K., Cushman, S. A., Neel, M. C., and Ene, E. (2002). FRAGSTATS: Spatial Pattern Analysis Program for Categorical Maps. Computer software program produced by the authors at the
University of Massachusetts, Amherst. Available at the following w e b si t e : w w w. u m a s s . e d u / l a n d e c o / r e s e a r c h / f r a g s t a t s / fragstats.html.
Mertens, B., and Lambin, E. F. (2000). Land-Cover-Change Trajectories in Southern Cameroon. Annals of the Association of American Geographers 90(3): 467–494.
Mertz, O., Padoch, C., Fox, J., Cramb, R., Leisz, S., Lam, N., and Vien, T. (2009). Swidden Change in Southeast Asia: Understanding Causes and Consequences. Human Ecology 37(3): 259–264. Messerli, P., Heinimann, A., and Epprecht, M. (2009). Finding
Homogeneity in Heterogeneity—A New Approach to Quantifying Landscape Mosaics Developed for the Lao PDR. Human Ecology 37(3): 291–304.
Nowak, A., Southavilay, B., Souliyan, P., Bounmi, R., Ponepaseuth, I., Morel, N., Jullien, F., and Singkeuth, V. (2008). Participative Analysis of the Maize Supply Value Chain in Lao PDR. Ministry of Agriculture and Forestry (MAF), Programme of Capitalisation in Support of Rural Development Policy (PCADR), Central Unit (UC), Vientiane.
Padoch, C., Coffey, K., Mertz, O., Leisz, S. J., Fox, J., and Wadley, R. L. (2007). The Demise of Swidden in Southeast Asia? Local Realities and Regional Ambiguities. Danish Journal of Geography 107: 29–41.
Pan, X.-Z., Uchida, S., Liang, Y., Hirano, A., and Sun, B. (2010). Discriminating different landuse types by using multitemporal NDXI in a rice planting area. International Journal of Remote Sensing 31(3): 585–596.
Robichaud, W. G., Sinclair, A. R. E., Odarkor-Lanquaye, N., and Klinkenberg, B. (2009). Stable Forest Cover under Increasing Populations of Swidden Cultivators in Central Laos: the Roles of Intrinsic Culture and Extrinsic Wildlife Trade. Ecology and Society 14(1): 33.
Roder, W. (2001). Slash-and-Bum Rice Systems in the Hills of Northern Lao PDR: Description. Challenges, and Opportunities. International Rice Research Institute (IRRI). Los Baños (Philippines).
Roder, W., Phengchanh, S., and Maniphone, S. (1997). Dynamics of soil and vegetation during crop and fallow period in slash-and-burn fields of northern Laos. Geoderma 76(1–2): 131–144. Ruthenberg, H. (1971). Farming systems in the tropics. Clarendon,
Oxford.
Saito, K., Linquist, B., Keobualapha, B., Shiraiwa, T., and Horie, T. (2006). Farmers' knowledge of soils in relation to cropping prac-tices: A case study of farmers in upland rice based slash-and-burn systems of northern Laos. Geoderma 136(1–2): 64–74.
Schmidt-Vogt, D., Leisz, S., Mertz, O., Heinimann, A., Thiha, T., Messerli, P., Epprecht, M., Cu, P., Chi, V., Hardiono, M., and
Dao, T. (2009). An Assessment of Trends in the Extent of Swidden in Southeast Asia. Human Ecology 37(3): 269–280. Seidenberg, C., Mertz, O., and Kias, M. B. (2003). Fallow, labour and
livelihood in shifting cultivation: implications for deforestation in northern Lao PDR. Geografisk Tidsskrift-Danish Journal of Geography 103(3): 10.
Shi, W. (2008). Rubber boom in Luang Namtha a transnational per-spective. GTZ (German Technical Cooperation). Vientiane, Lao PDR
Sordo, M., and Zeng, Q. (2005). On Sample Size and Classification Accuracy: A Performance Comparison. Biological and Medical Data Analysis. In Oliveira, J., Maojo, V., Martín-Sánchez, F., and Pereira, A. (eds.), Lecture Notes in Computer Science. Istrail, S., Pevzner, P. and Waterman, M. Springer, Berlin, pp. 193–201. Sprenger, G. (2006). Out of the ashes: Swidden cultivation in highland
Laos. Anthropology Today 22(4): 9–13.
Thongphanh, D., Yoshida, S., Mizoue, N., and Kajisa, T. (2011). Impact of Land Use and Land Cover Change on Local Livelihood in Pha-Oudom District, Bokeo Province, Lao PDR. National Agriculture and Forestry Research Institute, Vientiane. van Noordwijk, M. (1999). Productivity of intensified crop—fallow
rotations in the Trenbath model. Agroforestry Systems 47(1): 223–237.
Viau, J., Keophosay, A., and Castella, J.-C. (2009). Impact of maize expansion on traditional rice production systems in Northern Lao PDR. A case study in Xiengkhor district, Huaphan province. Catch-Up Programme, National Agriculture and Forestry Research Institute, Vientiane.
Wästfelt, A., Tegenu, T., Nielsen, M. M., and Malmberg, B. (2012). Qualitative satellite image analysis: Mapping spatial distribution of farming types in Ethiopia. Applied Geography 32(2): 465–476. Watanabe, E., Sakurai, K., Okabayashi, Y., Lassay, N., and Alounsawat, C. (2004). Soil Fertility and Farming Systems in a Slash and Burn Cultivation Area of Northern Laos. Southeast Asian Studies 41(4): 519–537.
World Bank (2008). Policy, Market, and Agriculture Transition in the Northern Uplands. World Bank, Washington.
Yamamoto, Y., Oberthür, T., and Lefroy, R. (2009). Spatial identifica-tion by satellite imagery of the crop–fallow rotaidentifica-tion cycle in northern Laos. Environment, Development and Sustainability 11 (3): 639–654.
Yokoyama, S. (2004). Forest, Ethnicity and Settlement in the Mountainous Area of Northern Laos. Southeast Asian Studies 42(2): 132–156.
Yokoyama, S., Tanaka, K., and Phalakhone, K. (2006). Forest Policy and Swidden Agriculture in Laos. SEAGA Conference, Singapore.