NEWBORN SCREENING
Postprandial changes of amino acid and acylcarnitine
concentrations in dried blood samples
Ralph Fingerhut&Gabriel De Jesus Silva Arevalo&Matthias R. Baumgartner&
Johannes Häberle&Marianne Rohrbach&Andrés Weinfeld Ávalos Figueroa&
Elena María Dardón Fresse&Olga Leticia Polanco&Toni Torresani
Received: 2 March 2010 / Revised: 21 June 2010 / Accepted: 29 June 2010 / Published online: 21 July 2010 # SSIEM and Springer 2010
Abstract Blood sampling for newborn screening cannot be standardized as for example blood collection in adults after an overnight fast. Therefore the influence of postprandial changes and individual variation is valuable information for the assessment of sensitivity and specificity of newborn screening for certain disorders. We have analyzed 92 pairs of dried blood samples taken pre- and one hour postpran-dially, respectively. We have determined the mean increase in metabolite concentration and calculated its significance. Individual variation after an overnight fast in healthy adults (n = 3) was between 12 and 32% (SD). Postprandial increases of acylcarnitines were mostly not significant and not exceeding 10%. Postprandial increase of amino acids was highly significant for most proteinogenic amino acids, but not for all. With the collected data we were able to estimate that mainly decreased levels of methionine and, to
a lesser extent, of free carnitine could be “masked” by
postprandial increases of the respective metabolites, and could therefore lead to false negative results for the detection of disorders of cobalamin metabolism and carnitine transporter deficiency.
Abbreviations
Newborn screening NBS
Inborn errors of metabolism IEM
Dried blood samples DBS
Thyroid stimulating hormone TSH
17α-hydroxyprogesterone 17-OHP
Medium-chain triglycerides MCT
Standard deviation SD
Introduction
Newborn screening (NBS) for inborn errors of metabolism (IEM) and endocrinopathies is one of the most effective tools of preventive health care. NBS is normally regionally organized and ideally it should cover every newborn of the respective population of that region. Special screening tests in selected risk populations might be justified. However, due to the ever-increasing worldwide mobility and interra-cial marriages, these justifications will vanish over time. All NBS programs normally use native capillary or venous whole blood dried on special filter paper [the so-called dried blood spots, or dried blood samples (DBS)] taken by heal prick or venous puncture, respectively. The age at sampling might differ from program to program, e.g., between 36 and 72 h in Germany and the 6th day of life in England, and there are some differing recommendations concerning early sampling for babies discharged early, as well as the time of second sampling in preterms. These differences, such as age at blood collection, birth weight, or
Communicated by: Georg Hoffmann Competing interest: None declared.
R. Fingerhut
:
M. R. Baumgartner:
J. Häberle:
M. Rohrbach:
T. TorresaniUniversity Children`s Hospital, Zürich, Switzerland
G. De Jesus Silva Arevalo
:
A. W. Á. Figueroa:
E. M. D. Fresse:
O. L. PolancoMetabolic and genetic clinic, UNICAR-Foundation Aldo Castaneda, Pediatric Area,
Guatemala City, Guatemala Central America R. Fingerhut (*)
Swiss Newborn Screening Laboratory, University Children`s Hospital, Steinwiesstr. 75,
CH-8032 Zürich, Switzerland e-mail: [email protected]
gestational age, could be overcome by age, birth weight, and gestational-age-related reference values. However, only few publications on these data exist, and they often take only the variation of a single variable into account
(Cavedon et al 2005, Meyburg et al 2001, Chace et al
2003, Honzík et al. 2005, Corte and Venta 2010, Duran
2008, Matern 2008). The influence of some medications,
such as dopamine and steroids upon thyroid-stimulating
hormone (TSH) (Wilber and Utiger 1969, Brabant et al.
1989, Haugen 2009) and 17α-hydroxyprogesterone
(17-OHP), respectively, is well known (Rohrer et al.2003). For children who need a blood transfusion, all screening programs recommend that a first sample should be taken before transfusion and a second sample 3–14 days after the last transfusion. Nutrition is another factor that can influence metabolite concentrations, in particular, substitu-tion with carnitine, total parenteral nutrisubstitu-tion, high caloric glucose infusion (Shih1984), and other food additives such as medium-chain triglycerides (MCT), can influence the concentrations of free carnitine, acylcarnitines, and amino acids and might thereby cause false positive and false negative screening results. In the normal clinical chemistry setting, reference ranges for basal metabolite concentrations are normally related to blood collections after an overnight fast. Obviously, this strategy is impossible for newborns and NBS. Therefore, NBS programs give no recommenda-tions on the time of blood collection concerning the last feed. Due to international ethical guidelines, it is impossible to conduct studies in newborns and children to elucidate these open questions. For this study, we had the opportunity to reevaluate pairs of samples (DBS) from newborns that were taken pre- and 1-h postprandially to prove or disprove a portovenous shunt (DD: galactosemia) (Nishimura et al.
2004, Sodhi et al.2007). With the data presented here, we can estimate the variation of amino acids and acylcarnitines due to the fed/fasted state. This will also give a rough estimate of the bias that is included in all reference ranges for amino acids and acylcarnitines in NBS programs.
Materials and methods
Blood was taken by heel prick or venous puncture and spotted onto filter paper before and 1 h after feeding, either in the course of follow-up tests after a positive newborn screen for galactosemia in order to exclude or confirm a portovenous shunt (n=80), or from healthy volunteers (n= 12; age 19–48 years). Newborns and volunteers were healthy, on a normal diet and had no medications. None of the newborns in the study had galactosemia or any kind of liver disease. To determine individual variation of amino acids and acylcarnitines in the fasted state, capillary blood from three healthy volunteers was taken after an overnight
fast on 11, 13, and 15 consecutive days, respectively. Amino acids and acylcarnitines were measured after extraction with methanol, without derivatization, either with the Neogram kit from Perkin Elmer, on an API2000 tandem mass spectrometer from SCIEX; or with the Neobase kit from Perkin Elmer, on a TQD tandem mass spectrometer from Waters. Measured acylcarnitines and amino acids are listed in Table 1. For statistical analysis,
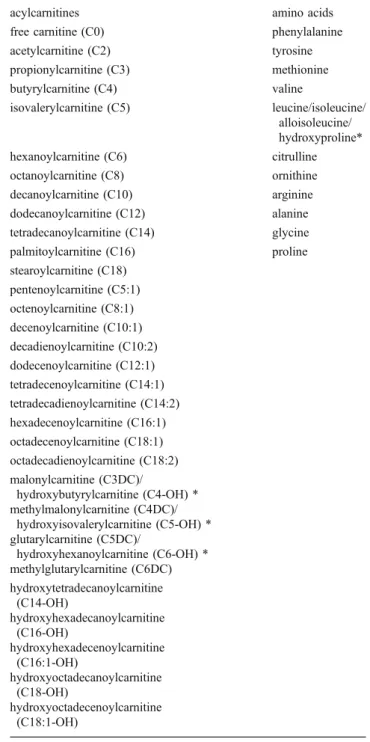
Table 1 List of acylcarnitines and amino acids measured from dried blood spots (DBS)
acylcarnitines amino acids
free carnitine (C0) phenylalanine acetylcarnitine (C2) tyrosine propionylcarnitine (C3) methionine butyrylcarnitine (C4) valine isovalerylcarnitine (C5) leucine/isoleucine/ alloisoleucine/ hydroxyproline* hexanoylcarnitine (C6) citrulline octanoylcarnitine (C8) ornithine decanoylcarnitine (C10) arginine dodecanoylcarnitine (C12) alanine tetradecanoylcarnitine (C14) glycine palmitoylcarnitine (C16) proline stearoylcarnitine (C18) pentenoylcarnitine (C5:1) octenoylcarnitine (C8:1) decenoylcarnitine (C10:1) decadienoylcarnitine (C10:2) dodecenoylcarnitine (C12:1) tetradecenoylcarnitine (C14:1) tetradecadienoylcarnitine (C14:2) hexadecenoylcarnitine (C16:1) octadecenoylcarnitine (C18:1) octadecadienoylcarnitine (C18:2) malonylcarnitine (C3DC)/ hydroxybutyrylcarnitine (C4-OH) * methylmalonylcarnitine (C4DC)/ hydroxyisovalerylcarnitine (C5-OH) * glutarylcarnitine (C5DC)/ hydroxyhexanoylcarnitine (C6-OH) * methylglutarylcarnitine (C6DC) hydroxytetradecanoylcarnitine (C14-OH) hydroxyhexadecanoylcarnitine (C16-OH) hydroxyhexadecenoylcarnitine (C16:1-OH) hydroxyoctadecanoylcarnitine (C18-OH) hydroxyoctadecenoylcarnitine (C18:1-OH)
SPSS 16.0 was used. Thet test for paired samples was used to calculate the significance of pre/postprandial differences of amino acid and acylcarnitine concentrations.
Results
The individual variation for free carnitine and acylcarnitines is negligible [standard deviation (SD) range for free carnitine 3.1–4.3 μmol/L; for acetylcarnitine 1.0– 2.5μmol/L; for all other acylcarnitines <0.3 μmol/L]. The individual variations for amino acids in the fasting state are
all between 12% and 32% (Table 2). The postprandial
increase was highly significant for most proteinogenic amino acids; for acylcarnitines, with some exceptions, there was no or no significant increase (see Table3).
To estimate the influence of postprandial increases on the recall rate for certain disorders, we calculated the centile for the respective metabolites from 84,665 initial NBS samples; day of sampling between 3 and 5 days. Since the 99.9th centile is a widely used cutoff in NBS programs, we took the concentrations of the respective metabolites at the 99.9th centile, added and accordingly subtracted the mean postprandial increase (pp-incr.) of the respective metabolite, and determined the centiles for these concentrations (see Fig. 1 for schematic description). These calculations give the“cut-off –×% pp-incr.” and “cut-off +×% pp-incr.” and
the respective number of samples [(n–) and (n+)] within
these ranges for each metabolite, respectively. Since we have no information on the fed/fasted state of the newborns, we assume that there is an equal distribution of samples taken from directly after feeding to samples taken shortly before feeding. We then simplified this model by assuming 50% of the samples (n–) and (n+) were taken preprandially and 50% postprandially, respectively. With this
simplifica-tion, we calculated the number of samples from the n–
group that would give a recall, if all samples would have been taken postprandially [=> (r+)], and the number of
samples from then+ group that would not give a recall, if all samples would have been taken preprandially [=> (r-)].
The difference of these two numbers (r + minus r–) in
relation to the total number of recalls result in a factor (see Table 3) that gives a rough estimate of the influence of postprandial changes on the recall rate. A factor >1 would argue in favor of a postprandial influence, a factor <1 would argue against it. For those analytes, where decreased concentrations have pathological relevance (methionine, free carnitine, octadecanoylcarnitine), we made the same calculation also for the 0.1st centile.
Discussion
Since blood collection for NBS cannot be standardized like blood collections in adults (normally drawn after an overnight fast), and because intensive studies in children are ethically not justifiable, all reference ranges generated for NBS comprise a certain bias. Our results derived by a model calculation can help to estimate the bias of amino acid and acylcarnitine determination to a certain extent. Amino acid and acylcarnitine concentrations may vary due to many different conditions: age, birth weight (Fingerhut et al. 2001), fed/fasted state, pre/postprandial time frame, individual variation, total parenteral nutrition, carnitine substitution. Some of these conditions can be controlled, such as age and birth weight, by age- and birth-weight-dependent reference ranges; others can be checked and dealt with by ordering a second sample after a certain time period (total parenteral nutrition, carnitine substitution). Individual variation is inherently included in reference ranges; however, the range of variation in a single individual is often unknown. Finally, fed/fasted state or pre/postprandial blood collection is uncontrollable in NBS. The presented data show that mainly proteinogenic amino acids have a highly significant postprandial increase, which is, of course, not surprising; however, also ornithine, a nonproteinogenic amino acid, shows significant increase. From the acylcarnitines, only free carnitine, propionylcar-nitine, and acylcarnitines associated to fat tissue (C18, C18:1) showed modest but slightly significant increases. The increase of propionylcarnitine might be explained by a combination of dietary uptake and systemic increase due to the increase in free carnitine. Increase of free carnitine alone cannot be the explanation, since these two metabo-lites are not consistently concurrently increased in the 84 sample pairs (data not shown).
However, for NBS, the increase in itself is not what is important, but the influence on the recall rate, false positive, and false negative results. To determine this influence, we attempted to estimate the impact on recall rates as described in the “Results” section and shown in Table3 and Fig.1.
compound SD (%) phenylalanine (p) 13.2–20.6 tyrosine (p) 17.8–20.2 methionine (p) 19.0–24.9 valine (p) 16.7–18.5 leucine (p) 17.4–20.8 citrulline (n) 12.3–23.8 ornithine (n) 22.4–31.6 arginine (p) 18.5–22.6 alanine (p) 17.1–25.8 glycine (p) 16.6–23.9 proline (p) 13.6–19.7 Table 2 Individual variation of
amino acids in the fasted state (range;n=3)
SD standard deviation, (p) pro-teinogenic amino acid,(n) non-proteinogenic amino acid
Fatty acid oxidation disorders and organic acidurias, which are detected through elevated concentrations of specific acylcarnitines, should be mainly unaffected. Only screening for propionic academia/methylmalonic acidemia might bear a borderline risk of increased recall and false positive rates. On the panel for NBS, so far, only two disorders are listed
that are detected through decreased levels of free carnitine or specific acylcarnitines. Carnitine transporter (OCTN2) deficiency with decreased free carnitine, and carnitine palmitoyl transferase I deficiency (CPT-I) with decreased levels of long-chain acylcarnitines (C16, C18). The detection rate of OCTN2 deficiency is known to be not
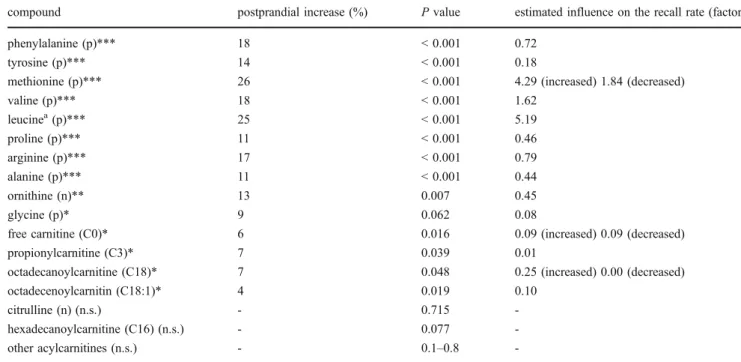
Table 3 Mean postprandial increase of amino acids and acylcarnitines
compound postprandial increase (%) P value estimated influence on the recall rate (factor)
phenylalanine (p)*** 18 < 0.001 0.72
tyrosine (p)*** 14 < 0.001 0.18
methionine (p)*** 26 < 0.001 4.29 (increased) 1.84 (decreased)
valine (p)*** 18 < 0.001 1.62 leucinea(p)*** 25 < 0.001 5.19 proline (p)*** 11 < 0.001 0.46 arginine (p)*** 17 < 0.001 0.79 alanine (p)*** 11 < 0.001 0.44 ornithine (n)** 13 0.007 0.45 glycine (p)* 9 0.062 0.08
free carnitine (C0)* 6 0.016 0.09 (increased) 0.09 (decreased)
propionylcarnitine (C3)* 7 0.039 0.01
octadecanoylcarnitine (C18)* 7 0.048 0.25 (increased) 0.00 (decreased)
octadecenoylcarnitin (C18:1)* 4 0.019 0.10
citrulline (n) (n.s.) - 0.715
-hexadecanoylcarnitine (C16) (n.s.) - 0.077
-other acylcarnitines (n.s.) - 0.1–0.8
-(p) proteinogenic amino acid, (n) nonproteinogenic amino acid, n.s. not significant (p>0.05) *Significant (p≤0.05) ;,**very significant ( p≤0.01) , ***highly significant (p≤0.001)
aSum of isobaric amino acids (leucine + isoleucine + alloisoleucine + hydroxyproline) bSum of isobaric acylcarnitines (glutarylcarnitine + hydroxyhexanoylcarnitine)
Fig. 1 Model for estimating the influence of postprandial metabolite changes:pp-incr. postprandial increase, cut-off –×% pp-incr. centile for the concentration of the respective metabolite at the 99.9th centile minus the percentage of respective postprandial increase,cut-off + ×% pp-incr. centile for the concentration of the respective metabolite at the 99.9th centile plus the percentage of respective postprandial increase, (n–)
number of samples within the concentration range for the respective between the 99.9th centile and the centile corresponding to cut-off–×% pp-incr.,(n+) number of samples within the concentration range for the respective between the 99.9th centile and the centile corresponding to cut-off +×% pp-incr
100% sensitive, which can be due to postprandial increase of free carnitine; however, a more probable explanation might be the different body stores of free carnitine, which are dependent on the maternal levels of free carnitine during pregnancy and lactation. The sensitivity for CPT-I deficiency should not be influenced, since the most specific metabolite ratio [C0/(C16 + C18)] (Fingerhut et al.2001) is more or less unaffected, because both denominator as well as numerator will increase postprandially.
For amino acidemias and urea-cycle disorders, the situation is more complex due to the greater number of amino acids that are increased postprandially. Disorders that might be affected are hyperphenylalaninemia (PKU/HPA), homocystinuria, disorders of cobalamin metabolism, maple syrup urine disease (MSUD), arginase deficiency, and hyperornithinemia. Since homocystinuria, with methionine as the marker metabolite, has an extremely low sensitivity when NBS samples are taken during the first 4 days of life, this can be neglected. The influence on PKU/HPA, MSUD, arginase deficiency, and hyperornithinemia can also be neglected, since postprandial increases are not specific, and the interpretation of the whole amino acid profile with slight increases of several amino acids can avoid unneces-sary recalls. Only disorders of cobalamin metabolism, which are detected by decreased levels of methionine, are likely to give false negative results due to a possible postprandial increase of methionine into the low normal range. This is especially probable since methionine shows the highest postprandial increase of all metabolites tested.
In conclusion, postprandial increases of amino acids and acylcarnitines are partially significant and might be the cause for some false positive screening results. However, the danger for false negative results can only be suggested for disorders of cobalamin metabolism and, to a lesser extent, for OCTN2 deficiency, where decreased levels of methionine and free carnitine, respectively, are the only marker metabolites.
References
Brabant A, Brabant G, Schuermeyer T et al (1989) The role of glucocorticoids in the regulation of thyrotropin. Acta Endocrinol 121:95–100
Cavedon CT, Bourdoux P, Mertens K et al (2005) Age related variations in acylcarnitine and free carnitine concentrations measured by tandem mass spectrometry. Clin Chem 51:745–752 Chace DH, Pons R, Chiriboga CA et al (2003) Normative data by electrospray tandem mass spectrometry. Pediatr Res 53:823–829 Corte Z, Venta R (2010) Biological variation of free plasma amino
acids in healthy individuals. Clin Chem Lab Med 48:99–104 Duran M (2008) Amino Acids. In: Blau N, Duran M, Gibson KM
(eds) Laboratory Guide to the Methods in Biological Genetics. Springer, Berlin-Heidelberg, pp 53–89
Fingerhut R, Röschinger W, Muntau AC et al (2001) Hepatic carnitine palmitoyltransferase I deficiency: Acylcarnitine profiles in blood spots are high specific. Clin Chem 47:1763–1768
Haugen BR (2009) Drugs that suppress TSH or cause central hypothyroidism. Best Pract Res Clin Endocrinol Metab 23:793– 800
Honzík T, Chrastina P, Hansíková H et al (2005) Carnitine concen-trations in term and preterm newborns at birth and during the first days of life. Prague Med Rep 106:297–306
Matern D (2008) Acylcarnitines, including in vitro loading tests. In: Blau N, Duran M, Gibson KM (eds) Laboratory Guide to the Methods in Biological Genetics. Springer, Berlin-Heidelberg, pp 171–206
Meyburg J, Schulze A, Kohlmueller D, Linderkamp O, Mayatepek E (2001) Postnatal changes in neonatal acylcarnitine profile. Pediatr Res 49:125–129
Nishimura Y, Tajima G, Dwi Bahagia A et al (2004) Differential diagnosis of neonatal mild hypergalactosaemia detected by mass screening: Clinical significance of portal vein imaging. J Inherit Metab Dis 27:11–18
Rohrer TR, Gassmann KF, Pavel ME, Dörr HG (2003) Pitfall of newborn screening for congenital adrenal hyperplasia due to 21-hydroxylase deficiency. Biol Neonate 83:65–68
Shih VE (1984) Maple-Syrup-Urine Disease. N Engl J Med 310:596– 597
Sodhi KS, Thapa BR, Walia A, Khandelwal N (2007) Congenital intrahepatic porto-systemic venous shunt with galactosemia. Indian J Gastroenterol 26:87–88
Wilber JF, Utiger RD (1969) The effect of glucocorticoids on thyrotropin secretion. J Clin Invest 48:2096–2103