DOI: 10.1007/s00340-006-2367-y Lasers and Optics
c. fischer∗ r. bartlome m.w. sigristu
The potential of mid-infrared
photoacoustic spectroscopy for the detection
of various doping agents used by athletes
Institute for Quantum Electronics, ETH Zurich, Schafmattstr. 16, 8093 Zurich, SwitzerlandReceived: 30 March 2006/Revised version: 18 May 2006 Published online: 21 July 2006 • © Springer-Verlag 2006 ABSTRACT The feasibility of laser-photoacoustic measure-ments for the detection and the analysis of different isolated doping agents in the vapour phase is discussed. To the best of our knowledge, this is the first time that photoacoustic vapour-phase measurements of doping substances have been presented. Spectra of different doping classes (stimulants, anabolica, di-uretica, and beta blockers) are shown and discussed in terms of their detection sensitivity and selectivity. The potential of laser spectroscopy for detecting the intake of prohibited substances by athletes is explored.
PACS07.57.Ty; 33.20.Ea; 82.80.Kq
1 Introduction to doping agents and gas sensing
In recent years, the illegal intake of doping sub-stances at minor and major sporting events has spread a dark shadow over these happenings. At the same time, new sub-stances ever so often appear and are being used by athletes in different sports. The search for improved techniques and new methods to detect doping substances has become an im-portant field of research in doping prevention. Currently, the detection of the intake of forbidden substances is carried out in one of 33 accredited laboratories worldwide (as of June 2005) [1] and involves careful analysis of urine samples by means of gas chromatography–mass spectrometry (GC-MS) and liquid chromatography–mass spectrometry (LC-MS) [2]. Taking into account the elaborate sample-preparation and measurement procedure (different for each substance class), the actual time for the measurement itself, and a possible laboratory backlog, such analyses can take several weeks be-fore the final results are known. Faster screening techniques with reduced sample-preparation times and lower costs (ei-ther for the equipment or operating expenses) would (ei-therefore be highly welcome. Furthermore, the concentration level of doping substances in urine is constantly decreasing as the ath-letes, their coaches, and medical advisors are more cautious, making detection a more difficult task. A more sensitive and highly reliable detection technique is therefore desirable. u Fax: +41-44-6331230, E-mail: [email protected]
∗Now with: Agroscope Reckenholz Tänikon (ART), Reckenholzstrasse 191, 8046 Zurich, Switzerland
Laser-based spectroscopic trace-gas sensing techniques have proved to be fast as well as reliable in measurements of small concentrations of gaseous substances in different fields including environmental sensing, air-pollution monitor-ing, industrial process control, agriculture, explosives detec-tion, and recently even in medicine [3–9]. Different detection schemes and laser sources have been in use. One of the major advantages of laser spectroscopy is its noninvasive charac-ter. In addition, the molecules (or atoms) neither alter their shape nor the composition, which is not the case in mass-spectrometry or gas-chromatography analysis.
Photoacoustics (PA) is a spectroscopic technique in which the signal is measured by means of microphones [10]. This detection scheme has the advantage that the magnitude of the detected signal is proportional to the absorbed laser power (direct absorption technique) and that the sensor (i.e. the mi-crophone) itself has a wavelength-independent responsivity. The same sample cell can thus be used at different wave-lengths as long as the window material used to seal off the cell is transparent at the wavelengths of interest. Furthermore, PA laser spectroscopy proved to be both highly selective and sensitive [5, 7–11].
In this paper we explore the potential of laser PA spec-troscopy for the detection of isolated, pure doping substances taken by athletes. The feasibility for sensing small concentra-tions of such large organic molecules in the vapour phase is demonstrated.
2 Experimental set-up
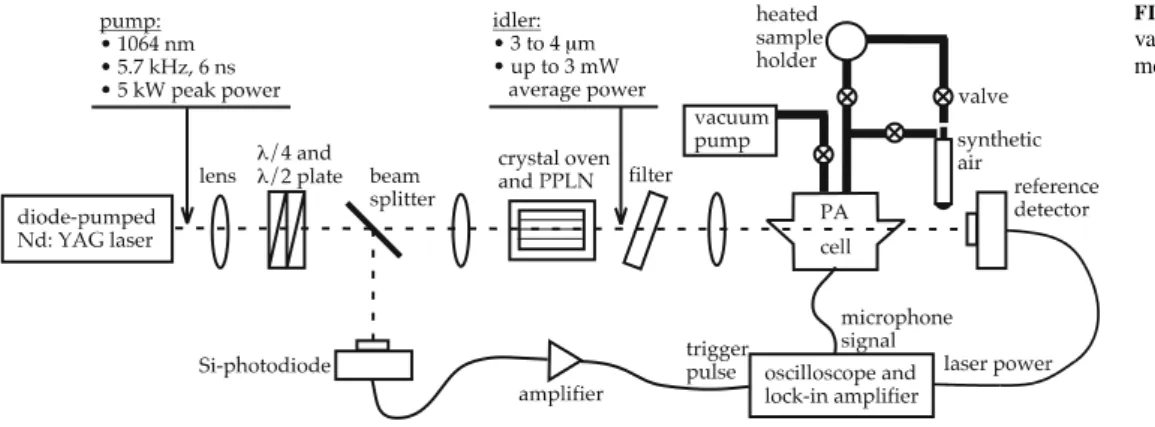
As shown in Fig. 1, the experimental set-up con-sists of three different parts: the laser, the sample holder, and the PA detector. A home-built PA cell was described in de-tail previously [9, 12] and was here used with a different laser system.
The laser system used in this study is an optical parametric generation and amplification (OPG/OPA) system. The pump laser is a diode-pumped pulsed (6-ns pulse duration), high peak power (5 kW) Nd:YAG laser in nonplanar ring-oscillator (NPRO) configuration. The pulse-repetition rate of 5.72 kHz coincides with the first longitudinal resonance frequency of the PA cell. The laser beam is focussed onto the nonlinear crystal using a set of lenses.
A 5-cm-long periodically poled LiNbO3 (PPLN)
nonlin-FIGURE 1 Experimental set-up for vapour-phase photoacoustic measure-ments of doping substances
ear frequency conversion process generates an idler beam with a line width (FWHM) of 240 GHz (8 cm−1 or 8.7 nm at 3.3 µm) and an average power of up to several mW. The line width was determined with a sample of 100-ppm me-thane diluted in synthetic air by measuring (at atmospheric pressure and room temperature) at a wavelength of approxi-mately 3.3 µm (3050 cm−1) (see Fig. 2). At this wavelength, the width of the methane lines (as indicated by methane ab-sorption lines calculated using the HITRAN database [13]) is much narrower than that measured. Therefore, the intrinsic line width of methane can be neglected in the calculation of the line width of the laser pulses.
The tuning of the wavelength is achieved by changing the temperature of the PPLN crystal. A temperature change of 100◦C results in a wavelength change of about 120 nm (106 cm−1around 3.3 µm) and can be carried out in about one hour depending on the step width and the averaging time for each data point. The line width and the tuning characteristics of the OPG laser source are suitable for measurements of large molecules with expected broad absorption features as shown in this investigation.
As most of the doping substances are solids or liquids when stored at room temperature and as the PA cell was de-signed for gas measurements (i.e. it can only be used for
FIGURE 2 Spectroscopic measurement of the line width of the OPG/OPA system recorded with 100-ppm methane diluted in synthetic air at ambient pressure and temperature
measurements of gaseous substances), the issue of sample preparation requires special attention. Increasing the vapour pressure of the different doping substances can be achieved by heating them without altering their chemical composi-tion. Care needs to be exercised not to overheat substances above sublimation and/or vaporisation points as in such a case the chemical decomposition of the substances cannot be ex-cluded. The samples are thus placed in a double-walled glass vessel that can be heated in a silicone-oil bath to temperatures up to 150◦C.
Based on the theory of modulated resonant photoacoustics and pulsed resonant photoacoustics with single pulses [10], the PA signal is expected to be proportional to the absorbed laser power also for the case of ns pulses at repetition rates cor-responding to the acoustic resonances in the PA cell. There-fore, the minimum power needed for a signal detection de-pends on both the concentration of the substances under in-vestigation and on their absorption cross sections. The meas-urements indicate that for most substances measured the min-imum average laser power required is just above 0.1 mW. The microphones are specified for operational temperatures as high as 60◦C, which means that (i) either the PA cell must be kept at a temperature lower than that of the sample-preparation vessel (heated to 150◦C) or (ii) that a special
cooling system for the microphones is needed at the risk of condensation at the microphones. Best results were obtained when operating the PA cell at 60◦Cusing an electric heating ‘belt’ around the PA cell.
The measurements were carried out at a total pressure of 500 mbar. Further lowering of the total pressure would result in a decreased microphone responsivity and thus a lower de-tection sensitivity [14].
The whole measurement procedure is automated and com-puter controlled.
3 Experimental procedures
Loading of the samples into the PA cell proceeded according to the following protocol: first, both the sample holder and the PA cell were evacuated several times and re-filled with synthetic air (79.5% N2, 20.5% O2) to ensure that both are free of impurities. Then, the sample (in liquid or solid state) was placed into the sample holder (all at room tem-perature) and the above-described procedure was repeated. After that, the evacuated cell and sample holder were filled with synthetic air to a total pressure of 500 mbar. The valve between the PA cell and the sample holder was then closed, and the sample and PA cell were heated to their correspond-ing operatcorrespond-ing temperature. At the same time, the PA cell was evacuated again. Once the sample and the PA cell both reached their operating temperature, the valve between the PA cell and the sample holder was opened, and the vapour of the doping substances diluted in synthetic air was allowed to en-ter the PA cell. Finally, synthetic air was admitted to the PA cell through the sample holder to obtain a total pressure of 500 mbar.
Each spectrum shown below is a result of various runs taken on different days in order to ensure reproducibility. Recording the spectrum over the spectral range shown in Figs. 3–6 takes about 2 to 3 h depending on the step width and on both the averaging number and the averaging time for each data point. During all measurements, 400 single measurements have been averaged for each data point plot-ted in the spectra shown. In addition, every data point is an average of its adjacent 25 data points. Such averaging is possible as the line width of the OPG/OPA laser source is much larger than the step width between consecutive data points.
4 Experimental results
Doping agents are classified in different classes ac-cording to their effect on the human body, e.g. stimulants, anabolica, diuretica, and beta blockers. In order to demon-strate the feasibility of PA measurements on large organic doping molecules, several doping substances [15] from the four major classes of substances mentioned above were ana-lysed (in their pure form) in the vapour phase. The measured PA signals were normalized to the laser power and expressed as absorption strength in arbitrary units. The recorded spec-tra of the substances shown below were scaled in the sense that the same normalized PA signal corresponds to the same absorption strength, thereby allowing for a comparison of ab-sorption strengths of different doping substances under the same experimental conditions.
4.1 Stimulants
Stimulants are substances having an effect on the human body similar to that of stress hormones. Well-known substances in the class of stimulants are: amphetamines, ephedrine, cocaine, and strychnine. Being stimulating drugs, they are usually taken shortly before (or even during) the com-petition and increase the kinetic activity and the willingness to take risk. In addition, they suppress fatigue and, unfortunately, also the sense of the limit of personal capacity. The intake of stimulants has also led to occasional death of athletes.
Figure 3 shows the measured spectrum of nikethamide (C10H14N2O, CAS number: 59-26-7; melting point: 25◦C) in the vapour phase [16]. Nikethamide is one of the few sub-stances that are liquid at room temperature. Thus, the sample holder was slightly heated (to 60◦C), i.e. to the same tempera-ture as the PA cell, which was loaded as described above. The amount of sample placed into the holder was about 175 mg. Figure 3 shows distinct absorption features. The recorded spectrum is orders of magnitude higher than the minimum detectable absorption using the PA detection scheme, as can clearly be seen from the noise level in Fig. 3.
In addition to the measured spectrum of nikethamide, Fig. 3 also shows a spectrum of water vapour calculated from the HITRAN database [13]. The sample of nikethamide used for the measurement is of spectroscopic grade; the most likely impurity that might still occur (apart from chemical decom-position or from oxidation) originates from water vapour (as it is difficult to eliminate water vapour altogether from the PA cell). Furthermore, the doping substances might also be hydrophilic. Figure 3 demonstrates that some of the peaks measured between 3000 and 3070 cm−1might be explained by the presence of water vapour, which is not the case for the major peaks occurring at 2955 cm−1and 3005 cm−1.
In Fig. 3, the measured spectrum is compared to a FTIR spectrum of a thin film taken from the FDM database [17] that has a spectral resolution of about 2 cm−1. Despite the higher resolution of the thin-film spectrum, the observed absorption features of nikethamide in the vapour phase are narrower than the absorption features of the thin-film spectrum.
FIGURE 3 Experimentally obtained vapour-phase spectrum of nikethamide. The spectrum was recorded with the photoacoustic cell at 60◦C and a total pressure of 500 mbar. The measured spectrum is compared to a FTIR spec-trum of nikethamide in the condensed phase [17]
For the spectra listed in the FDM database no experimen-tal details such as measured concentrations, path lengths, etc., are given. Thus, for easier comparison, the spectrum from the FDM database has been scaled to a comparable absorption strength as the PA spectrum. Interesting to note is the simi-larity of the wavelength range of absorption despite the shift between the two spectra, as clearly seen in Fig. 3, where the vapour-phase spectrum appears to be slightly shifted towards shorter wavelengths. For molecules without intermolecular H bonding, one reason might be the lack of a reaction field in the gas phase [18], resulting in a shift of several bands. Further-more, internal rotations, which are hindered in the solid phase at ambient temperature, are activated in the vapour phase. Therefore, spectra taken in the vapour phase and in the solid phase may significantly deviate from each other. In general, a wavelength shift could also arise from the difficulty of cal-culating exact wavelengths of the OPG/OPA system, because the wavelength depends on the length of the domains in the periodically poled LiNbO3crystal (specified by the tempera-ture), and on the positioning of the crystal in the pump laser beam. The fact that the spectrum shown is composed of sev-eral recordings taken on different days (after evacuating and refilling the PA cell and finely adjusting the OPG/OPA laser source) in order to prove reproducibility implies that the laser source alone cannot account for the significant wavelength shift of> 8 cm−1.
4.2 Anabolica
Anabolica are substances similar to the male hor-mone testosterone, both in terms of their effects on the human body and their chemical composition. Most prominent sub-stances in the class of anabolica are stanozolol, nandrolone, and dianabol. Anabolica differ from other classes of doping substances in the sense that they actually improve the per-formance of athletes by increasing muscle mass and decreas-ing body fat. Typical side effects are the masculinisation of the body in women and the feminisation in male bodies.
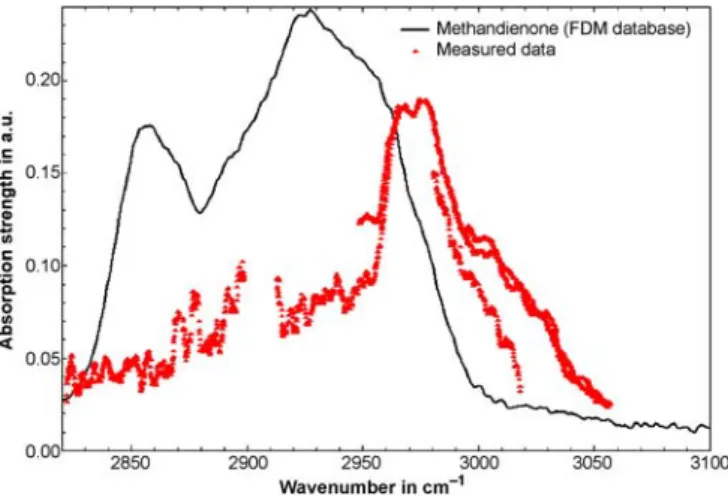
Methandienone (C20H28O2; CAS number: 72-63-9; melt-ing point 165◦C) was analysed as a representative in the class of anabolica. Figure 4 shows the obtained PA spectrum.
As the melting point of methandienone at ambient pres-sure is 165◦C, the substance cannot be completely melted with the present set-up. This results in a low vapour pressure and hence a lower concentration of methandienone in the PA cell. Therefore, the signal-to-noise ratio in the measured spec-trum is lower and the absorption features are less pronounced than for nikethamide (melting-point temperature 25◦C). Due to the fact that little is known about their adsorption behaviour on cell walls, it is difficult to estimate the concentration of the doping substances in the PA cell. After evacuating and refill-ing the PA cell several times, 179 mg of the initially 199 mg methandienone remained in the sample holder, indicating that only a small fraction of the original sample evaporated. In addition, a fraction of the substance recondensed on the walls and the cover of the sample holder. Despite the expected low concentration, it was possible to measure the absorption fea-tures of methandienone in the wavelength range around 3µm. The obtained PA spectrum differs significantly from the meas-ured spectrum of nikethamide. This confirms that measmeas-ured
FIGURE 4 Experimentally obtained spectrum of gaseous methandienone. The spectrum was recorded with the photoacoustic cell maintained at 60◦C and a total pressure of 500 mbar. The measured spectrum is compared to a FTIR spectrum of methandienone in the solid phase [17]
absorption bands actually originate from the species under in-vestigation rather than from impurities (such as water vapour, for example).
The obtained vapour-phase spectrum of methandienone is compared to an available solid-phase FTIR spectrum [17]. Comparing of the two spectra is difficult since to the best of our knowledge methandienone (and most other measured doping substances) has been measured neither in the gas nor in the vapour phase yet. The two spectra show certain simi-larities, although they were taken in different states of aggre-gation. Again, a wavelength shift between the two spectra is observed and in addition the absorption features in the vapour phase appear more narrow than in the solid phase.
4.3 Diuretica
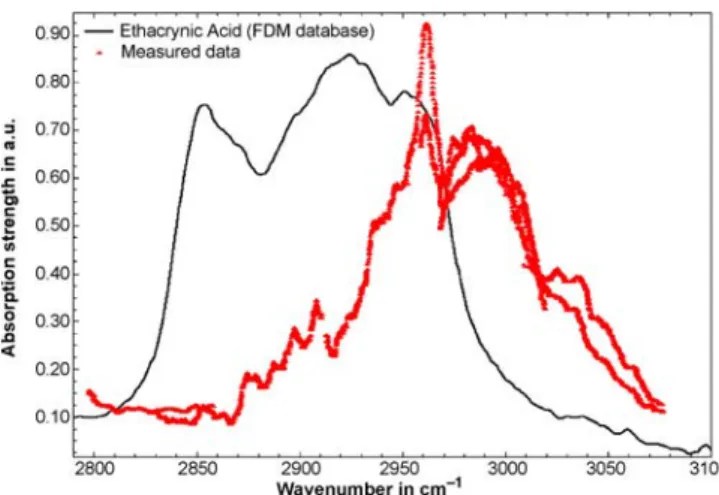
Diuretica are substances that increase the amount of water excreted by the kidneys. Strong diuretica result in rapid loss of water and consequently in weight reduction (as much as 3 kg within hours). In sports, diuretica are not ac-tually used to improve the performance of an athlete, but instead are misused in order to reach a lower-weight class (e.g. in rowing or boxing) or to dilute urine thereby mask-ing earlier intake of prohibited substances. The vapour-phase spectrum of ethacrynic acid (C13H12Cl2O4; CAS number: 58-54-8; melting-point temperature: 122◦C) as an example of a diuretic is shown in Fig. 5. The temperature in the sam-ple holder was about 130◦C. Figure 5 compares the recorded spectrum with a FTIR spectrum of solid-state ethacrynic acid (no spectrum of ethacrynic acid in the vapour or gas phase is available for comparison purposes). Again, the vapour-and solid-phase spectra show absorption features in a similar wavelength range. Again, the measured vapour-phase spec-trum is shifted towards a slightly shorter wavelength.
The measured spectrum depicted in Fig. 5 shows distinct and strong absorption features. Ethacrynic acid melted in the sample holder and probably generated a higher vapour pres-sure than methandienone. The noise level is orders of mag-nitudes lower than that of the spectrum shown, despite the fact that the spectrum was recorded at a cell temperature
FIGURE 5 Experimentally obtained spectrum of gaseous ethacrynic acid. The spectrum was recorded with the photoacoustic cell maintained at 60◦C and a total pressure of 500 mbar. The measured spectrum is compared to a FTIR spectrum of ethacrynic acid in the solid phase [17]
of 60◦C(below the melting-point temperature of ethacrynic acid). This indicates that ethacrynic acid either has a high vapour pressure or that the absorption features are strong in the mid-infrared wavelength range.
4.4 Beta blockers
Beta blockers are substances known for calming the human mind by inhibiting nervousness and stage fright. Beta blockers are only prohibited in some disciplines that call for inner peace and concentration.
As an example, we have analysed the spectral absorption features (see Fig. 6) of metoprolol tartrate (C15H25NO3, CAS number: 51384-51-1) in the vapour phase. The recorded spec-trum is compared to a solid-phase FTIR specspec-trum from the FDM database [17]. As far as the wavelength range of ab-sorption is concerned, the two spectra agree. The abab-sorption features are more pronounced in the vapour phase and appear less wide than in the solid phase, as expected from the previ-ous measurements.
FIGURE 6 Experimentally obtained spectrum of gaseous metoprolol tar-trate. The spectrum was recorded with the photoacoustic cell maintained at 60◦C and a total pressure of 500 mbar. The measured spectrum is compared to a FTIR spectrum of metoprolol tartrate in the solid phase [17]
The exact melting point of metoprolol tartrate is not spec-ified by the supplier of the substance [15]. In the sample holder, this substance began to melt at temperatures just below 120◦C, which is similar to that observed for ethacrynic acid. The measured absorption features of metoprolol tartrate are twice as strong as those of ethacrynic acid, indicating that the latter component has a stronger absorption coefficient and/or a higher vapour pressure.
5 Discussion and conclusion
The outcome of our investigations shows that an optical parametric generation and amplification (OPG/OPA) laser source combined with PA detection is suitable for selec-tive measurements of large organic compounds characterised by melting points below 200◦C. As these large molecules ex-hibit absorption bands rather than single absorption lines, the large line width of the laser source does not inhibit measure-ments. The advantage of the OPG/OPA system when com-pared to, for example, a difference-frequency laser system is the simplicity of the set-up and the fast tuning using tempera-ture tuning [9]. The average power of the OPG/OPA laser source (typically in the mW range) is sufficiently high to gen-erate detectable PA signals.
Based on measured absorption features, a single wave-length scan from 2800 to 3100 cm−1(3220–3570 nm) might enable the identification of the doping substance from the measured absorption features without the need for further analysis. The wavelength range can be extended by using other grating periods of the PPLN crystal. For the meas-urements presented here only three out of eight grating periods have been used. An extension of the wavelength range can easily be accomplished using the other gratings, and is only limited by the absorption of the nonlinear ma-terial and antireflection coatings on the end facets of the crystal. Whether or not laser spectroscopy is really faster than GC-MS or LC-MS depends critically on the sample-preparation time. Further analysis using urine-like samples containing any doping substances should provide further in-sight into the sample preparation needed. The advantage is that only a single scan over the entire wavelength range is needed for the detection whereas for conventional investiga-tions the samples need to be analysed separately for each class of substances.
The experimental results clearly demonstrate the feasibil-ity of selective vapour-phase measurements of doping stances. A comparison of the obtained spectra of the sub-stances investigated reveals that the absorption features for different substances occur at similar wavelengths (as ex-pected, since always C–H stretch vibrations are excited). But, the spectral features of each substance differ clearly with re-spect to their shape. A comparison of the re-spectra from, for example, nikethamide, methandienone, and ethacrynic acid reveals that the three spectra are clearly distinguishable if a measurement over the spectral range shown in Figs. 3–5 is carried out.
Interferences are mainly expected from water-vapour absorption lines. A comparison with the calculated absorp-tion spectrum of water vapour implies that the measured spectra do not originate from water vapour (see Fig. 3).
Since only pure doping substances have been studied so far, whether or not the selectivity is sufficient for the an-alysis of doping substances present in urine, other human excreta (such as saliva or sweat), or exhaled breath remains yet to be demonstrated. Spectral analyses of as many dop-ing agents as possible and of other components present in urine or other human excreta with potential absorption interference need to be performed to answer this crucial issue.
The fact that absorption lines occur at different wave-lengths allows for a distinction between the different sub-stances. All measured agents exhibit absorption bands rather than single absorption lines, as expected. Thus, for an assign-ment of a certain substance, it is necessary to take the entire spectrum (over the shown wavelength range). As the recorded spectra show specific absorption wavelengths and features, a recording of the spectrum should enable a correct assign-ment of the measured substance. Measureassign-ments at a single or a few isolated wavelengths will not be sufficient to identify the substance of interest. The differentiation between doping agents with similar chemical compositions, e.g. of different doping substances from the same class, requires further inves-tigation. These preliminary results, though, indicate clearly that the absorption features of different doping substances are specific enough for an unequivocal determination of the substance.
Another issue is the sensitivity of the spectrometer. In our measurements a mass of about 150 mg to 200 mg of the pure doping substances was heated. About 10% of that amount actually evaporated. Most of it recondensed visibly on the walls and the cover of the sample holder. Thus, even lower amounts are sufficient for a detection. After heating and sev-eral repetitive loadings of the PA cell with vapour of the doping substances, only a few mg (or even less) actually evaporated and entered the PA cell. For all measured sub-stances absorption features were well above the minimum detectable level, indicating a sufficient sensitivity. It is diffi-cult to determine the absolute concentration in the PA cell as little is known about the absorption cross sections as well as the adhesion tendency of these substances. Thus, at present no detection limits can be given. In order to explore the po-tential of the spectrometer for doping analysis in sports, it will be necessary to analyse one or several agents in quan-tities as they actually occur in urine or other human exc-reta. The minimum required performance limits given by the World Antidoping Agency WADA [19] are 0.2–0.5 µg/ml for stimulants and beta blockers and 1–10 ng/ml for anabol-ica, i.e. probably orders of magnitude below the concentra-tions present in the sample holder during our measurements
(the actual concentration in the PA cell itself could not be determined).
In conclusion, these preliminary results of spectroscopic vapour-phase measurements reveal that PA spectroscopy of large organic molecules (as the presented doping agents) in the mid-infrared wavelength range is feasible. To the best of our knowledge most of the vapour-phase spectra discussed here represent the first data ever recorded. The measurements are both sensitive and selective. In order to estimate the poten-tial of laser spectroscopy in comparison with well-established GC-MS and LC-MS techniques, additional investigations (in terms of selectivity and sensitivity) of actual samples are needed. These preliminary results, though, indicate that laser spectroscopy might find an application as a complementary or as a stand-alone analytical technique.
ACKNOWLEDGEMENTS The authors would like to thank the Gebert-R¨uf Foundation for the financial support received and Nadja Mahler and Dr. Mathias Kamber (from the anti-doping agency of the Institute of Sport Science, Magglingen, Switzerland) for acting as a valuable source of background knowledge on doping agents.
REFERENCES
1 http://www.wada-ama.org/en/dynamic.ch2?pageCategory.id=33 2 L. Politi, A. Groppi, A. Polettini, J. Anal. Toxicol. 29, 1 (2005) 3 P. Hering, J.P. Lay, S. Stry (eds.), Laser in Environmental and Life
Sci-ences (Springer, Berlin, 2004)
4 G. Berden, R. Peeters, G. Meijer, Int. Rev. Phys. Chem. 19, 565 (2000) 5 M. Naegele, M.W. Sigrist, Appl. Phys. B 67, 895 (2000)
6 A.A. Kosterev, R.F. Curl, F.K. Tittel, C. Gmachl, F. Capasso, D.L. Sivco, J.N. Baillargeon, A.L. Hutchinson, A.Y. Cho, Appl. Opt. 39, 4425 (2000)
7 F.J.M. Harren, G. Cotti, J. Oomens, S. te L. Hekkert, Photoacous-tic spectroscopy in trace gas monitoring. In Encyclopedia of Analyti-cal Chemistry, Vol. 3, ed. by R.A. Meyers (Wiley, Chichester, 2000), pp. 2203–2226
8 M.A. Gondal, J. Mastromarino, Appl. Opt. 40, 2010 (2001)
9 C. Fischer, Trace-gas Sensing with a Pulsed Difference Frequency Laser Spectrometer and Three Different Detection Schemes (Mensch und Buch, Berlin, 2004)
10 A. Miklos, P. Hess, Rev. Sci. Instrum. 72, 1937 (2001)
11 C. Fischer, E. Sorokin, I.T. Sorokina, M.W. Sigrist, Opt. Laser Eng. 43, 573 (2005)
12 C. Fischer, M.W. Sigrist, Q. Yu, M. Seiter, Opt. Lett. 26, 1609 (2001) 13 L.S. Rothman, C.P. Rinsland, A. Goldman, S.T. Massie, D.P.
Ed-wards, J.-M. Flaud, A. Perrin, C. Camy-Peyret, V. Dana, J.-Y. Mandin, J. Schroeder, A. McCann, R.R. Gamache, R.B. Wattson, K. Yoshino, K.V. Chance, K.W. Jucks, L.R. Brown, V. Nemtchinov, P. Varanasi, J. Quantum Spectrosc. Radiat. Transf. 60, 665 (1998)
14 I.G. Calasso, M.W. Sigrist, Rev. Sci. Instrum. 70, 4569 (1999) 15 http://www.sigmaaldrich.com
16 R. Bartlome, C. Fischer, M.W. Sigrist, Proc. SPIE 5864, 161 (2005) 17 http://www.fdmspectra.com
18 W. Herres, HTRC – FTIR: Capillary Gas Chromatography – Fourier Transform Infrared Spectroscopy (Hüthig, Heidelberg, 1987), Chapt. 9 19 www.wada-ama.org/rtecontent/document/perf_limits_2.pdf
![Figure 3 shows the measured spectrum of nikethamide (C 10 H 14 N 2 O, CAS number: 59-26-7; melting point: 25 ◦ C) in the vapour phase [16]](https://thumb-eu.123doks.com/thumbv2/123doknet/14837230.623016/3.892.455.817.789.1037/figure-shows-measured-spectrum-nikethamide-number-melting-vapour.webp)