The Collier Memorial: A Study of Theory and Construction
By
Nathaniel Angus Lyon
Bachelor of Science in Civil Engineering Cornell University, 2014
ARCHNES
MASSACHUSETTS INSTITUATE OF fECHNOLOLGYJUL 02 2015
LIBRARIES
SUBMITTED TO THE DEPARTMENT OF CIVIL AND ENVIRONMENTAL ENGINEERINGIN PARTIAL FULFILLMENT OF THE REQUIREMENTS FOR THE DEGREE OF
MASTER OF ENGINEERING
AT THE
MASSACHUSETTS INSTITUTE OF TECHNOLOGY
June 2015
0 2015 Nathaniel Angus Lyon. All Rights Reserved.
The author hereby grants to MIT permission to reproduce and to distribute publicly paper and electronic copies of this thesis document in whole or in part in any medium now known or hereafter created.
Signature of Author:
Signature redacted
Certified By:
Accepted By:
Department of Civil and Environmental Engineering May 20, 2015
Signature redacted
John CS(hsendorf
Professor of Civil and Environme a Engineering and Architecture Thesis AdvisorI I
/ A .The Collier Memorial: A Study of Theory and Construction
By
Nathaniel Angus Lyon
Submitted to the Department of Civil and Environmental Engineering on May 20, 2015 in Partial Fulfillment of the Requirements for the Degree of Master of Engineering Abstract
The Collier Memorial is a vaulted stone structure that was built on the campus of the Massachusetts Institute of Technology during the fall of 2014 and the spring of 2015. In the course of the last century, structural engineers have almost fully abandoned the practice of masonry vaulting. The the Collier Memorial is a particularly interesting structure, because it spans not only space but also time, to an age that appreciated permanence in structure, an ideal befitting a memorial.
This study's main goal was to equip the construction team with real-time validation of the Collier Memorial's performance during the most critical phase of construction-the lowering of the vault. This was accomplished by using a simple analytical approach to predict how loads and deformations would evolve at every stage of the lowering process. Using the lower-bound theorem of plastic theory, thrust line analysis was performed assuming global equilibrium was satisfied among the five legs. Jack loads were predicted using simple two-dimensional equilibrium while the deformations were predicted considering the structure to behave as a series of straight elastic bars that are oriented along the line of thrust and experience an axial force equal to the assumed thrust force.
By choosing to predict the performance in addition to monitoring it, the team had the opportunity
to test how their understanding of equilibrium applied to the structural performance of a modem masonry structure. Working with an accurate prediction of the performance, the hope was that the structure would carry as much of its own weight as possible before being grouted, so that the small amount of reinforcing steel would be only minimally engaged and thus pose a minimal threat to fracturing the stones in the future.
By comparing the theoretical results and physical monitoring data, it was found that there was very
little construction error, and this condition laid the path for shedding 96% of the vault load in the scaffolding and developing joint openings less than 1mm prior to grouting.
Ultimately, this study demonstrates that simple hand calculations are capable of producing accurate solutions to complex problems. Given these results, the future of masonry vaulting could be brighter than its more recent past, as the legitimacy of its structural and historical merits outweigh any belief that this type of construction has somehow become inferior due to modern advancements.
Acknowledgements
First of all, I want to say that it was an honor contributing to such an amazing project, and I am proud of all the work that brought the Collier Memorial to life. I have had the honor of not only working with a fantastic group of engineers, architects, and builders, but also meeting so many who were close to Sean.
In the fall of 2014, Professor John Ochsendorf presented to me and other students in the program the opportunity to work on the Collier Memorial project, and, although I was intimidated about how I might actually contribute, I was thrilled by simply the thought of joining the team. Thank you John for believing in me.
Thank you to Corentin Fivet for offering to share so much of your time to help me with my calculations, and for your input on this thesis. You are a sharp collaborator, and I know you will make a fantastic professor.
Thank you to William Plunkett for amicably welcoming me to the team and for always making light of difficult situations.
Thank you to William Cord for your companionship during the project and for your always-humorous outlook and hard work.
Thank you to Andrew Smith for helping out with such alacrity and wit. Your voluntary contributions were greatly appreciated, and it was a great pleasure working with you.
Thank you to Christopher Porst, Michael Laracy, and Natalia Zawisny for your aid in taking skillful measurements during the critical phase of construction.
Thank you to Rob Rogers of Suffolk Construction along with Jimmy Garcia and his crew from Phoenix Bay State Construction Company for your cooperation, and thank you for your passion; it was truly inspirational.
Lastly, I want to thank my family for supporting me and my career goals. I want to thank my mom for all of her hard work and encouragement so that I may pursue my studies wholeheartedly. I want to thank my dad for his continuous interest in my health, happiness, and career. And lastly, I want to thank my sister for always helping me communicate to the world through my writing.
Table of Contents
1
Introduction
...
09
1.1
Background
...
09
1.2 M otivation ... 10 1.3 Construction Sequence ... 10 1.4 Prior W ork ... 11 1.5 G oals ... 11 2 M ethodology ... 13 2.1 Basic Concepts ... 13 2.2 H and Calculations ... 16 2.3 Construction M onitoring ... 24 3 Results ... 31 3.1 H and Calculations ... 31 3.2 Construction M onitoring ... 34 4 D iscussion ... 524.1 Scaffolding Loads: H and Calculations ... 52
4.2 Scaffolding Loads: Construction M onitoring ... 52
4.3 joint O penings: H and Calculations ... 53
4.4 joint O penings: Construction M onitoring ... 53
4.5 Possible Im provem ent ... 54
5 Conclusions ... 55
A ppendix I: H and Calculations ... 56
A ppendix 11: Construction M onitoring ... 98
List of Figures
Figure 1.1: Photo of the C ollier M em orial ... 09
Figure 1.2: Photo of the C ollier M em orial ... 11
Figure 1.3: Photo of the C ollier M emrorial ... 12
Figure 2. 1: M inim um T hrust (Leg A ) ... 14
Figure 2.2: M axim um T hrust (Leg A ) ... 14
Figure 2.3: Jack/Stone C entroids ... 18
Figure 2.4: Photo of Jacks Supporting Stones ... 24
Figure 2.5: Jack L ayout ... 25
Figure 2.6: Photo of Scales in A ction ... 26
Figure 2.7: Scale L ayout ... 27
Figure 2.8: Photo of a C rack M onitor in A ction ... 28
Figure 2.9: C rack M onitor ... 28
Figure 2.10: C rack M onitor L ayout ... 29
Figure 3.1: Predicted K eystone V ertical D eflection (Leg A ) ... 32
Figure 3.2: Predicted A rch-W all Joint Stiffness (L eg A ) ... 33
Figure 3.3: Predicted A rch-K eystone Joint Stiffness (L eg A ) ... 33
Figure 3.4: Scale Loads Prior to D rop ... 34
Figure 3.5: T otal Scale L oads for Individual L egs ... 37
Figure 3.6: T otal Scale L oad ... 37
Figure 3.7: H orizontal T hrust ... 39
Figure 3.8: K eystone V ertical D eflection (Leg A ) ... 41
Figure 3.9: A rch-W all Joint Stiffness (L eg A ) ... 41
Figure 3.10: A rch-K eystone Joint Stiffness (L eg A ) ... 42
Figure 3.11: K eystone V ertical D eflection (L eg B )...43
Figure 3.12: A rch-W all Joint Stiffness (Leg B ) ... 43
Figure 3.13: A rch-K eystone Joint Stiffness (L eg B ) ... 44
Figure 3.14: K eystone V ertical D eflection (L eg C) ... 45
Figure 3.15: A rch-W all Joint Stiffness (L eg C)...45
Figure 3.16: A rch-K eystone Joint Stiffness (L eg C) ... 46
Figure 3.17: K eystone V ertical D eflection (L eg D ) ... 47
Figure 3.18: A rch-W all Joint Stiffness (L eg D ) ... 47
Figure 3.19: A rch-K eystone Joint Stiffness (L eg D ) ... 48
Figure 3.20: K eystone V ertical D eflection (L eg E ) ... ... 49
Figure 3.21: A rch-W all Joint Stiffness (L eg E ) ... 49
Figure 3.22: A rch-K eystone Joint Stiffness (L eg E ) ... 50
Figure 4.1: T otal Scale L oad (A pply K eystone W eight at the Start) ... 52
Figure 4.2: A rch-W all Joint Stiffness (L eg A ) (R efined) ... 54
List of Tables
T able 2.1: G lobal E quilibrium ... 17T able 3.1: Predicted Scale L oads Prior to D rop ... 31
T able 3.2: Scale Loads Prior to D rop (C om parison) ... 35
T able 3.3: Sum m ary of D rop Progression ... 36
T able 3.4: Sum m ary of C onstruction Slop ... 51
Chapter 1
-
Introduction
1.1 Background
On the night of April 18t, 2013, three days after the Boston Marathon bombings, Officer Sean Collier of the MIT Police Department was shot and killed in the line of duty by the same two men who had carried out the bombings on Boylston Street. One year later, MIT announced that a memorial would be erected at the location of the shooting to honor Officer Collier. The memorial's critical phase of construction in the spring of 2015 forms the basis for the following work.
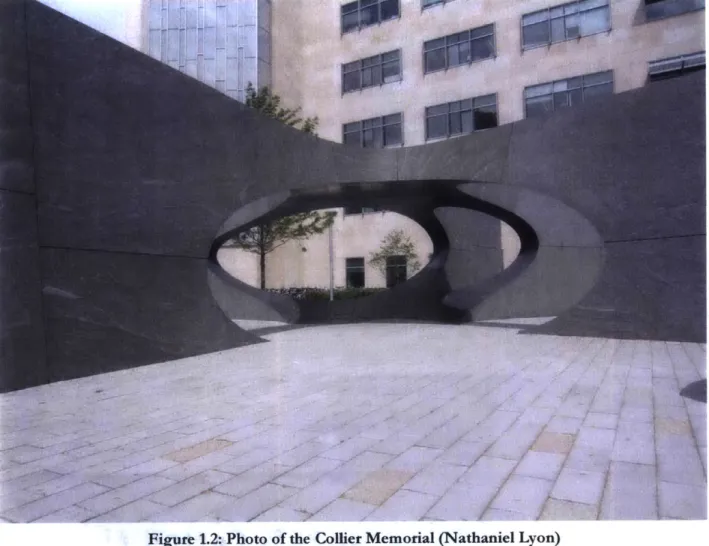
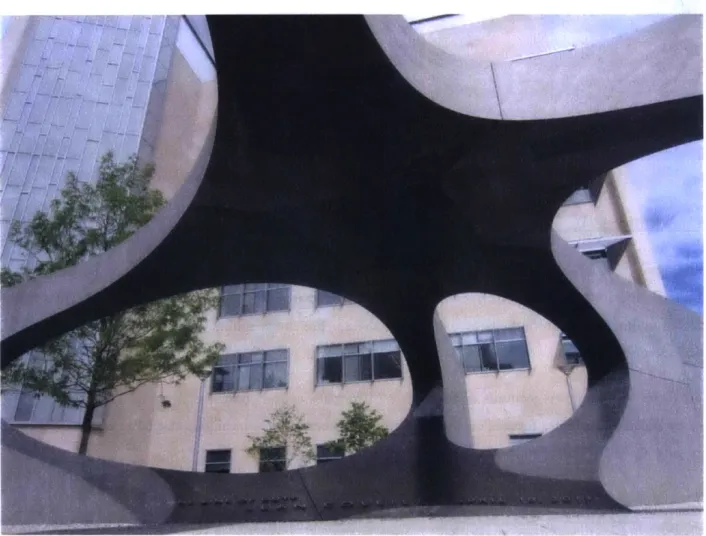
The Collier Memorial-designed by architect Meejin Yoon-is a 190-ton masonry structure that appoints thirty-two granite stones within a 60'x60' space to form a central vault supported by five radiating buttress-walls. The structure essentially consists of five half-arch/wall units designated as Legs A, B, C, D, and E. Figures 1.1, 1.2, and 1.3 present the Collier Memorial in its completed state.
1.2 Motivation
Today, many designers and engineers are unfamiliar with structural vaulting, and there exists a fear that unreinforced masonry is inherently unstable. Partly because of this belief, the Collier Memorial utilizes steel reinforcement to join the majority of stones, but this additional support is superfluous for the majority of loading situations. If anything, the addition of steel might bring about more harm than good, as illustrated by the following three pitfalls:
1 There is additional cost involved in both supplying the steel and drilling the stone holes in which the steel will lie.
2 There is a risk of the steel inducing residual tensile stresses that may fracture the stone if excessive load or deformation occurs.
3 Although there is significant cover, the steel will eventually corrode and could damage the surrounding stones, thus reducing the lifespan of the structure significantly.
Despite these drawbacks, the engineer of record insisted on the use of steel dowels between stones, and thus, and thus it became pivotal that the steel be minimally engaged by developing arching action prior to grouting.
By lowering the vault prior to grouting, the likelihood of fracturing the stones in the future is drastically
decreased.
The motivation for monitoring the Collier Memorial during its critical construction phase was two-fold: to demonstrate in real-time that load is shed from the scaffolding into arching, and to ensure that deformation constraints were not exceeded for aesthetic purposes. By combining the load and deformation data, the structural performance of the Collier Memorial can be quantified from a stiffness perspective.
1.3 Construction Sequence
As it pertains to the work in this study, the construction of the Collier Memorial was carried out in the following basic sequence. First, the central vault stones were situated on top of scaffolding. Second, the leg stones were laid and grouted. Third and lastly, the vault was incrementally lowered. Scales were placed under the temporary supports to monitor the load transfer. At every stage of the lowering scale load measurements were taken, while joint opening measurements were taken every few stages due to the time demand. It was decided upon prior that the lowering would cease if either the vault stones lost contact with the scaffolding or deformation constraints were attained.
Figure 1.2: Photo of the Collier Memorial (Nathaniel Lyon)
1.4 Additional Work
In September of 2014, the firm of Ochsendorf Dejong & Block, LLC published a report outlining what structural analyses had been performed on the Collier Memorial in order to prove its feasibility. This study will not comment on the findings of that report, though this thesis applies some of the same methods of calculation (ODB 2014).
This thesis is one of two accounts of the Collier Memorial's critical construction phase. The other work is that of William Cord who focuses on the mechanism formation and critical joint displacements during vault lowering (Cord 2015).
1.5 Goals
The main goal of this work was to equip the team with real-time validation of the Collier Memorial's performance during the most critical phase of construction-the lowering of the vault. By providing and using this, the hope was that the structure would be able to carry as much of its own weight as possible before being grouted, so that the small amount of reinforcing steel would be only minimally engaged and thus pose a minimal threat of fracturing the stones in the future. In order to accomplish this goal, two questions had to be answered. The first question was how to accurately predict the progression of load transfer and joint opening using a simple analytical approach. In other words, how would the scaffolding load shed into arching action and then how would the joints open accordingly? The second question was how to rationally compile the monitoring data in real-time to produce results that may be compared to the hand calculations.
By sufficiently answering these two questions, the predictions would prove pivotal in assessing the actual
load-shedding and joint-opening behaviors and, in doing so, ensure that as much scaffolding load was shed as possible before stopping to grout.
Chapter 2
-
Methodology
This chapter lays out the methodology employed for this study. The work in this section is composed of introductory concepts, calculations for predicted load-shedding and joint-opening behaviors, and calculations
for compiling construction monitoring data-Sections 2.1, 2.2, and 2.3, respectively.
2.1 Basic Concepts
For the purpose of addressing any confusion, the following list of introductory concepts lays out key ideas in an approachable manner.
1 The "critical phase of construction" is when the vault is lowered. During this phase, the support of the vault shifts from the scaffolding to the five buttressing walls.
The initial state of construction occurs when the vault rests solely on the scaffolding, so any point in time before contact is established between the vault and the walls.
The final state of construction occurs when the scaffolding experiences no load, so at any point in time after the vault load is fully transferred from the scaffolding into arching action. In reality, this state is more accurately defined as the point in time when the vault-lowering process is stopped, because the construction team's plan had always included maintaining contact between the vault and the scaffolding as a safety precaution during grouting.
2 To stand up, an arch must develop and support horizontal force, or "thrust." Simply put, without horizontal thrust, and neglecting the tensile capacity afforded by grout or mortar, any stone whose centroid lies outside of the support would fall out. By pushing the stones together and engaging friction, an arch is stable so long as the supports are capable of resisting the horizontal thrust and the thrust line is maintained within the section of the arch for the given loading.
3 Statically indeterminate masonry structures are complicated in that the load path is difficult to know.
There are an infinite number of possible load paths, but only within two limiting states will the structure be stable: the minimum and maximum thrust states.
The minimum thrust state occurs when the load path passes through the bottom portion of the bottom shim in the arch-wall joint.
Ii
11
II
IFigure 2.1: Minimum Thrust (Leg A)
The theoretical maximum thrust state occurs when the load path passes through the outmost portion of the wall base, which would lead to overturning of the buttressing wall.
Figure 2.2: Maximum Thrust (Leg A)
4 Within each joint
lie
four shims that serve as spacers so that when the time arrives there is room for grout to fill the joint. In this study, the joints are assumed to all have the same gap and therefore require the same shim thickness. In reality, some joints had slightly larger or smaller gaps and therefore required more total shim thickness.0
a
I 1
S During the critical phase of construction, the load path can be determined indirectly by monitoring the load in the scaffolding and the opening of the
joints.
These two things in particular are monitored for two reasons. First, by knowing the weights of the stones and the amount of load in the scaffolding, the load in the structure can be determined. And second, because measuring the shrinkage of the arch directly would be very complicated if not impossible, joint openings serve as an indirect way of measuring the deformation, because a joint will only open if the vault shrinks, and the vault will only shrink where force is applied.For instance, if load is shed from the scaffolding supporting Leg A and the arch-wall joint for Leg A opens simultaneously, thrust must be acting through that joint. The magnitude of the thrust can also be estimated by using the shrinkage of the shims within that joint, and this sort of analysis is performed by William Cord (Cord 2015).
2.2
Hand Calculations
This section lays outs the assumptions and approach used for predicting the load-shedding and joint-opening behaviors during the critical phase of construction-the lowering of the vault. All of the following work begins by taking two-dimensional sections of each leg and performing simple equilibrium and deformation calculations.
As with the construction of any arch or vault, the final stage-the liberation of the scaffolding-brings about load transmission from the scaffolding into arching action. However, computing the loads and deformations
by first retracting the jacks and following through is a complicated affair. Because the stone weights are
obviously constant, it is more practical and just as valid to think about the jacks simply as forces used to balance the lack of horizontal thrust. From there, the force in each portion of the structure can be determined using thrust line analysis. By assuming the structure behaves as a series of straight and flexible bars that are oriented along the line of thrust, and experience an axial force equal to the thrust force, and utilize an assumed 18"x18" section, the deformation of the structure can be estimated. The specified cross-section is based on the fact that the walls are 18" thick and that some portion of each wall can act as a compression strut.
2.2.1 Assumptions
This section lays out the assumptions that will be applied during the approach following in Section 2.2.2.
1 Regarding the predicted scale loads prior to vault-lowering, it was assumed that there was no contact between the stones and thus the sum of the forces in each stone's supporting jacks equal the weight of
the stone.
2 For simplicity, each two-dimensional section was oriented to
lie
in the xy-plane with the outmost bottom corner as the origin.3 For simplicity, the structure was discretized per stone, and the total weight of each stone was applied at its centroid.
4 It was assumed that Leg A would behave in a minimum thrust state because it spans the largest space. Furthermore, it was assumed that Leg A would bear none of the keystone weight, thus splitting the keystone weight among Legs B, C, D, and E. Similarly, because Leg E has by far the second-largest span, it was assumed that Leg E would behave in a thrust state close to if not minimal. Using these constraints, the final thrust states for all legs were determined using global equilibrium.
HdontaiThrust (LB) _ Angle fromAtbay AXIS (& F. (LB) sRepmuolAm*&y&it hf Max Qoson (D)
A 52000 51575 111080 52000 17.1436 -15328 49690
B 30000 16238 63191 24000 99.7M3S -2651 49
C 25000 15356 67489 23200 137.9034 15553 17215
D 29000 26435 64063 31700 207M.3454 14562 28158
E 48000 39393 92219 39970 269.6577 39969 239
Table 2.1: Global Equilibrium
5 Although each leg has a virtually constant cross-section, the vault stones do not. Thus, the centroid for each wall stone was adopted from the two-dimensional geometry and the centroid for each arch stone was adopted from the three-dimensional geometry excluding the out-of-plane coordinate. With its weight divided four-ways, the keystone was in a complicated situation; for simplicity, the keystone was cut in half in the two-dimensional drawing for each leg, and its centroid was thus adopted from the same two-dimensional geometry.
6 For each vault stone, the centroid of the jacks-shown in black in Figure 2.3-almost perfectly coincided with that of the stone-shown in green. For this fact and for simplicity, the calculations
consider only a single
jack
supporting each vault stone acting at the stone's centroid.0
JAl b
SJA1a
0
JAlce
JA2b @
0
JA2a
J
dJA2
Figure 2.3: Jack/Stone Centroids
7 The vault is so flat and thin that only a narrow range of stable thrust solutions exists, and therefore the necessary arch-wall reaction force orientation varies only slightly from minimum to maximum thrust states. Due to this and the fact that the problem would be indeterminate otherwise, the arch-wall reaction force orientation was assumed to be constant throughout the load transfer process.
8 Four "critical" points were defined to determine the minimum and maximum thrusts. These points are those through which the minimum and maximum thrust lines pass.
(XMIN1 YMINI)
(XMIN2 YMIN2)
(XMAx1 YMAx1)
(XMAX2 YMAX2)
The expected arch-wall intrados hinge for the minimum thrust The expected arch-keystone extrados hinge for the minimum thrust The outmost base point (origin)
The expected arch-keystone intrados hinge for the maximum thrust
9 Four "principal" points (1, 2, 3, and 4) were defined to carry out deformation calculations, and each has
an initial (1), midway (M), and final (F) state.
(X11Y11)
(X21 Y21)
(X31 Y31)
(X41 Y41)
The arch-wall intrados hinge for the initial state The arch-keystone extrados hinge for the initial state The arch-wall joint-opening point for the initial state The arch-keystone joint-opening point for the initial state
18
10 For simplicity, the keystone was assumed to act rigidly and displace only vertically.
11 For simplicity, the joint lengths were assumed to be constant. Thus, the arch-wall and arch-keystone
joints do not shrink parallel to the joint.
12 For simplicity, the arch-keystone joint was treated as a perfectly flat and continuous joint, rather than a step joint. This assumption, however, does not affect the joint opening because the joint's orientation remains constant through the step.
13 For simplicity, it was assumed that the thrust line is always that for the final thrust, only that the force
transmitted through it varies. Also, each jack load and deformation calculation assumed that each horizontal thrust increment was applied all at once and not progressively. Because of these two assumptions, the intrados hinge was always located at the arch-wall joint.
14 The crushing capacity of the stone is so substantial (42ksi) and the forces within the structure were
expected to be so low that crushing will not be considered (ODB 2014).
15 The stones were cut and laid in cold months. However, during the critical phase of construction and
the week leading up to it, a tent enclosed the memorial and was warmed to 60'F. The rise in temperature undoubtedly caused the stones to expand, but how much was not known. Assuming the initial geometry is that for a cold climate of 20*F, the stone expansion was factored into the deformation calculations as a shrinking reduction. However, because the critical phase of construction took place over the course of only one day during which the memorial was enclosed by a temperature-regulated tent, it was assumed for all accounts that there was no temperature change despite it being considered in the deformation calculations.
2.2.2 Approach
This section lays out a simplified version of the approach used to calculate the jack loads and joint openings at incremental stages of the vault-lowering process.
1 Determine the weight (W) and centroid (Xc Yc) of each stone.
2 Determine the coordinates of the four critical points as described in Section 2.2.1: (XMIN1 YMIN1), (XMIN2 YMIN2), (XMAX1 YMAX1) and (XMAX2 YMAX2).
3 Calculate the lever arms for each applicable stone in the minimum state (LWMIN) using the stone centroid (Xc) and first critical point (XMIN1). Similarly, calculate the lever arms for each applicable stone
in the maximum state (LwMAx) using the stone centroid (Xc) and third critical point (XMAX1).
4 Calculate the lever arm for the minimum horizontal thrust (LHMIN) using the first and second critical points (YMIN1 and YMIN2). Similarly, calculate the lever arm for the maximum horizontal thrust (LHMAX) using the third and fourth critical points (YMAX1 and YMAX2).
5 Calculate the theoretical minimum horizontal thrust (HMIN) using the arch stone weights (W), the arch
stone lever arms (LwMIN), and the lever arm for the minimum horizontal thrust (LHMIN). Similarly,
calculate the theoretical maximum horizontal thrust (HMAX) using all stone weights (W), all stone lever arms (LwMAX), and the lever arm for the maximum horizontal thrust (LHMAX).
6 Specify the expected final horizontal thrust (H), as presented in Table 2.1.
7 Calculate the coordinates of the point where the expected final thrust passes through the arch-keystone joint (XH YHi) using the second critical point (XMIN2 YMIN2) and the minimum (HMIN), maximum (HMAX),
and final (H) horizontal thrusts. While the minimum and maximum thrusts pass through the top and bottom of the keystone, respectively, the specified final thrust passes through somewhere in between.
8 Calculate the lever arm for the final thrust (LH) using the thrust-keystone contact point (YH) and the
first critical point (YMIN1).
9 Calculate the accumulation of stone weight the thrust force must progressively balance (WT). This
10 Calculate the orientation of each thrust bar (0) using the final horizontal thrust (H) and stone weight
accumulation (WT).
11 Determine the initial coordinates of the third and fourth principal points, (X31 Y31) and (X41 Y41).
12 Determine the orientation of the arch-wall joint (01-3) using the first critical point (XMIN1 YMIN1) and
third principal point (X31 Y31). Similarly, determine the orientation of the arch-keystone joint (02-4) using
the thrust-keystone contact point (XH YH) and the fourth principal point (X41 Y41).
13 Define the initial state of the arch as the bar that links the first and second principal points, (Xii Yl1) and (X2i Y21).
14 Determine the endpoint coordinates of each thrust bar, (XRIGHT YRIGHT) and (XLEFT YLEFT), by starting
with the thrust-keystone contact point (XH YH) and working outward into the wall using the centroids of the stones (Xc) and the orientations of the thrust bars (0).
15 Calculate the length of each thrust bar (L) using the endpoint coordinates, (XRIGHT YRIGHT) and (XLEFT YLEFT).
16 Calculate the lever arm for each applicable stone in the final thrust state (Lw) using the stone centroids (Xc) and the thrust bar endpoint coordinate that lies at the arch-wall contact, the expected location of
the intrados hinge.
17 Define the initial coordinates of the first two principal points, (Xii Yli) and (X21 Y21), as the endpoint
coordinates, (XRIGHT YRIGHT) and (XLEFT YLEFT), located at the arch-wall and arch-keystone contacts, respectively.
18 Calculate the initial length of the arch-wall joint (L1i3) using the first and third principal points, (Xu Y11)
and (X31 Y31). Similarly, calculate the initial length of the arch-keystone joint (L2_4) using the second and fourth principal points, (X21 Y21) and (X41 Y41).
19 Specify how many shims (NsH) are expected to engage for each joint, and calculate the associated total
21 Specify a reasonable arch-wall reaction force orientation (OR). If this quantity is not reasonable, the numerical process presented in Step 35 will not converge to a reasonable solution.
22 Perform all subsequent steps while varying the horizontal thrust from zero to the final thrust (H).
23 Calculate the
jack
loads (Ji andJ
2) using two-dimensional equilibrium to balance out the arch stone weights (W) and the horizontal thrust (H).24 Calculate the force in each thrust bar (F) using the final horizontal thrust (H) and the thrust bar orientation (0).
25 Calculate the total shrinkage of each thrust bar (AL) by summing the contributions from the shims (ALSH) and the stones (ALsT). The shim shrinkage is dependent on the thrust bar force (F), shim
thickness (LSH), shim elastic modulus (ESH), and total shim area (ASHT) while the stone shrinkage is
dependent on the thrust bar force (F), thrust bar length (L), stone elastic modulus (EsT), and total stone area (AST).
26 Using the total shrinkage (AL) and orientation (0) of each thrust bar, calculate the horizontal (U) and
vertical (V) displacements of each thrust bar's right point (XRIGHT YRIGHT) taking the left point
(XLEFT YLEFT) as reference.
27 Calculate the total horizontal (U) and vertical (V) displacement of the bar system. The system is
discretized into arch deformations-UARH and VARCH-and wall deformations-UWAL, and
VWALL.-28 Calculate the deformed coordinates for the principal points-(X1F Y1F), (X2M Y2M), (X3M Y3M), and
(X4M Y4M)-using the initial coordinates and the appropriate arch or wall displacements-UARCH,
VARCH, UWALL, VWALL.
29 Calculate the length (LARCH) and orientation (02M) of the deformed arch that links the first and second principal points, (X1F Y1F) and (X2M Y2M).
30 Assuming the length of the deformed arch stays constant, calculate the final coordinates of the second
principal point (X2F Y2F) by rotating the deformed arch about the first principal point (X1F Y1F) until it once again makes contact with the keystone. Also, calculate the final orientation of the deformed arch (02F) that now links the first and second principal points, (XIF YF) and (X2F
Y2F)-31 Calculate the vertical deflection of the keystone (AY) using the initial and final coordinates for the
second principal point, (X21 Y21) and (X2F Y2F).
32 Calculate the rotation of the arch (OROT) using the orientation of the deformed arch (02m) and the orientation of the final arch (0
2F).
33 Calculate the final coordinates of the third and fourth principal points-(X3F Y3F) and (X4F Y4F)-by
rotating the point (X3M Y3M) about (X1F Y1F) and the point (X4m Y4M) about (X2F Y2f) both by the arch
rotation (OROT).
34 Calculate the joint opening of the arch-wall joint (AX3) using the deformed and final coordinates of the third principal point (X3M and X3F). Similarly, calculate the joint opening of the arch-keystone joint
(AX4) using the deformed and final coordinates of principal point 4 (X4M and X4F).
35 Solve for the arch-wall reaction force orientation (OR) numerically such that the total jack load (Jr) is
zero when the horizontal thrust reaches its final state. At this point, if the calculations were automated correctly, all of the calculation results should match those presented in the main body of this study.
2.3 Construction Monitoring
This section lays outs the instruments and approach used for monitoring and processing the data obtained during the critical phase of construction-the lowering of the vault.
During the vault-lowering process, two sets of measurements were recorded: the load in the scaffolding was measured using scales and the opening of several key joints was measured using crack monitors.
2.3.1 lacks
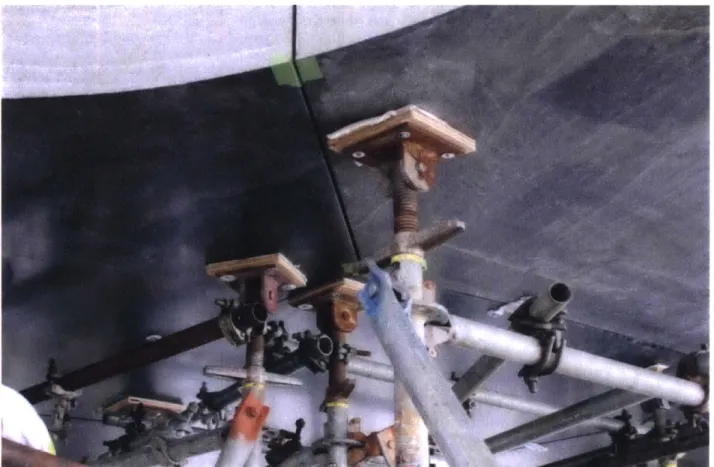
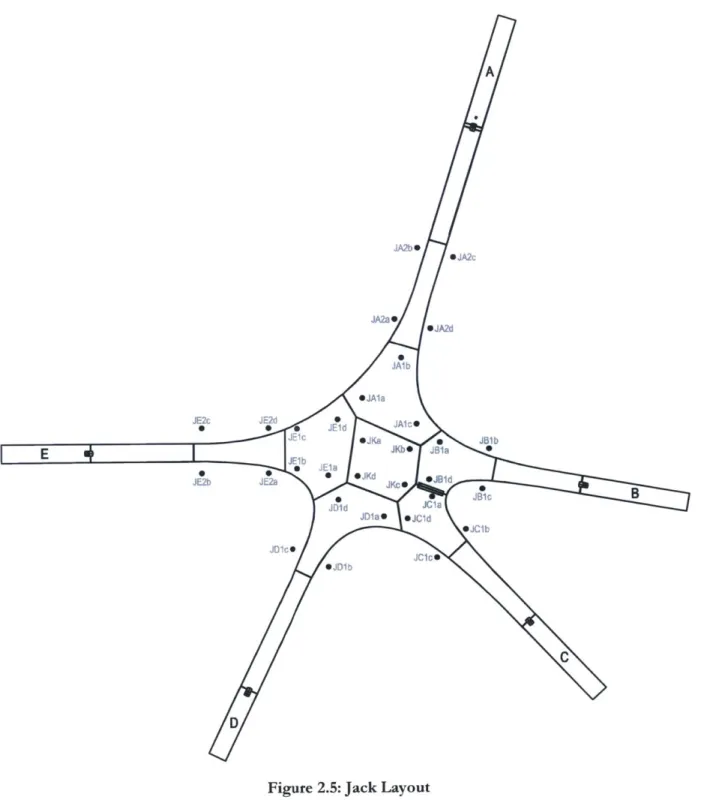
The plan was to slowly lower the vault stones into place, so jacks were placed on top of the scaffolding to provide the small yet necessary movements-as shown in Figure 2.4.
Figure 2.4: Photo of Jacks Supporting Stones (Corentin Fivet)
Furthermore, each vault stone was supported by four jacks, as shown in Figure 2.5. Although Stone Al is only shown with three supporting jacks, there was in fact a fourth that was so close to Jack JAlb that it was ignored.
A JA2b* *JA2c JA2a* OJA2d JAlb *JAla JERc JE2d e J
~
cJFIC O JKa JBib
E~l JKb JBla SJEla 0 OJKd Jd JE~~JBb JEaJc J JBid JC1 JDlao *JCid oJCib JDIceJCc O JDlb C D
2.3.2 Scales
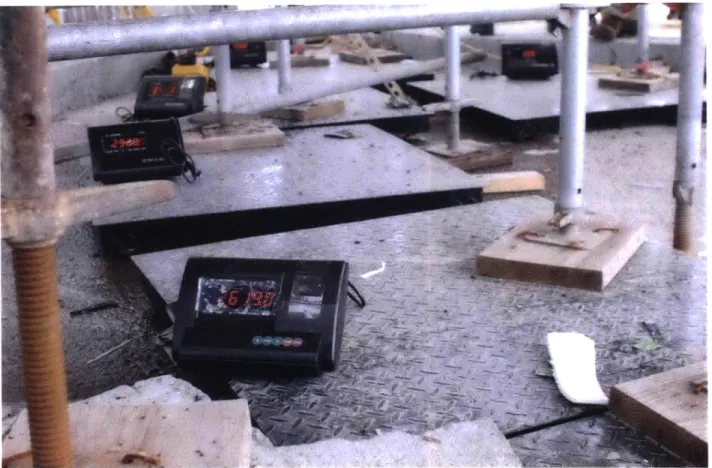
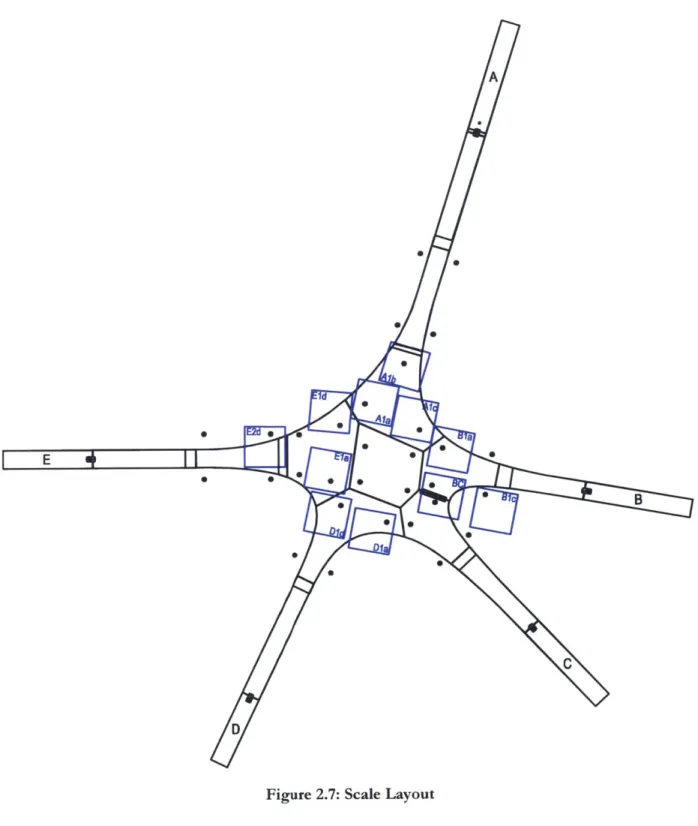
To actually monitor the load in the scaffolding, eleven Saga TT-10k scales-as shown in Figure 2.6-were situated underneath the scaffolding according to Figure 2.7.
Figure 2.6: Photo of Scales in Action (Corentin Fivet)
Ideally, there would have been a scale for each jack, but this was not feasible due to spatial constraints. Considering the weight of the vault stones, the required scale capacity was determined assuming an appropriate factor of safety. Although each scale has four legs each with a 50001b-capacity load cell, the maximum recommended loading for the scale is 6,3001b as a point load applied anywhere but directly atop a load cell, or 10,0001b as a uniform load. Thus the load on each scale was maintained below 6,0001b
A 0 .B C D I E
2.3.3 Crack Monitors
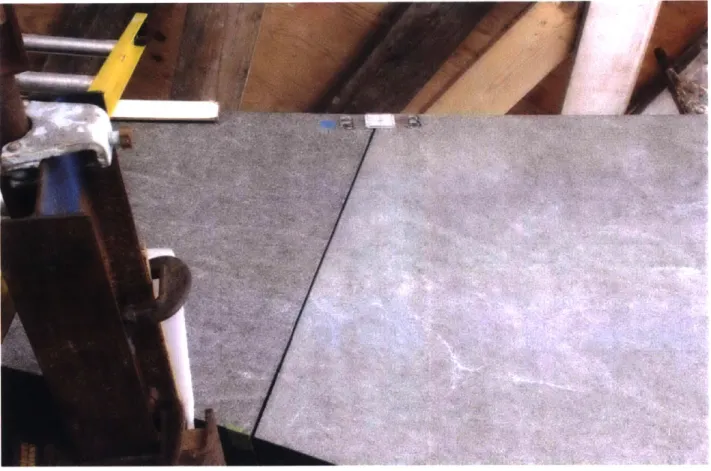
The joints were monitored using simple displacement gauges, as shown in Figures 2.8 and 2.9. Because the precision of the gauges was only to the nearest millimeter, calipers were used in conjunction to provide a much-improved precision of 0.03mm. Thus, the gauges themselves served as more of a snapshot of the joint conditions when installed, and served to provide the means of measuring the deformations, but not the measurements themselves.
Figure 2.8: Photo of a Crack Monitor in Action (Corentin Fivet)
Crack monitors were attached to the Collier Memorial at twenty-four locations, as shown in Figure 2.10. Crack Monitor 6 was not installed due to an obstructing brace.
1~1 2 MAN 3 ASI~ 4 AZASW 6 AIBIb 7 -11 am 13 Dm 14 DO= 16 sa 17 -n AM a m
Figure 2.10: Crack Monitor Layout (Cord 2015)
For the purpose of this study, only data provided by nineteen of the crack monitors was used, specifically those located at the arch-wall and arch-keystone joints for each leg.
.... .... ..
LGC
LLEGA
2.3.4 Approach
The following methodology lays out the approach for compiling the load monitoring data in such a way that could be compared to the results of the hand calculations.
1 Prior to lowering the vault, periodically log the scale loads, and monitor the changes with time and
temperature.
2 During the vault-lowering process, calculate the total load each inner ring stone (Al, B1, C1, D1, and
El) applies to the scaffolding (J1).
3 During the vault-lowering process, calculate the total load each outer ring stone (A2 and E2) applies to
the scaffolding (J2). There was supposed to be a scale underneath Stone A2; however, why it was not placed is unknown.
4 Calculate the horizontal thrust in each leg using two-dimensional equilibrium to balance out the arch stone weights (W) and the
jack
load(J
1) from Step 2. All other properties can be obtained fromSection 2.2.2.
5
Calculate the total load each outer ring stone (A2 and E2) applies to the scaffolding (J2) using the horizontal thrust calculated in Step 4 and all other properties from Section 2.2.2. Although there was a scale situated underneath Stone E2, a calculation was performed both using this fact (Step 3) and ignoring this fact (Step 5) in order to see what similarity exists.6 Calculate the total load each leg applies to the scaffolding (JT) by summing the two jack loads (J1 and
J
2).A more detailed approach is laid out in Appendix I.
The joint opening monitoring data was compiled by William Cord (Cord 2015), and the horizontal components of the joint openings were used in this study. A summary of all measurements applicable to this study, including those from William Cord, are found in Appendix II.
Chapter 3
-
Results
This chapter presents the results of this study in the form of both predicted and observed load and stiffness plots.
3.1 Hand Calculations
This section presents the results of the hand calculations, which include both predicted scale loads prior to vault-lowering and predicted deformations during vault-lowering.
3.1.1 Predicted Scale Loads Prior to Drop
When determining the appropriate scale capacity, a calculation was performed to determine the vault load going into each jack prior to any lowering. In turn, the load on each scale was calculated by summing up the load in all appropriate jacks, and the results are summarized in Table 3.1; the full formulation and results are presented in Appendix 1. Scale Force (LB) ____ e 2D-An--- -Ala 3557 3488 Alb 3557 3434 Alc 3557 3748 Bla 1828 1764 Blc 1828 1717 BC 4229 3517 Dla 3562 2773 Did 3562 3802 Ela 3892 3509 Eld 3892 3200 E2d 2220
-Table 3.1: Predicted Scale Loads Prior to Drop
The approximate values are calculated by simply dividing the weight of each vault stone among each supporting jack while the 2D analysis values are calculated using moment equilibrium about the stone centroid. By looking at Table 3.1, it is clear that the scales have a fair bit of extra capacity for unexpected loads during the lowering process.
3.1.2 Predicted Stiffness During DroD
Rather than define a single predicted stiffness profile, because the Collier Memorial is a highly indeterminate structure, a range of possible stiffness profiles was more appropriate, bounded by stiff and soft situations. "Stiff" describes having full shim contact at each joint while "soft" describes having only partial shim contact at each joint.
As a sample of the results, the following three plots-Figures 3.1, 3.2, and 3.3-show the theoretical relationship between load-shedding and three key deformations-the keystone vertical deflection, the arch-wall joint opening, and the arch-keystone joint opening-for Leg A.
0.50 1.00 1.50 2.00 2.50
Keystone Verical Deflection [mm]
Figure 3.1: Predicted Keystone Vertical Deflection (Leg A)
6/o 100/ 20. 60.0 79 - r
1~~~
--3 3.00 3.50 4.00y
80%/ 70% 609/ 509/ 40*/ 30% 0. 1000/0 90%/ W/o 70%/ W/o W/o 400/ W0/o 00 0.10 0.20 0.30 0.40 0.50 0.60 0.7
Arch-Wai joint Opening [mm]
Figure 3.2: Predicted Arch-Wall Joint Stiffness (Leg A)
-0.10 0.20 0.30
Arch-Keystone Joint Opening [mm]
Figure 3.3: Predicted Arch-Keystone Joint Stiffness (Leg A)
10
I-SI
0.40
By looking at Figures 3.1, 3.2, and 3.3, there are two main affirmations. First, the load-deformation
progression is linear, and this stems from the assumption that the thrust line geometry remains constant with increasing thrust. Second, as more load is shed from the scaffolding, the "soft" predictions all develop more deformation than the "stiff' predictions, as is rational.
100% 0-" I I
4
___________ _______I
____________________________ _____________ __ _ _____I
__ -- -0-
-_~~
2M/9 10% 00
10% 0.03.2 Construction Monitoring
This section presents the results of the construction monitoring, which includes an account of the scale loads prior to vault-lowering, a summary of the lowering progression, and accounts of the load-shedding, horizontal thrust development, and stiffness behaviors during the vault-lowering. All plots have been refined to not include the weight of the scaffolding.
3.2.1 Scale Loads Prior to Drop
Prior to lowering the vault, scale loads were recorded on eight separate occasions, as shown in Figure 3.4. The stones were shipped in gradually throughout the winter, so loads were not recorded for every scale on every day. For a while, many scales supported no stones.
5,000 4.0001-:,,3000 2,000 1,000 -4-Ala -e-Alb -U-Bla -o*Blc -e-B~C *Dia ,a-Dld Ela -- Eld E2d 0 a i I 1/23/2015 1/29/2015 2/4/2015 2/10/2015 2/16/2015 2/22/2015 2/28/2015 3/6/2015 3/12/2015 3/18/2015 3/24/2015 3/30/2015 Date
Figure 3.4: Scale Loads Prior to Drop
By examining Figure 3.4, it is clear that the scale loads were relatively constant for the month leading up to
the critical constriction phase. What might explain the sudden jumps on March 30th is the fact that, since the
time of the previous measurements, the tent was erected and the temperature increased drastically. This may represent a small change in the scale geometry due to thermal expansion, rather than a change in actual load acting on the scale.
I- -~
...
. . .........................
Table 3.2 shows the difference between the predicted scale loads prior to vault-lowering and those actually observed.
Table 3.2: Scale Loads Prior to Drop (Comparison)
Table 3.2 clearly shows that the predicted scale loads prior to vault-lowering were quite close to those observed. Of course, the calculation assumed that there was no contact between the stones-which was simply not the case-and this assumption might explain the difference.
_Scale
Force
(LB) Difference___rox 2D Analysis Actual
Ala 3557 3488 3356 -3.93% Alb 3557 3434 3468 +0.97% Aic 3557 3748 3436 -9.07% Bla 1828 1764 2433 +27.5% Blc 1828 1717 1298 -32.3% BC 4229 3517 4506 +220/o DIa 3562 2773 2215 -25.2% Did 3562 3802 4035 +5.76% Ela 3892 3509 3287 -6.74% Eld 3892 3200 3417 +6.34% E2d 2220 - 2633 +15.7%
3.2.2 Summary of Drop Progression
On March 31, 2015, the day of the critical construction phase, the vault-lowering process occurred over a seven-hour period, and the stages are summarized in Table 3.3. The last column clarifies whether or not construction workers were standing on the scaffolding when the scale load measurements were recorded.
Drop Date Description Guys?
1 3/31/2015 Initial measurement N 2 3/31/2015 Diagonals removed N 3 3/31/2015 1st keystone drop Y 4 3/31/2015 1st vault drop N 5 3/31/2015 2nd keystone drop Y 6 3/31/2015 2nd vault drop Y
7 3/31/2015 3rd keystone drop and 3rd vault drop N
8 3/31/2015 4th keystone drop Y 9 3/31/2015 4th vault drop N 10 3/31/2015 5 th keystone drop Y 11 3/31/2015 5th vault drop N 12 3/31/2015 6th keystone drop Y 13 3/31/2015 6th vault drop Y 14 3/31/2015 7th keystone drop Y 15 3/31/2015 7th vault drop N 16 3/31/2015 8th keystone drop Y 17 3/31/2015 8th vault drop Y
18 3/31/2015 9th keystone drop and 9 th vault drop Y
19 3/31/2015 10th keystone drop and 10th vault drop N
20 3/31/2015 11th and final keystone drop and 11th vault drop (outlying ring) N
21 3/31/2015 12th vault drop (outlying ring) Y
22 3/31/2015 13th and final vault drop on Drop Day N
23 4/07/2015 1st post-drop measurement. Joints have been grouted. Tent is still up. N
24 4/09/2015 2nd post-drop measurement. Tent is down. Prior to scaffolding liberation. N
25 4/09/2015 3rd post-drop measurement. Post scaffolding liberation. N
3.2.3 Load During Drop
Figure 3.5 shows the load-shedding progression on a leg-by-leg basis as the vault was lowered. A description of each lowering stage can be found in Table 3.3.
i 4 1
-- 4
A,
-~~1*~ -1100/ 100% 90% 80% 60% 40/6 30% 201/ 106/ -eAg A -Lg B -Leg C -Leg D -Lg E 1 2 3 4 5 6 7 8 9 10 11 12 13 14 15 16 17 18 19 20 21 22 23 24 25 Drop Count
Figure 3.5: Total Scale Loads for Individual Legs
Figure 3.6 shows the total load-shedding progression as the vault was lowered, and this is simply the summation of the results presented in Figure 3.5.
-t +
t--1-
_ - - -.--I-____~j~~i~.~i~~~j~1~~~~
~I - -1 2 3 4 5 6 7 8 9 10 11 12 13 14 15 16 17 18 19 20 21 22 23 24 25 A1 100% 90% 80% 70% 10% 09 1 60 ... I I Me U i-According to Figures 3.5 and 3.6, the load in the scaffolding was shed at a fairly constant rate. The jumps present at Drops 3, 5, 8, 10, 12, 14, and 16 occurred after lowering the keystone, which became increasingly supported by the vault at every stage. To account for the keystone weight, which was applied gradually, the amount of weight added by lowering the keystone-in Drops 3, 5, 8, 10, 12, 14, 16, 18, 19, and 20-was set aside and factored appropriately into the initial scale load so that the "% Initial" values factored in the keystone. Due to haste, a set of scale readings was not taken in between the dropping of the keystone and the dropping of the remaining vault for Drop 7. Therefore, whatever unaccounted keystone weight remained after Drop 16-the point when the keystone was no longer supported by the jacks-was added to the initial scale load at Drop 7.
The plots are split at Drop 22 because this was the final stage of the critical construction phase. After Drop 22, the jacks supporting each vault stone were raised slightly so construction workers could grout knowing the scaffolding, although not supporting much, was at least in contact with the stones should anything happen. This fact explains why the scale loads increase after Drop 22, because some load was shed from arching back into the scaffolding.
3.2.4 Horizontal Thrust During Drop
From the scale load data, a representative jack load
(Ji)
was calculated for each leg, calculate the horizontal thrust using the approach laid out in Section 2.3.4. Figure 3.7 approach. 0 1-4 1100/0 100%/ 900/0 80% 70% 60% 50% 40% 308/ 10%/ 0 5,000 10,000 15,000 20.000 25,000 30,000 35,000 HorizontaI Thrust Pb]Figure 3.7: Horizontal Thrust
10,000
which was then used to shows the results of this
45,000 50,000 -Leg A -Lg B -Leg C -Leg D I-Leg E 55,000
According to Figure 3.7, all legs developed horizontal thrust in a linear fashion, and this was expected considering the scaffolding load was expected to shed linearly. However, it is unclear why Leg E shows odd behavior both at the initial and final states. The raising of the vault after Drop 22 would explain why the scale loads increased near the end, but not why the horizontal thrust followed a different path in doing so. In other words, by considering the main portion of the Leg E plot and extending it down to the horizontal axis, the horizontal thrust would read somewhere around 45,0001b and not 39,0001b. Seeing as all other legs produced expected results, this odd behavior must stem from the fact that Leg E was troublesome during the entire vault-lowering process; it did not seem to take thrust for the first half of the lowering,
Figure 3.7 may not demonstrate particularly valid results because it takes into account only the scale loads, while all other properties-the weights, lever arms, and arch-wall reaction force orientations-are taken from the hand calculations. This explains why the results so closely match the predicted behavior, and might also explain the odd behavior of Leg E in Figure 3.7. Without factoring in the deformation, Figure 3.7 is at best a
-
3.2.5 Stiffness During Drop
By combining both the scale load and joint opening data, stiffness plots, which compare the amount of load
shed from the jacks to the amount of consequent deformation, served as a visual summary that the team
could use to make decisions about the vault lowering in real-time. Using plots like those found in Section
3.1.2, but for each leg and progressively adding actual data as it presented itself, the performance of the
memorial was monitored and deemed acceptable after every stage so long as the keystone did not vertically
deflect more than 15mm and the joints did not open more than 2mm. The following list of notes applies to
the stiffness plots:
1 The keystone vertical deflection data was recorded by Feldman Land Surveyors by taking shots at the five points of the keystone. The values used in the plots are averages of the two points closest to each
leg. Although these measurements were recorded alongside joint measurements, only the initial and
final positions of the keystone were released, and this is why the plots of the actual data are perfectly
linear.
2 In all stiffness plots, there is mention of "slop," and, simply put, this parameter refers to the
imprecision in stone placement; slop, or the additional space in joints, is bad because it leads to higher
deformations. In order to measure how much slop was present in each leg, the "soft" prediction
employs a representative outward displacement to the leg until the actual construction data is enclosed
within the "stiff" and "soft predictions. Whatever outward displacement produces this result is known
as the "slop."
3 For all of the following stiffness plots, the final two measurements occasionally show odd behavior. At the conclusion of Drop 21, slipping occurred at the arch-wall joint for Leg E, and this best explains
the second-to-last measurement. As explained in Section 3.2.3, the jacks supporting each vault stone
were raised slightly after Drop 22, and best explains the last measurement.
4 For all of the following stiffness plots, the vertical axis, labeled "Total Scale Load," refers to the total scale load for the particular leg. Similarly, the "vault load" is the vault load for the particular leg.
5 From the time the crack monitors were installed until the critical construction phase, the joints gained or lost load acting through them, causing them to open or close before any vault-lowering took place.
However, for simplicity, the initial joint openings for the critical construction phase were reset. Along
with the fact that the initial scale readings served as the 100% point, all of the following data for the
Figure 3.8 shows the progression of the keystone's vertical deflection for Leg A, Figure 3.9 shows the progression of the wall joint opening for Leg A, and Figure 3.10 shows the progression of the arch-keystone joint opening for Leg A.
i
0 Ho 100% 900A 80% 700A 60% 50% 400 30% 20% 109 00/. 0. mAy. 906/ WIOw 70% 60% 50% 40%/ 30*/* 10% 0% 00 0.50 1.00 1.50 2.00 2.50 3.00 3.50 4.00 4.50 5.Keystone Vertical Deflection [mm]
Figure 3.8: Keystone Vertical Deflection (Leg A)
30
Slop = 0.00mm
-- - - 1 - -
-0.20 0.30 0.40 0.50
Arch-Wal Joint Opening [mm]
Figure 3.9: Arch-Wall Joint Stiffness (Leg A) - I -I--0.60 0.10 -stiff -soft -ActuaW 0 -stiff -soft -Actual 0.70 Slop 0.20mm
I
-i1000/0 900% 80% 09 1W 60% 40% 30%* 10%/ 10% --0.80 -0.70 -0.60 -0.50 -040 -030 -0.20 -0.10 0.00 0.10 0.20 0.30 0.40
Arch-Keystone Joint Opening [mm]
Figure 3.10: Arch-Keystone Joint Stiffness (Leg A)
Figure 3.8 shows the maximum vertical deflection of the keystone for Leg A to be about 4.57mm, and this observation corresponds to roughly 0.20mm of slop acting across all joints in Leg A.
Figure 3.9 shows the arch-wall joint for Leg A initially being disengaged, leaving all new load to transmit through the vault and into the other legs. Once about 40% of the vault load was shed from the scaffolding, the joint began developing thrust and therefore began opening up as expected.
Figure 3.10 shows the arch-keystone joint for Leg A alternating between taking and losing load throughout the vault-lowering process. At first glance, this joint appears to show the most unreasonable behavior of any joint. However, other than the one instance of drastic closing, this joint shows very consistent behavior hovering around no joint opening. This outlier could have easily resulted from faulty measuring, but it is not inconceivable that the load, for only a short time, diverted away from this joint but ultimately found its way back. Slop = 0.05mm
h
-stiff -SoCft -Actualt-Figure 3.11 shows the progression of the keystone's vertical deflection for Leg B, t-Figure 3.12 shows the progression of the wall joint opening for Leg B, and Figure 3.13 shows the progression of the arch-keystone joint opening for Leg B.
-100%. W/O 80% 70% 40% 20% 10% 0. Slop = 0.65mm-f
4-0.10 0.20 0.30 0.40 0.50 0.60 0.70 0 Arch-WallJoint Opening [mm]Figure 3.12: Arch-Wall Joint Stiffness (Leg B)
.80 I ________ -Stiff -soft -ActUW 0 -stiff -soft I-Actual 0.90 1.00 Slop = 1.10mm 00 0.50 1.00 1.50 2.00 2.50 3.00 3.50 4.00 4.50 5.00 5.5 Keystone Vertical Deflection [mm]
Figure 3.11: Keystone Vertical Deflection (Leg B)
100% 900/ 80% 70%MA 50% 40% 30% 20% 10% 0% 10 -T _
-4
1
)01009/9 Slop 0.40mm 90% 70% Fg e 3 A.hKyt. -stiff -soft -Atual 300/ - ---00/ AM.2 -0.10 0U0 0.10 0.20 0.30 0.40 0.50
Arch-Keytone joint Opening [nmJI
Figure 3.13: Arch-Keystone joint Stiffness (Leg B)
Figure 3.11 shows the maximum vertical deflection of the keystone for Leg B to be about 5.33mm, and this
observation corresponds to roughly 1.10mm of slop acting across all joints in Leg B.
Figure 3.12 shows the arch-wall joint for Leg B taking load throughout the vault-lowering process. Only once
about 60% of the vault load was shed from the scaffolding did the joint cease to take any more load and thus cease to open any further. This joint opened the most of any arch-wall joint, which might indicate that Leg B
was a pivotal leg in taking thrust.
Figure 3.13 shows the arch-keystone joint for Leg B initially taking load. However, once about 20% of the
vault load was shed from the scaffolding, the joint began alternating between taking and losing load with no
significant net result. During the final two stages of the vault-lowering process, this joint drastically closed
Figure 3.14 shows the progression of the keystone's vertical deflection for Leg C, Figure 3.15 shows the progression of the wall joint opening for Leg C, and Figure 3.16 shows the progression of the arch-keystone joint opening for Leg C.
-stiff soft
-Actua
00 0.50 1.00 1.50 2.00 2.50 3.00 3.50 4.00 4.5 Keystone Vertical Deflection [mm]
Figure 3.14: Keystone Vertical Deflection (Leg C)
-0.10 0.00 0.10 0.20
Arch-WallJoint Opening [mm]
Figure 3.15: Arch-Wall Joint Stiffness (Leg C) 0.30 -stiff -soft -Acual 0.40 100%/ 90% 0% 70% 60% 50% 30% 1 Me 0 Slop = 0.85mm -- -4 -
7
7
--0% 100% 90% 80% 70% 600/ 50%/ 40% 20% 10 0'. 73 i2 2o0
Slop =0.10mm -t--1000/ 900/ 80'! 70%/ 0W 60%-500/ 40% 300/ 200/ -0.10 0.00 0.10 0.20 0.30 0.40 0.50
Arch-Keystone Joint Opening [mm]
Figure 3.16: Arch-Keystone Joint Stiffness (Leg C)
Figure 3.14 shows the maximum vertical deflection of the keystone for Leg C to be observation corresponds to roughly 0.85mm of slop acting across all joints in Leg C.
0.60 0.70
about 4.27mm, and this
Figure 3.15 shows the arch-wall joint for Leg C initially closing before taking load. Once about 55% of the vault load was shed from the scaffolding, the joint essentially disengaged, leaving all new load to transmit
through the vault and into the other legs.
Figure 3.16 shows the arch-keystone joint for Leg C initially closing before taking load. Once about 55% of the vault load was shed from the scaffolding, the joint faintly closed from load redistribution, followed by drastic closing most likely caused by a final shifting of the stones in reaching equilibrium.
Slop 0.65mm
-stiff
-soft
Figure 3.17 shows the progression of the keystone's vertical deflection for Leg D, Figure 3.18 shows the progression of the wall joint opening for Leg D, and Figure 3.19 shows the progression of the arch-keystone joint opening for Leg D.
90% 80% 70%
~50%
40/ 10% MA 0.00 0.10 0.20 0.30 0.40 0.50 0.60 0.70 Arch-Wall Joint Opening [mm]Figure 3.18: Arch-Wall Joint Stiffness (Leg D)
0.80 Slop 0.55mm
-v
. -... - -
---).00 0.50 1.00 1.50 2.00 2.50 3.00 3.5
Keystone Vertical Deflection [mm]
Figure 3.17: Keystone Vertical Deflection (Leg D)
Slop 0.50mm -- - -- - -0.90 -soft -stiff -soft -Actal 100% 90% 80 70% 600/ 50%/ 40r/ 300/ 20%/ 10%/ 0 70 10.