Publisher’s version / Version de l'éditeur:
Vous avez des questions? Nous pouvons vous aider. Pour communiquer directement avec un auteur, consultez la première page de la revue dans laquelle son article a été publié afin de trouver ses coordonnées. Si vous n’arrivez pas à les repérer, communiquez avec nous à [email protected].
Questions? Contact the NRC Publications Archive team at
[email protected]. If you wish to email the authors directly, please see the first page of the publication for their contact information.
https://publications-cnrc.canada.ca/fra/droits
L’accès à ce site Web et l’utilisation de son contenu sont assujettis aux conditions présentées dans le site LISEZ CES CONDITIONS ATTENTIVEMENT AVANT D’UTILISER CE SITE WEB.
Building and Environment, 19, 2, pp. 133-137, 1984
READ THESE TERMS AND CONDITIONS CAREFULLY BEFORE USING THIS WEBSITE.
https://nrc-publications.canada.ca/eng/copyright
NRC Publications Archive Record / Notice des Archives des publications du CNRC :
https://nrc-publications.canada.ca/eng/view/object/?id=250bc368-0f53-4b13-bcff-46d0d6418ea3 https://publications-cnrc.canada.ca/fra/voir/objet/?id=250bc368-0f53-4b13-bcff-46d0d6418ea3
NRC Publications Archive
Archives des publications du CNRC
This publication could be one of several versions: author’s original, accepted manuscript or the publisher’s version. / La version de cette publication peut être l’une des suivantes : la version prépublication de l’auteur, la version acceptée du manuscrit ou la version de l’éditeur.
Access and use of this website and the material on it are subject to the Terms and Conditions set forth at Window blind occlusion: a pilot study
A version of this paper was published in
Building & Environment, Vol. 19, No. 2, 1984, pp. 133 –137 Abstract
Estimations of daylight factors, used to calculate energy savings, typically do not consider occupants’ use of window blinds. The data indicate that such estimations should include some assessment of window blind usage, because over half of the window area is usually occluded in some way by blinds. It appears that many occupants purposely use window blinds to sunlight from penetrating their working space.
Résumé
Dans l’estimation des coefficients d’éclairage de jour, qui servent à calculer les économies d’énergie, on ne tient généralement pas compte de
l’utilisation des stores par les occupants. Les résultats de travaux indiquent qu’il faudrait le faire, car plus de la moitié de la superficie des fenêtres est habituellement occluse, d’une façon ou d’une autre, par des stores. Il semble que nombre d’occupants s’en servent pour empêcher la lumière solaire de pénétrer dans leur lieu de travail.
NRCC 23592 2
INTRODUCTION
The utilization daylight for interior offices has recently become of interest [1-5]. Many of the calculations of daylight factor [6] are based only on the amount and kind of glazing of the variously oriented windows. Rarely are the calculations based on expected positioning of the variable blinds by the occupants even though ordinary, and prevalent, window blinds have a large effect on daylight factor. Factors that might contribute to occupant
positioning of the window blinds include the orientation of the office window, time of day. weather conditions, seasons, latitude, work station position, occupant activities and habits, and artificial lighting characteristics. In the only previous study of occupant use of window blinds, Rubin et al.
[7], studying several buildings at the National Bureau of Standards in
Maryland, found systematic differences in the occupants’ blind positions depending upon the orientation of the windows (north or south).
Furthermore, they concluded that most occupants had preferred blind positions relatively independent of daily, seasonal, and possibly climatic conditions.
A pilot study was performed to test some simple hypotheses in light of the conclusions reached by the pioneering efforts of Rubin et al. Specifically, the study considered the effects of (1) office window
orientation, (2) time of day, (3) weather conditions, and (4) the interactions between these variables, on blind positions set by the
occupants of the building.
PROCEDURES The test site
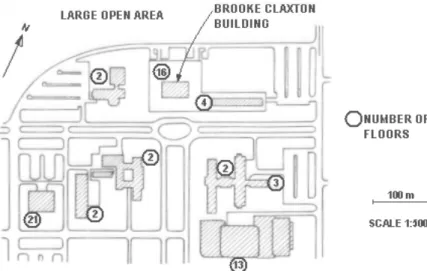
The Brooke Claxton building in
Ottawa (Fig. 1) houses administrative staff for Health and Welfare Canada. It is a 16 story hexahedral building
major compass points. The building’s orientation and its position with
respect to other buildings are shown in Fig. 2. Clear window glazing is used throughout the building. Both horizontal venetian blinds and curtains were used in the building, but only those windows with blinds were examined in this study. The windows on the north face, typically, did not have blinds or curtains. This face was not included in the analysis.
Experimental design
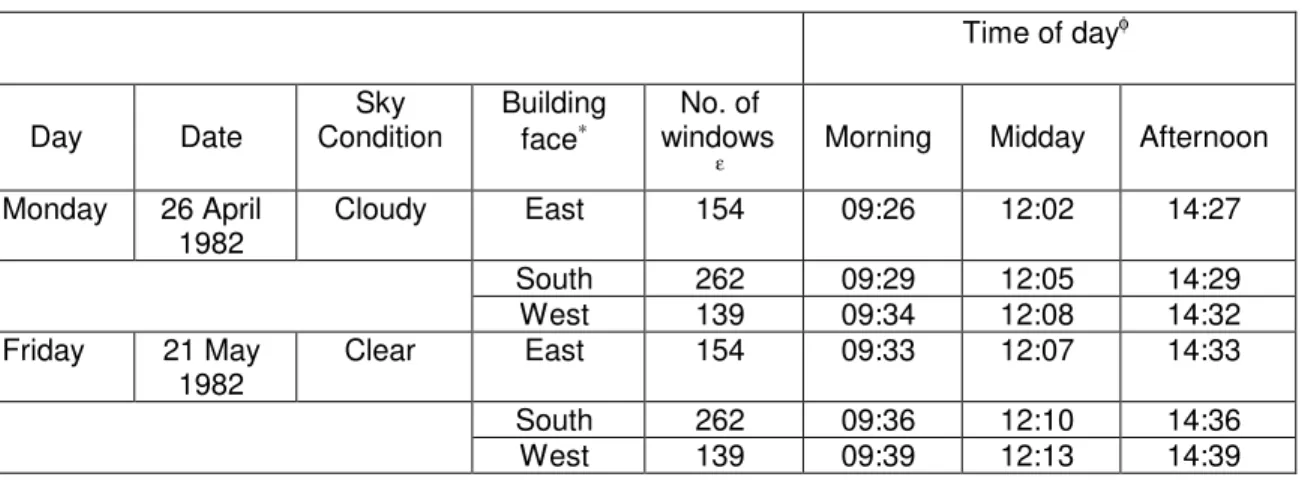
A simple, randomized, three factor (time of day, building face and sky condition) experimental design was chosen to test those hypotheses of interest to this study. Photographs were taken of the three building faces in the morning, at midday, and in the afternoon on a cloudy day in April and on a clear day in May. Table 1 gives the experimental design and the relevant details concerning the photographic sessions.
Raw data
A high quality single lens reflex camera (Nikkormat, Nikkor f2.0, 50 mm lens) using Ektachrome ASA 200 slide film provided the data for the study (Fig. 1). For some photographs a variable linear polaroid filter was attached to the camera lens to reduce the reflected glare on the windows, providing a better view of the blinds and interior.
Fig. 2. Orientation and surroundings, Brooke Claxton building, Ottawa, Canada
NRCC 23592 4 Time of dayφ Day Date Sky Condition Building face∗ No. of windows
ε Morning Midday Afternoon
Monday 26 April 1982 Cloudy East 154 09:26 12:02 14:27 South 262 09:29 12:05 14:29 West 139 09:34 12:08 14:32 Friday 21 May 1982 Clear East 154 09:33 12:07 14:33 South 262 09:36 12:10 14:36 West 139 09:39 12:13 14:39 Photographic analysis
A rating system for evaluating the blind positions from the photographic slides was developed. A completely lowered blind was given a value of 10 and a completely elevated blind, a value of 0. Representative integer values between these two extremes were assigned to the observed variations in blind position. Thus, the proportion of the window covered in some way by a blind was taken as an ‘occlusion value’ and used as the dependent
measure in this study. The pitch of the blind louvers was also recorded on a 1-3 scale, but these data are not presented here.
Rubin et al. [7] recorded similar data in their study. They employed a five level rating scale to estimate blind height and a two level (open and closed) rating scale to evaluate the angle of the blinds. Frequencies for the ten categories (five heights by two angles) were then plotted for comparisons. No attempt was made to combine the data into a single measure of
occlusion.
An identical rating system was used in this study except for three notable features. First, the five category rating system was expanded to 11 categories because more refined estimations of blind height were easily obtained from the photographic data. Second the pitch of the blinds was ignored, largely because the photographic data did not provide adequate
∗
The orientation of the building faces can be more precisely described as being rotated counter-clock wise 22°. For example, the orientation of the south face actually 22° east of south.
φ
Eastern Daylight Time (EDT). For solar time in Ottawa, subtract 1 h from the EDTs on 26 April 1982 and 58 min on 21 May 1982.
ε
Number of windows examined for the various building faces; these are the sample sizes used in the ANOVA for the “complete” data set. Fifty randomly sampled windows from each face were used in the ANOVA for “sample” data set.
detail for unambiguous assessments of pitch. Even the simple “open” and “closed” categories used by Rubin et al. were ambiguous, due to different relative camera angles for different floors of a tall building. ‘Closed’ blinds on the top floors might appear ‘open’ from the ground perspective. Third, by using one dependent variable, blind height, an overall level of blind
occlusion for a set of conditions was possible. Such an ‘overall’ measure seems reasonable for calculation simplicity although it is recognized that such combinations may obscure important differences. For example, it is impossible with this measure to discriminate between a 10% occlusion value for all windows and 10% of the windows having 100% occlusion. As a further example, blind height alone may not be unambiguously related to interior daylight illumination because it does not consider louver pitch.
Random sampling
Examination of the photographic slides was extremely tedious; 3330 windows (Table 1) were carefully examined and then reexamined for accuracy and rating consistency. Analysis of the photographic data represented the largest proportion of time devoted to the study. A more efficient procedure for extracting representative data concerning window blind utilization was desirable; without it these studies are experimentally impractical [8].
Fifty windows from each face were randomly sampled after all the windows had been completely analyzed to see if a reduction in the sample size altered the interpretation of the data. Thus, two data sets, a sampled and a complete set, were subjected to analyses of variance (ANOVAs) for
comparison of the statistical results.
RESULTS
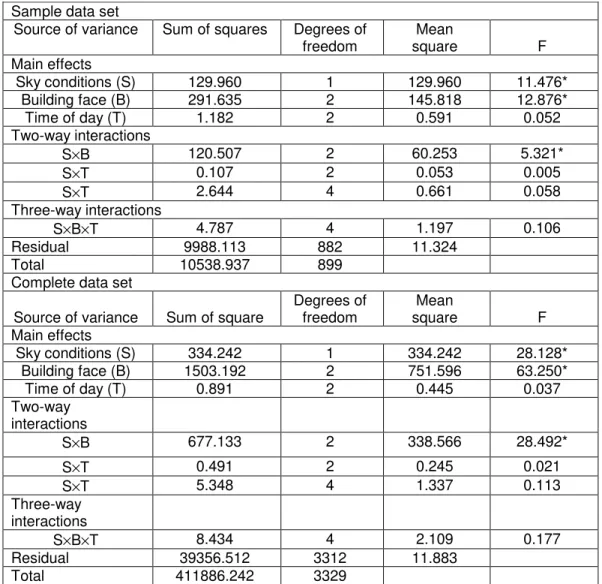
ANOVAs for a randomized, three factor (sky conditions building face and time of day) design were performed on the complete and the sampled data sets. The results of the ANOVAs, presented in Table 2 for each factor (main effect) and for all combinations of each factor (interactions) were statistically equivalent. Both F-tests, gauging the importance of the experimental
manipulations indicated that only the sky conditions and building face main effects and the sky conditions building face interaction were statistically significant (last column Table 2). In other words occlusion values differed significantly for: (a) the different sky conditions, cloudy and clear; (b) the different building faces, east, south, and west; and (c) combinations of sky conditions and building face. No other experimental manipulations or their combinations were statistically important by either ANOVA. Table 3 gives the averages associated with the statistically important main effects and
NRCC 23592 6
Sample data set
Source of variance Sum of squares Degrees of freedom Mean square F Main effects Sky conditions (S) 129.960 1 129.960 11.476* Building face (B) 291.635 2 145.818 12.876* Time of day (T) 1.182 2 0.591 0.052 Two-way interactions S×B 120.507 2 60.253 5.321* S×T 0.107 2 0.053 0.005 S×T 2.644 4 0.661 0.058 Three-way interactions S×B×T 4.787 4 1.197 0.106 Residual 9988.113 882 11.324 Total 10538.937 899
Complete data set
Source of variance Sum of square
Degrees of freedom Mean square F Main effects Sky conditions (S) 334.242 1 334.242 28.128* Building face (B) 1503.192 2 751.596 63.250* Time of day (T) 0.891 2 0.445 0.037 Two-way interactions S×B 677.133 2 338.566 28.492* S×T 0.491 2 0.245 0.021 S×T 5.348 4 1.337 0.113 Three-way interactions S×B×T 8.434 4 2.109 0.177 Residual 39356.512 3312 11.883 Total 411886.242 3329
* The probability that the means are significantly different by chance is less than or equal to 0.005. Pairwise comparisons of the six means from the sampled data set
associated with this significant interaction were made using the Tukey test [9]. A 5% criterion of significance was employed for the pairwise
comparisons. Only the east face on the cloudy day was significantly different from the other combinations of building face and sky condition.
DICUSSION
As noted in the Introduction estimates of daylight factor have usually been obtained without consideration of the use of window blinds by occupants. From the pilot data of this study (and those by Rubin et al.[7]), it appears that a large portion of the window glazing is occluded by window blinds particularly on the south face. If these data are typical, the calculated energy savings based on daylight factor may be overestimated where occupants manage their own window occlusions.
It is still too early to draw definite conclusions about why occupants change their window blinds. Other tests will have to be conducted before
establishing any underlying principles concerning occupant behavior. Nevertheless, a simple tentative interpretation is largely consistent with these data and the interpretation and data by Rubin et al. Specifically, these two data sets seem to indicate that people use window blinds to prevent penetration direct sunlight, thermal radiation, or both, into the room. Sampled data set (occlusion values %)
Building face Sky
condition East South West Average
Clear 57.5 62.6 60.6 60.2
Cloudy 39.7 61.3 57.0 52.6
Average 48.6 61.9 58.8
Complete data set (occlusion values %)
Building face Sky
condition East South West Average
Clear 59.9 65.2 63.6 63.3
Cloudy 39.3 65.9 59.9 57.0
Average 49.6 65.5 61.7
This hypothesis is most strongly supported by the significant building face/ sky condition interaction indicated by the large variations on the east face. The occlusion value was very much higher on the clear day than on the cloudy day for this building face. Although occupant behavior on the east face largely determined the significant sky condition and building face main effects, there were small but consistent differences in occlusion values on the three faces and for the two sky conditions. A larger proportion of the window surfaces was occluded on the clear day than on the cloudy day on all three building faces studied, and occlusion values for the three building faces were positively correlated with the daily mean irradiance falling on those faces. In the 20 years this building has been used blinds have never been installed on the north face where there is little direct solar radiation. The data from Rubin et al. were also consistent with this simple
interpretation. Their data were reanalyzed using the scoring procedure described above. The difference in occlusion values associated with the south and north building face directions were fairly large, 78% and 53% respectively. Again, occlusion values seem positively correlated with total solar radiation.
One important fact from this study is inconsistent with the simple
interpretation that people manipulate their blinds to reduce penetration of solar radiation as presented in Table 2, time of day was not a significant effect in this study. Occupants apparently made little or no attempt to
change the blinds throughout a day, even on the east and west faces where
NRCC 23592 8
penetrating solar radiation would change dramatically on clear days. Rubin
et al. also found that occupants did not change blind positions within a day.
Perhaps, as they hypothesize, occupant preference for window blind position is based on long-term perceptions of solar radiation, and changes within a day are essentially ignored.
Rubin et al. also argued that each occupant has a preferred window blind position relatively independent of seasonal and, possibly, climatic conditions. Certainly the behavior of occupants on the east face was in contradiction to this hypothesis. However, occupant behavior on the south and west faces supported this hypothesis to some extent, although the occlusion values were consistently, but not significantly, less on these faces during the cloudy day. In this regard, it is also interesting to consider data provided by two photographic records made on clear days over 10 years ago, of the south side of the building. Occlusion values were nearly identical to those reported in Table 3. Specifically, the occlusion value for a clear day in March 1972 was 63% [10], and for a clear day in September 1966 was 61% [11]. Even though there were large changes in the positions of particular window blinds there was an almost invariant proportion of window blind occlusions for the whole building face on the clear days. Thus, the idiosyncratic preferences observed here and emphasized by Rubin et al may not be very important. While it is difficult to predict occlusion values for particular windows, an average value (for a set of conditions) may be a satisfactory representation of window blind usage.
Naturally, this interpretation of window blind occlusions may be premature or atypical of other buildings; certainly we have no confidence yet in making
general predictions of occlusion values for all combinations of sky conditions and building faces. Despite these caveats, however, the data presented here and those by Rubin et al seem to support the hypothesis that occupants tend, at least on average, to use the window blind to block solar radiation (heat and light). Such observations from two independent studies strongly imply that investigators might consider occupants’ management of window blinds when estimating daylight factor
Acknowledgements -The author would like to thank M. Ouellette. R.
Perrault and, particularly. R. R. Jaekel for technical assistance on this project.
REFERENCES
1. D.R G Hunt and V.H.C Crisp. Lighting controls: their current use and
possible improvement. Energy Res. 2. 2, 343-374 (1978)
2. D.R.G Hunt. The use of artificial lighting in relation to daylight levels and occupancy Bldg Envir. 14, 21 -33 (1979)
3. S. Treado and T. Kusuda. Daylighting. window management systems. and lighting controls. NBSIR 80-214 7, December (1980)
4. J.W. Ure and V.H.C Crisp. A comparison of lighting control systems Lux Europa Conference Granada May 5 -7 (1981)
5. N.E. Sanchez and Rudoy, Energy impact of the daylighting in offices. ASHRAE Trans. 87, 145-160 (1981).
6. I. E Kaufman (ed.), IES Lighting Handbook, Illuminating Engineering Society of North America, New York (1981).
7. A.I. Rubin, B. L. Collins and R. L. Tibbott. Window blinds as a potential energy saver-a case study. NBS Building Science Series 112 (May 1978). 8. M. S. Rea and R.R. Jaekel. Lighting Energy Conservation: simple
analytic methods with time-lapse photography. Light Res. Technology 15, 77-82 (1983).
9. J. Neter and W. Wasserman. Applied Linear Statistical Models. Richard D. Irwin, Homewood (1974).
10. C. Y. Shaw. D M. Sander and G. T. Tamura, Air leakage
measurements of the exterior walls of tall buildings. ASHRAE Trans . 79, 40-48 (1973)
11. G.T. Tamura and A. G. Wilson, Pressure differences caused by chimney effect in three high buildings. ASHRAE Trans. 73, 1-10 (1967)