S1
Electronic Supporting Information
Slow-targeted release of a ruthenium anticancer agent from vitamin
B
12functionalized marine diatom microalgae
Joachim Delasoie
a, Jérémie Rossier
a, Laetitia Haeni
b,
Barbara Rothen-Rutishauser
band Fabio Zobi*
aa
Department of Chemistry, University of Fribourg, Chemin du Musée 9, 1700
Fribourg, Switzerland.
b
Adolphe Merkle Institute, Chemin des Verdiers 4, 1700 Fribourg, Switzerland
*To whom all the correspondence should be adressed.
Phone (+41) 26 300 87 85, Fax (+41) 26 300 97 37,
S2
Contents
Experimental section
Cobalamin derivatives synthesis and characterization ... 3
Vitamin B
12derivative (B
12-2) ... 3
Vitamin B
12derivative (B
12-3) ... 3
Supporting Figures and Table
Fig.S1. 500 MHz
1H-NMR of B
12-2 ... 4
Fig.S2. 500 MHz
1H-NMR of B
12-3 ... 5
Fig.S3. HPLC chromatograms (B
12, B
12-1, B
12-2, B
12-3) ... 5
Fig.S4. Ninhydrin test of surface functionalization ... 7
Fig.S5. Release of [Ru((Et
2N)
2bpy)
3]Cl
2in PBS pH 7.4. ... 8
Fig.S6. Representative images. DEMs pieces and cells counting. ... 8
Fig.S7. SEM image of MCF-7 cells exposed to DEMs-B
12-1. ... 9
Fig.S8. Bright field images ... 9
S3
Cobalamin derivatives synthesis and characterization
Vitamin B12 derivative (B12-2)
The cyanide upper part of the vitamin B12 was modified in order to label the molecule with a
fluorescent dye. For this purpose a FAM azide, 6-isomer supplied from Lumiprobe Life Science Solutions was linked to the vitamin B12 through a 1,4-DIETHYNYLBENZENE bridge.
The vitamin B12 was reacted under conditions previously described by Gryko et al. (reference
16 in manuscript) to give the B12-2 (see in Scheme 1).
1H NMR (500 MHz, MeOD-[d4]): δ = 7.23 (s, 1H), 7.20 (s, 1H), 7.16 (d, J = 8.3 Hz, 1H), 6.79 (d, J = 8.3 Hz, 1H), 6.62 (s, 1H), 6.19 (d, J = 2.65 Hz, 1H), 5.98 (s, 1H), 4.81-4.78 (m, 2H), 4.63-4.55 (m, 2H), 4.41-4.31 (d, J = 10.45 Hz, 1H), 4.26-4.18 (m, 3H), 3.70-3.62 (m, 9H), 3.62-3.56 (m, 4H), 3.53 (m, 2H), 3.45 (s, 1H), 3.28-3.15 (m, 4H), 3.11 (t, J = 6.40 Hz, 2H), 2.95 (dd, J = 8.50, 5.60 Hz, 1 H), 2.83 (q, J = 5.4 Hz, 1H), 2.61-2.52 (m, 12H), 2.52-2.38 (m, 5H), 2.33 (d, J = 13 Hz, 1H), 2.29 (s, 1H), 2.28 (s, 3H), 2.26-2.18 (m, 1H), 2.13-2.05 (m, 1H), 2.03 (s, 1H), 2.01 (s, 1H), 2.00-1.87 (m, 6H), 1.85 (s, 1H), 1.84-1.82 (m, 1H), 1.80-1.70 (m, 3H), 1.47 (s, 3H), 1.35 (s, 3H), 1.34-1.31 (m, 1H), 1.30 (s, 3H), 1.24 (d, J = 6 Hz, 3H), 1.20-1.14 (m, 1H), 1.12 (s, 3H), 0.51 (s, 1H) ppm; 13C NMR (125 MHz, MeOD-[d4]): δ = 179.9, 178.2, 177.6, 177.5, 176.9, 176.01, 176.97, 175.6, 175.0, 174.4, 174.0, 166.4, 165.9, 158.8, 143.6, 138.8, 135.1, 133.4, 132.7, 131.9, 131.6, 128.3, 121.0, 118.7, 111.9, 108.2, 104.9, 102.6, 95.4, 88.0, 86.2, 84.1, 81.25, 81.20, 79.5, 75.7, 75.2, 73.6, 73.5, 71.5, 71.1, 71.0, 70.7, 70.4, 69.5, 64.5, 59.8, 56.9, 56.6, 55.2, 52.2, 46.43, 46.40, 44.0, 43.3, 40.2, 39.9, 39.0, 36.4, 35.4, 33.3, 33.2, 32.7, 32.6, 32.0, 31.0, 29.6, 28.2, 27.5, 27.4, 20.9, 20.4, 20.3, 20.16, 20.13, 20.0, 17.5, 17.1, 16.4, 16.2 ppm; HRMS (ESI+): [M+2Na]2+ = 872.8699, calculated for C83H115Co1N15O18P1Na2 = 872.8697. Vitamin B12 derivative (B12-3)
For this purpose, B12-2 was coupled by click reaction to the FAM azide dye. 20mg of B12-2
(13.8mmol) and 4.1mg of FAM azide dye were solubilize in 0.65ml DMF. Afterwards, 0.5mg of CuSO4 (0.2eq) and 2.5mg of TBTA were dissolved in 0.35ml H2O before being added to the reaction mixture. Finally, 2.5mg of Vitamin C (ascorbic acid) were added to the mixture and reacted overnight at room temperature before recovering the desired product, B12-3, with
70% yield. 1H NMR (500 MHz, MeOD-[d4]): δ = 8.08 (s, 1H), 7.94 (s, 2H), 7.50 (s, 1H), 7.38 (s 1H), 7.36 (s, 1H), 7.22 (s, 1H), 7.18 (s, 1H), 6.88 (s, 1H), 6.86 (s, 1H), 6.67 (br s, 2H), 6.62 (s, 1H), 6.52 (br s, 2H), 6.45 (d, J = 9 Hz, 1H), 6.39 (br s, 1H), 6.18 (d, J = 2.80 Hz, 1H), 5.97 (s, 1H), 5.10 (s, 1H), 5.65-5.56 (m, 1H), 4.51 (s, 3H), 4.46 (dd, J = 6.16 Hz, 1H), 4.44-4.31 (m, 1H), 4.22 (br s, 3H), 3.85 (br s, 3H), 3.70-3.48 (m, 16H), 3.46-3.40 (m, 2H), 3.20 (q, J = 7.40 Hz, 8 H), 3.10 (t, J = 6.34 Hz, 2H), 2.93 (dd, J = 8.45, 6.0 Hz, 1H), 2.80 (qt, J = 6.0 Hz, 1H), 2.69 (s, 2H), 2.63-2.54 (m, 6H), 2.54-2.49 (m, 6H), 2.49-2.36 (m, 5H), 2.28 (s, 3H), 2.27 (s, 3H), 2.25-2.15 (m, 3H), 2.12-1.87 (m, 4H), 1.85 (s, 3H), 1.83-1.67 (m, 4H), 1.46 (s, 3H), 1.35 (s, 3H), 1.32-1.26 (m, 18H), 1.22 (d, J = 5.55 Hz, 3H), 1.17 (s, 3H), 1.15 (s, 3H), 0.89 (t, J= 6.5 Hz, 1H), 0.50 (s, 3H); HRMS (ESI+): [M+H+Na]2+ = 1090.9403, calculated for
S4
Fig.S1. 500 MHz 1H-NMR of B
S5
Fig.S2. 500 MHz 1H-NMR of B
S6
Fig.S3. HPLC chromatograms (B12, B12-1, B12-2, B12-3).
The HPLC analyses were done on a Macherey-Nagel Nucleodur C18 HTec column (5 μm particle size, 250 × 4.6 mm). Aqueous trifluoroacetic acid 0.1% solution and pure methanol were respectively used as solvents (A) and (B). The compounds were separated using the following gradient: 0–5 min (75% A), 5–35 (75% A → 0% A), 35–45 min (100% B), the flow rate set to 0,5 mL min−1 and detected at 265 nm. The retention times for the B12 and his
S7
Fig.S4. Ninhydrin test to check surface functionalization.
(A) Scheme of the Ninhydrin dimerization in the presence of primary amines at the surface of silica dioxide. (B) From left to right, Picture of the unmodified DEMs, APTES functionalized DEMs and B12 modified DEMs in few milliliters of a staining solution (3.5mg/ml ninhydrin in
pure ethanol). If primary amines are present, the solution turn blue-purple, as visible in the middle sample, the suspension of APTES modified DEMs.
The ninhydrin revelation test was performed to assess the successful functionalization of the DEMs surface. Three test tubes were loaded with unmodified DEMs, APTES modified DEMs and DEMs-B12-1 (from left to right, Figure S3B). After staining with a fresh ninhydrin solution,
these three test tubes showed colorations of limpid-incolor, blue-purple and limpid-incolor with reddish glints respectively. This result give the evidence that the surface of DEMs was firstly modified with APTES before being further functionalized with B12-1 since all the amines
S8
Fig.S5. Release of [Ru((Et2N)2bpy)3]Cl2 in PBS pH 7.4.
From left to right, unmodified (A), hydroxylated (B), APTES functionalized (C) and B12
functionalized DEMs (D). Release in PBS buffer pH 7.4 with 1%EtOH. Reddish coloration visible on the wall of the eppendorfs after centrifugation, the DEMs lay on the bottom.
Fig.S6. Representative images. DEMs pieces and cells counting.
Representative Bright field image of the colorectal cancer HT-29 cell line immersed 1h with 200 ug mL-1 DEMs-B
12-1 before being deeply washed with fresh media. Left, cells counting
S9
Fig.S7. SEM image of H cells exposed to DEMs-B12-1.
Representative image of MCF-7 cells immersed 1h with 200 ug mL-1 DEMs-B
12-1 before
being deeply washed with fresh media. The typical shape of the cylindrical diatoms are clearly identified.
Fig.S8. Bright field images of colorectal cancer cell line HT-29 exposed to: (A1) 200 μg mL-1
of unmodified DEMs; (A2,3) 200 μg mL-1 of DEMs-B12-1. (B) Scheme of the DEMs
S10
images of breast cancer cell line MCF-7 exposed to: (E1) to 200 ug mL-1 of unmodified DEMs; (E2) to 200 μg mL-1 of DEMs-B12-1.
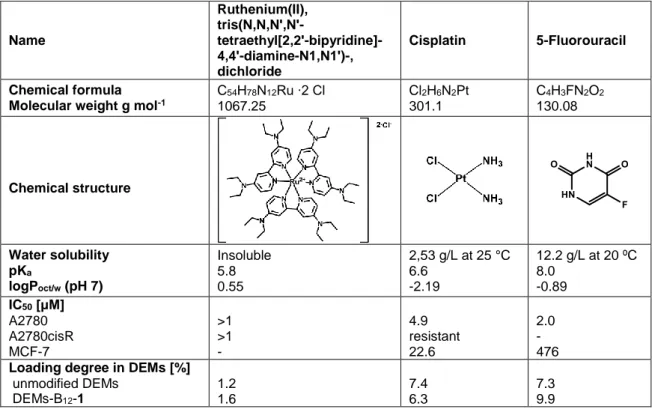
Table 1. Physicochemical properties of drug candidates. 4, Cisplatin and 5-FU were used as
drug candidates. Data obtained from Zava et al.1, Dasari & Tchounwou2 and Yang et al.3
Name Ruthenium(II), tris(N,N,N',N'- tetraethyl[2,2'-bipyridine]-4,4'-diamine-N1,N1')-, dichloride Cisplatin 5-Fluorouracil Chemical formula Molecular weight g mol-1
C54H78N12Ru ∙2 Cl 1067.25 Cl2H6N2Pt 301.1 C4H3FN2O2 130.08 Chemical structure Water solubility pKa logPoct/w (pH 7) Insoluble 5.8 0.55 2,53 g/L at 25 °C 6.6 -2.19 12.2 g/L at 20 ºC 8.0 -0.89 IC50 [μM] A2780 A2780cisR MCF-7 >1 >1 - 4.9 resistant 22.6 2.0 - 476
Loading degree in DEMs [%] unmodified DEMs DEMs-B12-1 1.2 1.6 7.4 6.3 7.3 9.9
1 Olivier Zava et al., “A Cytotoxic Ruthenium Tris(Bipyridyl) Complex That Accumulates at Plasma
Membranes,” ChemBioChem 10, no. 11 (2009): 1796–1800, https://doi.org/10.1002/cbic.200900013.
2 Shaloam Dasari and Paul Bernard Tchounwou, “Cisplatin in Cancer Therapy: Molecular Mechanisms
of Action,” European Journal of Pharmacology 0 (October 5, 2014): 364–78, https://doi.org/10.1016/j.ejphar.2014.07.025.
3 Wanjuan Yang et al., “Genomics of Drug Sensitivity in Cancer (GDSC): A Resource for Therapeutic
Biomarker Discovery in Cancer Cells,” Nucleic Acids Research 41, no. D1 (2013): D955–61, https://doi.org/10.1093/nar/gks1111.