HAL Id: hal-02917660
https://hal.archives-ouvertes.fr/hal-02917660
Submitted on 19 Aug 2020
HAL is a multi-disciplinary open access
archive for the deposit and dissemination of
sci-entific research documents, whether they are
pub-lished or not. The documents may come from
teaching and research institutions in France or
abroad, or from public or private research centers.
L’archive ouverte pluridisciplinaire HAL, est
destinée au dépôt et à la diffusion de documents
scientifiques de niveau recherche, publiés ou non,
émanant des établissements d’enseignement et de
recherche français ou étrangers, des laboratoires
publics ou privés.
LSTM-based radiography for anomaly detection in
softwarized infrastructures
Alessio Diamanti, José Manuel Sanchez Vilchez, Stefano Secci
To cite this version:
Alessio Diamanti, José Manuel Sanchez Vilchez, Stefano Secci. LSTM-based radiography for anomaly
detection in softwarized infrastructures. International Teletraffic Congress, IEEE, Sep 2020, Osaka,
Japan. �hal-02917660�
LSTM-based radiography for anomaly detection in
softwarized infrastructures
Alessio Diamanti
∗†, Jos´e Manuel Sanchez Vilchez
∗, Stefano Secci
†∗ Orange Labs, Orange, 92320 Chˆatillon, France. Email: [email protected]
,
†Cnam, Paris, 75003 Paris, France. Email: [email protected]
Abstract—Legacy and novel network services are expected to be migrated and designed to be deployed in fully virtualized environments. Starting with 5G, NFV becomes a formally re-quired brick in the specifications, for services integrated within the infrastructure provider networks. This evolution leads to deployment of virtual resources Virtual-Machine (VM)-based, container-based and/or server-less platforms, all calling for a deep virtualization of infrastructure components. Such a network softwarization also unleashes further logical network virtualiza-tion, easing multi-layered, multi-actor and multi-access services, so as to be able to fulfill high availability, security, privacy and resilience requirements. However, the derived increased compo-nents heterogeneity makes the detection and the characterization of anomalies difficult, hence the relationship between anomaly detection and corresponding reconfiguration of the NFV stack to mitigate anomalies. In this article we propose an unsupervised machine-learning data-driven approach based on Long-Short-Term-Memory (LSTM) autoencoders to detect and characterize anomalies in virtualized networking services. With a radiography visualization, this approach can spot and describe deviations from nominal parameter values of any virtualized network service by means of a lightweight and iterative mean-squared reconstruction error analysis of LSTM-based autoencoders. We implement and validate the proposed methodology through experimental tests on a vIMS proof-of-concept deployed using Kubernetes.
I. INTRODUCTION
Network automation is a vibrant research area targeting the deployment of novel solutions in operational networks in the coming few years. Even though initial network automation research actually dates back up to a few decades ago, true network automation fueled by artificial intelligence (AI) and machine learning (ML) has only recently become a tangible possibility for operational services, thanks in particular to novel technologies related to Software Defined Networking (SDN) - with the specification of open configuration interfaces - and Network Functions Virtualization (NFV) - breaking the coupling between network functions and the hosting hardware. In the past few decades, the community has addressed challenges related to how to let distributed sets of agents self-organize, automatically discover themselves the network states, and operate necessary reconfiguration of the network. This was for the focus of many research projects in the area of autonomic networks [1]. We can also cite standardization activities related to network automation, as for instance the ones related to the autonomic signaling protocols among distributed decision-making agents [2]. Nonetheless, these pio-neering research activities did lack a stable reference technical
architecture on top of which a decision-making framework could be developed and deployed at large scale, for instance to solve routing or resource allocation optimization problems. With the advent of network virtualization technologies, the reference building blocks for 5G infrastructures, and beyond, are today clearly specified and adopted. On the one hand, the relative maturity of NFV-SDN systems has focused the industry specification efforts on the interfaces required for network automation, somehow meeting the expectation of former autonomic networking research, but now with an operational environment ready for their integration. The Zero-Touch Network and Service Management and Experiential Networked Intelligence groups at ETSI are addressing this need and recently produced a set of specifications [3; 4]. On the other hand, network automation platforms recently emerged, notably the Open Network Automation Platform, chosen by many operators as a reference platform for network automation [5; 6; 7]. More recently than for the core segment, the radio one is undergoing an increasing softwarization, with new platforms as the Open Radio Access Network one [8; 9]. These activities are opening the way to orchestration decisions for which there is a critical need of automation algorithms and methods to (i) determining how the state of a fully virtualized and programmable infrastructure, composed of a variety of software modules, should be modeled, (ii) inferred in runtime, and (iii) to support automated network orchestration.
This paper presents a first brick in this direction and proposes a methodology to detect anomalies in the rather unidentified network state space composed of a very large number of software components. These components can be characterized of a large number of metrics, changing in num-ber and behavior in time, that can be correlated or not to each other, depending on network conditions. This undefined and varying environment motivates us to propose a unsupervised machine learning framework for anomaly detection of NFV infrastructures. We run tests in a virtualized IP Multimedia Subsystem (IMS) architecture, the legacy framework used for voice-over-IP traffic routing and processing. Simulated call distributions and used datasets are available at [42].
In Section II, we draw the background on anomaly detection in softwarized networks. We present our framework, named SYRROCA (SYstem Radiography and ROot Cause Analysis), in Section III, and discuss experimental results in Section IV. Section V concludes the paper.
II. BACKGROUND
Anomaly detection in SDN/NFV systems is particularly challenging due to the reasons we summarize as follows:
Multi-layered nature of softwarized networks: On one hand, SDN separates the control-plane from the forwarding plane, which implies a three-layered architecture grouping devices, controllers and service abstraction elements [10]. On the other hand, NFV concerns the abstraction of the network function itself from the physical hardware. This approach requires a concrete NFV architecture composed of the NFV Infrastruc-ture (NFVI) layer, the VNF layer, and the network service layer [11] . The 5G architecture is multi-layered by design; its specification formally requires a NFV system, which can be completed for ease of deployment by SDN controllers. Detecting anomalies and determining how they propagate across the different logical layers become challenging tasks.
New faults and vulnerabilities: In SDN/NFV environment, the decoupling of the physical hardware from the network function opens the way for new types of faults that did not exist in legacy hardware-based networks or had not a so important impact to the communication infrastructure. New vulnerabilites can be grouped in hypervisor-specific, VNF application-specific, operating system vulnerabilities and bugs, SDN controller bugs and novel SDN protocol vulnerabilities. Furthermore, in both SDN and NFV architecture, as well as IoT access and radio access architecture, we observe a centralization of control, orchestration and configuration func-tions that makes them critical points of failure and vectors of large-scale attacks [12]. Detecting system-level faults due to overload, attacks and changing network and service conditions is therefore more important than in legacy systems.
Flexible network provisioning and reconfiguration: SDN and NFV open the door to an elastic usage of the compute, storage and networking resource stacks, such as for instance scaling of VNFs to overcome faults at physical substrate to continue delivering the expected service. The decision-making related to the provisioning and reconfiguration of already-provisioned service is therefore challenged in that the dependencies of the delivered services from the underlying resources continuously evolve (e.g., network and system state changes) demanding an intelligent management of network and system resources in a real-time or near-real-time fashion. These factors depict a complex framework that, differently from legacy single-operator, single-vendor, single-integrator, and/or single-editor environment - or an environment locked by few stakeholders having direct control of all components - does evolve as a function of the conditions of a large set of software components, edited and managed by a large and varying set of stakeholders. The high heterogeneity deriving from such a rich environment does call for a data-driven frame-work rather than a model-based one, to scale with the multiple dimensions of the virtualized infrastructure components. We propose a possible learning framework for detecting anomalies at each level composing virtualized infrastructure architec-tures, hence spotting anomalies, with the goal of triggering
and fueling network (re-)orchestration logic. We also propose a complete and compact representation to correlate faults among layers, easing root cause analysis.
We summarize in the following the state of the art in network resilience, anomaly detection and machine learning that inspired our methodology.
A. Network Resilience
Resilience is the ability of the network to provide and main-tain an acceptable level of service in presence of impairments such as faults or attacks. Its modeling is challenging because instead of being quantifiable with one or few metrics, re-silience is rather a system-wide property that depends on many factors. Authors in [13] deem that complexity in modelling resilience come from the varied nature of provided services, the numerous layers and corresponding parameters, and the impairments threatening network stability.
Nevertheless, attempts to model and define network re-silience do exist. Authors in [14] formalize the notion of resilience for IP networks using three factors: dropped IP traffic, QoS (Quality of Service) degradation, and network recovery time under several attack scenarios; however, the study only covers the IP layer and its security, leaving out non-intentional scenarios impacting resilience. Authors in [15] define resilience as the largest number of component failures that do not impede the network to operate under normal conditions. However, this definition does not allow to describe how faults at a given layer or component propagate across layers, which is essential in multi-layer architectures such as SDN/NFV. Authors in [16] propose a way to measure resilience based on the capability of the network to get back to a normal state after a disruptive event. This definition is rather more appropriate to quantify how fast a system is able to get back to a normal state after a disruption: indeed, this formulation focuses the recoverability dimension of resilience. Authors in [18; 19; 20] model network resilience with a multi-layer approach, referring to mobile ad-hoc networks as application case. Network resilience is assessed as a function of the network deviation between two network states caused by anomalies. Identifying the states and their borders is a chal-lenge that may be tackled using anomaly detection techniques. B. Machine learning for anomaly detection
Machine learning techniques, and in particular unsupervised ones, are appropriate for the detection and characterization of anomalies in heterogeneous softwarized infrastructure environ-ments, where labeled data are not available. Authors in [21] advocate for leveraging SDN principles to conceive scalable anomaly detection mechanisms. They developed a two-stage anomaly detection algorithm based on feature selection and Density Peak-Based Clustering to handle large-scale, high dimensional, and unlabeled network data.
On the other hand, authors in [22] propose an anomaly detection algorithm based on a probabilistic approach using mixture models to target data leading to a few anomalies.
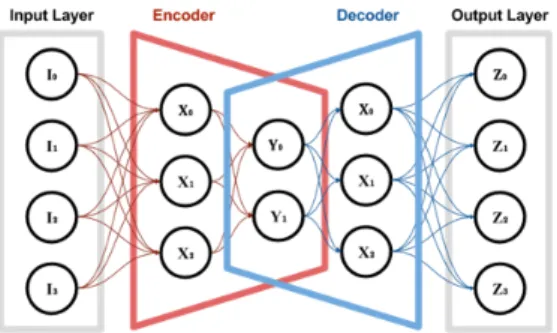
Fig. 1: Autoencoder (AE) basic architecture
The application domain concerns intrusion detection in UNIX machines based on the analysis of process system calls.
Authors in [23] propose an unsupervised learning approach based on correlation variation algorithm to predict perfor-mance anomalies in VNF service chaining. It infers the service health status by collecting metrics from multiple elements in the VNF chain analyzing their correlation across time. C. Deep LSTM-based Autoencoders
An autoencoder (AE) is a multi-layer Neural Network (NN), composed of two blocks, an encoder and the decoder. The typical architecture of an AE is shown in Fig. 1.
The encoder reduces the n dimensions of the input to s dimensions (latent-space), while the decoder takes those s dimensions to reconstruct back the input.
The AE is trained to learn how to reproduce the input vector X of n features ∈ IRn by optimization of:
f, g minimize|I − g ◦ f (I)| (1) where f : I ∈ IRn 7→ Y ∈ IRs with s < n is the function representing the encoder, and g : Y ∈ IRs 7→ Z ∈ IRn is the function representing the decoder. Thus, during the learning phase, weights and biases are tuned to minimize the reconstruction error on I. Composing several encoder and decoder layers to build a Deep Autoencoder (DAE) allow to effectively represent complex distributions over I [24].
AEs can be used to detect anomalies as the decoder block compresses the data input dimensionality. Assuming that input data has certain correlation level [23], it can be embedded into a lower dimensional subspace, where anomalous samples are perceived significantly different which makes the recon-struction error increase significantly. AEs are considered as auto-supervised NN, as the target value is the input itself, so no labels are required in the training phase: for our targeted virtualized network infrastructure environment, this factor streamlines learning as labelling anomalies is at least difficult, if not sometimes impossible, due to the great extent of faults and threats that can affect NFV environments.
When analyzing multivariate time series, each variable tem-poral dynamic and temtem-poral variables cross-dependencies are paramount and must be caught to effectively grasp knowledge from the input data. When it comes to dealing with time series problems accounting for the temporal dimension, Recur-rent Neural Network (RNN) are generally used [25]. Unlike Feed Forward (FF) NNs where each element is processed
independently of the others, RNNs apply a recurrent relation at every time step to process a sequence in order to take into account past inputs, like a sort of memory. Neverthe-less, many studies as [26] report that RNNs suffer from the vanish gradient problem, preventing long-term relations to be learned. To solve this problem, authors in [27] propose the use of Long Short Term (LSTM) RNN that enforce constant error flow through the internal states of special units called memory cells by employing multiplicative gates to learn long term sequence correlations and to model complex multivariate sequences [28]. In the context of network traffic and load forecasting, LSTMs demonstrated to outperform non-ML and other deep neural networks (DNN) approaches [29; 30; 31; 32] In [33] authors propose a mechanism to scale 5G core resources by anticipating traffic load changes through LSTM and DNN forecasting. They show that LSTM-based detection is more accurate than DNN one, thanks to the ability of LSTM to store data pattern without degradation over time. Similarly, authors in [34] propose to use CNN to extract traffic patterns used by an LSTM NN to forecast traffic load. Simulations show that it can allow reducing by 50% the duration of the training phase of the LSTM NN. LSTM NNs have been used to adapt network baseline estimation to changes in cloud environments as well, as described in [35]. Authors propose to create a network baseline through LSTM AEs, adapting it when metric trend changes. They show that the proposed adaptation improves prediction accuracy by 22%.
Our contribution: Motivated by the efficiency of LSTM approaches in anomaly detection for time-series in general, and the recent advances in the field of 5G systems from preliminary applications in networks [35; 33], in this paper we document our efforts towards the definition of an LSTM-based autoencoder approach to detect and characterize anomalies in softwarized network environments. Starting from metrics collected at both physical and virtual (container) levels, we propose a methodology to detect anomalies and make a radiography, a complete and compact view, of the running state of a virtualized network service. Through our methodology it is not only possible to make a radiography of a whole service, but also of their inner components (e.g. containers or VMs) hence supporting root cause analysis to explain the network state deviation.
III. SYRROCA (SYSTEMRADIOGRAPHY ANDROOT
CAUSEANALYSIS)FRAMEWORK
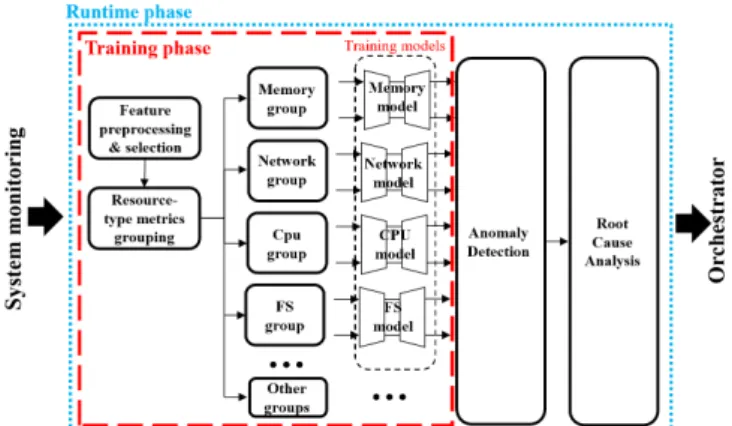
We describe the SYRROCA framework to make real-time radiographies of a virtualized network function service. Fig-ure 2 draws a simplified diagram of the proposed framework, we develop in the following.
A. Data collection and preprocessing
No matter which monitoring software is used to extract metrics from a virtualized system, metrics can be grouped in Counters and Gauges (terms commonly used in recent opensource platforms) types. Gauges category groups metrics whose numerical value arbitrarily go up and down, like for
Fig. 2: Representation of the proposed SYROCCA framework. example memory consumption or CPU temperature. Counters-like metrics instead represent monotonically increasing values, such as number of sent/received packets, or total CPU time used by a process. Thereby, concerning anomaly detection in such a heterogeneous dataset composed of both metric types, we must first pre-process those collected raw data to treat. In counters-like metrics we retain the increment between two time steps, as those can be characterized by their increments rather than the cumulative values. In gauge-like metrics we keep their real value. We propose then a divide-and-conquer approach that groups the features by resource type. In our experiments, we use CPU, network, memory and file system-related metrics but additional sources of metrics can be safely added to the framework with no restriction. In this way, we can focus the analysis on a specific type of resource to get an insight on the type of anomaly to ease root cause analysis.
Since some metrics values may have a relatively big mag-nitude and others may have a small one, it is important to re-scale the input data into a uniform range. This is especially important for LSTMs, which are sensitive to the scale of the input data when the (default) sigmoid or tanh activation functions are used, but it is in general true for whatever neural network trained with a gradient descend algorithm [36]. In the state of the art two techniques are proposed to re-scale data: standardization and normalization; the former assumes that observations fit a Gaussian distribution (with a well behaved mean and standard deviation) and consists in shifting the distribution of each metric to have a mean of zero and a standard deviation of one (unit variance), while the latter consists in transforming the original metrics range so that all values fall within the [0, 1] range.
For our use-case experiments, a quick analysis of each metric distribution revealed that none of them has a Gaussian-like distribution, thus normalization is selected as re-scaling technique. To validate this assumption we also tried to apply standardization and train our AEs, which confirms normaliza-tion makes the analysis more accurate and stable.
B. Training
During the training phase, SYRROCA builds a model of the system during the delivery of a virtualized service. AEs are trained with a dataset built in nominal conditions and
without injected anomalies, so that they can learn an abstract representation of what is considered to be a nominal state. It is worth noting that both the quality and the extent of the data used for the training phase greatly affect the extracted representation. In fact, for the training, it is important to provide to the AEs anomaly-free data and cover a sufficient period of time to provide enough insights on the dynamics to be learnt. In section IV we detail how we produced and dimensioned this training dataset for the vIMS use-case. As anticipated in the previous section, we split the training dataset in several sub-datasets each of them fed to a dedicated deep AE, whose architecture is detailed in section IV. While not strictly required for the following analysis, per-group dataset split makes AEs architecture design, training process and root cause analysis easier. Indeed, learning on all features at once, theoretically make the AE able to learn the inter-dependencies between all the features, but it does also increase the input dimensions making learning slow and hard.
C. System radiography and root cause analysis
Reconstruction capabilities of a trained AE can be evaluated by means of the Mean Squared Error (MSE), defined as:
M SEg(t) = 1 n n X i=1 [˜xgi(t) − xgi(t)]2 (2) where X˜g(t) = [˜xg1(t), ..., ˜xgn(t)] ∈ IR n and Xg(t) = [xg1(t), ..., xgn(t)] ∈ IR n
are respectively the output and the input of the AE working on group g. According to state of the art, anomalies are recognized as those samples whose M SE exceed a threshold value Tg. We set the 99th-quantile
as threshold for each metrics group.
Using such a threshold to identify a deviation from the nominal state is a widely used practice that unfortunately does not allow neither to assess intensity of the deviation nor to characterize it. Here, we address this issue by proposing a measure of the features contribution to the MSE, we denote as p(i, t); it is computed as the feature-wise reconstruction Squared Error SE(i, t) = [Xi(t) − ˜Xi(t)]2 over the sum of
the squared errors across all the features: p(i, t) = PnSE(i, t)
i=1SE(i, t)
(3) Doing so, the closer p(i, t) is to 1, the stronger is the contribution of feature Xi to the reconstruction error.
Let us define A = {p(1, t), ..., p(n, t)} and B = (A, <) = {b1, b2, ..., bn} as the set of increasingly ordered p(i, t). Thus,
taking b1, ..., bs∈ B with s ≤ n so that: s
X
i=1
bi≥ 0.9 (4)
the features corresponding to these first s values of p(i, t) ∈ B are those that were reconstructed with the highest error and jointly contribute to at least 90% of the reconstruction error. Therefore the set of features:
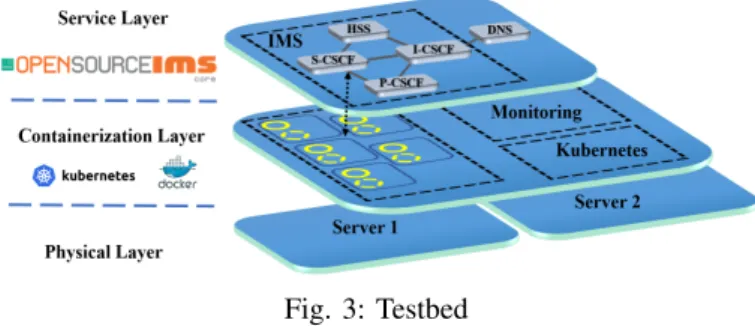
Fig. 3: Testbed
contains the ordered list of most representative features for the deviation identified at time t.
Furthermore, we observed that the more metrics values and dynamics deviate from the learned nominal state, the more M SEg(t) increases. Hence, M SEg(t) can be also used to assess relative intensities of different deviations detected in a specific group g. Nevertheless, magnitudes of M SEg(t) for different groups cannot be compared, as each M SEg(t) is computed on a different group of features.
A deviation from the nominal state does not definitely imply a degradation of provided service quality. To understand how anomalies impact the service, we propose to combine the re-construction error M SEgwith a service metric to obtain a 2D density plot, referred in the remainder of the paper as radiog-raphy, given its visual similarity with common radiographies. In statistics, the Kernel Density Estimation (KDE) is used to estimate the probability density function of bi-variate random variables. Here we use the same technique to estimate density of the bi-variate functions fg(M SEg, < service metric >).
Those functions describe how each M SEg of a metrics group
is related to values of the selected service metric. Therefore, computing the density of these functions, it is possible to locate the most frequent groups of fgsamples, that is the most
frequent couples (M SEg, < service metric >) occurred during the considered time-window. A color scale mapping density from high to low with colors from black to white, is then used to visualize the computed KDE, obtaining the so-called radiography. We propose this representation as a compact view of the system state with reference to the quality of the service delivered, through which rapidly identify metrics group characterizing the detected deviation. For simplicity, we consider as service metric the number of failed calls, whatever is the reason causing the call failure. Therefore, it is possible to build four radiographies respectively for gCP U, gmem, gnet
and gf s groups. Imaging a radiography showing a dark zone
for group gmemcorresponding to several failed call, while the
remaining radiographies showing dark zones corresponding to a negligible value of failed call, it is fairly intuitive to identify the root cause to be somehow linked to an anomaly regarding the memory.
IV. EXPERIMENTAL RESULTS
In this section we describe a proof of concept imple-mentation of the aforementioned methodology applied to a virtualized core IMS (IP Multimedia Subsystem).
A. Testbed
An IMS is a framework for delivering IP multimedia services mainly composed of the following network functions:
• HSS (Home Subscriber Server): database containing
sub-scriber’s profiles performing authentication and autho-rization;
• P-CSCF (Proxy Call Session Control Function): the SIP proxy server that is the first point of contact for the users;
• S-CSCF (Serving-CSCF): SIP server and session con-troller, it is the central node of the signaling plane;
• I-CSCF (Interrogating-CSCF): the SIP function located at the edge of an administrative domain; it assigns an S-CSCF to a user performing SIP registration.
We used the opensource OpenIMSCore IMS [37] functions, deployed as separated containers managed by Kubernetes [38]. Kubernetes is an open-source container-orchestration system that aims to provide a platform for automating deployment, scaling, and operations of application containers across clus-ters of hosts. From a network perspective, containers are some-how equivalent to VMs, but have a relaxed isolation due to operating system sharing among the applications. However, a container has its own filesystem, CPU, memory, process space and networking space that are reserved upon host resources through kernel primitives. Kubernetes implements the pattern of multiple cooperating processes which form a cohesive unit of service through the ‘Pod’ abstraction; Pods are groups of containers sharing storage and network. Figure 3 depicts vIMS pods and containers location across both physical servers composing our deployment. Those servers are equipped with an Intel(R) Xeon(R) CPU E5-2620 v4 @2.10GHz with 384 GB of RAM, connected to the same network through a 1 Gbps port physical switch. All the vIMS functions are deployed in a single Pod located in first server, while Kubernetes core components are deployed as a single pod in the second server. The second server hosts the SIPP [40] traffic simulator used to inject SIP and RTP traffic into the platform as two pods representing the caller and the callee. The whole platform is monitored through Prometheus node-exporters [41] for the physical level, while Pods and container are monitored through Kubernetes embedded CAdvisor [43] agent. Both exporters are compliant with Prometheus data model and architecture so that metrics can be exported through GET requests at a specific polling frequency. Furthermore, collected metrics are explicitly typed as counters or gauges, so that pre-processing becomes easier. In our deployment metrics are directly collected from both CAdvisor and NodeExporter with a Java script that stores metrics in a column-like format every 5 s. Training SYROCCA on a such fine grained frequency, could be very resource and time consuming, thus we re-sampled to a 30 s frequency. B. LSTM-based Autoencoder architecture
AE design and hyper-parameter tuning are milestones to build an effective and performing ML model. It is important that the chosen architecture is carefully adapted to the analyzed dataset characteristics. In this section we report how we
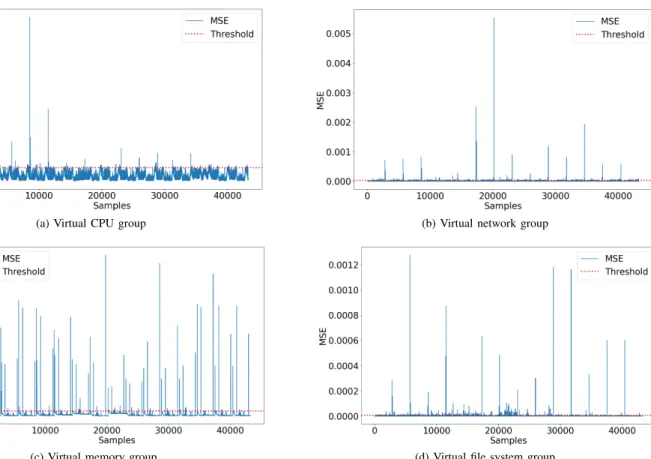
(a) Virtual CPU group (b) Virtual network group
(c) Virtual memory group (d) Virtual file system group
Fig. 5: Training MSE for each metrics group.
Fig. 4: SYROCCA deep Autoencoder architecture. calibrated the AEs architecture and hyper-parameters through several experiments performed on different combinations.
Encoder and decoder layers depicted in Figure 4 are com-posed of two LSTM cells and one dropout regularization level that helps prevent over-fitting, which particularly affects Deep NN [44]. According to the state of the art, over-fitting can be reduced fitting all possible different NNs architectures on the same dataset and then average the predictions from each model [45]. However, this is not feasible in practice. With dropout, during training, some of layer outputs are randomly ignored (i.e. ”dropped out”). Therefore some layers look-like one with a different number of nodes and connectivity to the prior layer, mimicking different architectures.
It is worth noting that the batch size and the epochs are particularly sensitive to training set length and time series frequency. A widely accepted best practice is to set batch size value proportional to the number of training samples.
C. Training on a nominal scenario
During the learning phase we want to learn an abstract representation of a reference scenario to detect deviations from that reference scenario during the test phase.
To do that, we simulate a nominal scenario where several SIP clients get first registered to the vIMS core and then start a call. SIPp traffic generation tool is used to generate SIP traffic towards the IMS and make calls between simulated users. Both RTP data traffic and SIP signaling traffic are transported over UDP. To simulate realistic traffic, we used real call traffic profiles extracted from a given LAC (Location Area Code) from Orange 3G network. We injected two weeks (March 16-29, 2020) of this traffic distribution onto the vIMS containerized platform under test. We set the average call duration to 3 min according to [46]. Moreover, the vIMS containerized platform is tailored to correctly process this traffic load. Figure 8 reports mean call distribution for the first and the second week as well as an LAC distribution used for testing purpose. Call distributions and obtained datasets are available at [42]. Figure 6 depicts M SEg(t) for the four AEs fed with the virtual CPU, network, memory and file system metrics groups respectively. Note that it is not required to have a MSE equal to zero for time-stamps representing nominal conditions. Nonetheless, we are interested in MSE differences between points to get an insight on the deviations. Through the methodology proposed in section III-C, we found out that in the memory metrics group MSE (6 (c)), 57.4%
(a) vCPU-related group (b) vnetwork-related group
(c) vmemory-related group (d) vfilesystem-related group
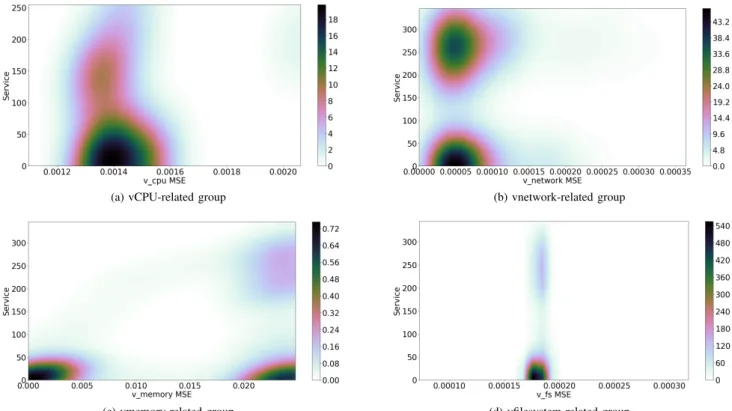
Fig. 6: vIMS system radiographies under packet loss injection.
(a) vCPU-related group (b) vnetwork-related group (c) vmemory-related group
Fig. 7: vIMS system radiographies under call overload injection.
of samples crossing the threshold are characterized by the set of features F =[MEMORY FAILURES TOTAL{POD=HSS,
TYPE=PGFAULT, SCOPE=HIERARCHY}, MEMORY FAILURES TOTAL {POD=HSS, TYPE=PGFAULT, SCOPE=CONTAINER}].
However, for CPU, network and file system groups there is no predominant type of features F characterizing those deviations. Therefore, we can conclude that the dynamics of the memory usage of the HSS during normal activity is characterized by a repeated fixed pattern. This pattern has to be taken in consideration when analyzing test datasets as some-thing somehow belonging to nominal operating conditions. It is worth noting that the MSE trend for the virtual CPU group clearly follows the call distribution (Figure 8), which confirms our AEs being able to carefully characterize learning dataset. D. Test phase on degraded conditions
We evaluate the SYROCCA ability to detect and character-ize anomalies under three different degraded scenarios.
The first scenario consists in injecting packet loss in order to generate calls failures. SIPP allows simulating packet loss by simply blocking outgoing messages or discarding received messages. In particular, we alter the call distribution of March 16, 2020, blocking 50% of INVITE (SIP message) acknowledgments, causing at least 50% of calls to fail. Figures from 6a to 6c depict the obtained radiography for the test case plotting only anomalous data points. The horizontal axis is the MSE for the analyzed group of metrics while the vertical one is the number of failed calls. Darker zones denote high density regions (M SEg, f ailed calls) while colors from green to white indicate less dense regions. It is worth recalling that the values associated with the color scale correspond to an estimate of the probability density function via KDE, and therefore do not represent a physical density value but only a measure proportional to density. Since Figures 6c, 6b and 6d present high-density zones only for small values of failed calls, one can conclude that CPU, memory and file
Fig. 8: VoIP call distributions emulated in the experiments. system are not behind the service degradation. On the contrary, Figure 6b clearly depicts two high density zones, one of them corresponding to more than 250 failed calls, which clearly indicates that anomalies detected from the network metrics group directly impact vIMS service. Indeed, 90% of detected network anomalies are only characterized by metrics related to sent/received packets from/by SCSCF and PCSF. In fact, when a call fails, the SCSCF generates a Failed call message that is redirected to the PCSCF, and then to the user. Moreover Figure 6a depicts a moderate density zone (light orange ) for more that 250 failed calls, highlighting that the anomaly slightly impacts the CPU. Similarly, in Figures 6c and 6d two slighter low density zones (light violet) corresponding to more than 250 failed calls points out an even slighter impact on memory and file system related metrics.
The second scenario we tested consists in stressing the vIMS core services with a call profile exceeding the resources available to the vIMS network functions. To do that, we in-jected the call distribution of March 16, 2020, but from another LAC than the one used for training, and that serves more users (Figure 8). Actually, even though in our deployment each pod can theoretically use as much memory as the physical server has (best effort deployment), the scripts used to launch IMS services impose a hard-coded memory limit. Nevertheless, we observed that although this script-level limit is not reached, it is possible to overload the vIMS core with a higher amount of traffic as in the selected test LAC. As expected, radiographies from Figures 7a to 7c show that the introduced anomaly evenly impacts CPU, network and memory metric groups, mainly seen as high density zones corresponding to at most 15 failed calls. Furthermore, file system related metrics are nearly not impacted as only few samples are recognized as anomaly making impossible to produce a radiography.
In the third scenario we tested how stressing the phys-ical CPU from inside the PCSCF container is perceived as deviation by the AE trained for the virtual CPU-related metrics group. This will give us an idea on how physical faults can propagate to the container layer. We injected a physical CPU stress which increases over time in increments of 10% during one hour on all 32 CPUs, starting from 10% up to 80% of single CPU capacity. Each CPU stress lasts 450 seconds. Fig. 9 shows that: (i) the AE for the virtual CPU metrics group detects at all times those CPU stress at
Fig. 9: Time evolution of the MSE for virtual CPU-related metrics group, under an increasing CPU stress.
physical level as deviations above the threshold at virtual level, (ii) the M SEg=vCP U(t) increases according to the injected increasing physical CPU load with the same trend. This confirms that the AE can detect deviations at physical and virtual layers and characterize relative intensities of those deviations. This experiment is extensible to virtual network and virtual memory, or other data sources groups. Furthermore, when the 1 hour physical CPU stress ends, that MSE behaviour falls back to the nominal region under the threshold (diamond points).
Applying the methodology described in Section III-C to get an insight on the features describing the anomaly, it turns out that features characterizing anomalies correspond to CPU group F =[CPUUSER SECONDS TOTAL{POD=PCSCF},
CPUUSAGE SECONDS TOTAL{POD=PCSCF}]. This confirms
SYROCCA’s ability to recognize sets of resources that most deviate for any type of anomaly, which can so make the radiography accurate.
V. CONCLUSIONS
In this article we propose a LSTM autoencoder-based methodology to characterize network deviations in softwarized environments by radiography representation and analysis. We validated the proposal with a proof-of-concept based on a vIMS deployed using Kubernetes. While the focus of the presented proof-of-concept results was the virtualized layer, it can be extended to physical layer metrics to characterize possible cross-layer fault propagation. We plan to extend SYROCCA application analysis to other VoIP platforms, such as entreprise Telephone over IP infrastructures, and other NFV use-cases such as the 4G and 5G function clusters, also using more sophisticated NFV/SDN platforms such as OpenCord, OMEC, OPNFV, OSM.
ACKNOWLEDGEMENT
This work was partially supported by the ANR CANCAN project (ANR-18-CE25-0011).
REFERENCES
[1] J. Rubio-Loyola et al. Scalable service deployment on software-defined networks. IEEE Communications Magazine49.12 (2011): 84-93.
[2] M. Behringer et al. A reference model for autonomic networking. draft-ietf-anima-reference-model-07, IETF, 2018.
[3] ETSI GS ZSM 001 V1.1.1. Zero-touch network & service management requirements, 2019.
[4] Experiential networked intelligence; terminology for main concepts, ETSI gr ENI 004, 2019.
[5] A. Boubendir et al. Network slice life-cycle management towards automation. IFIP/IEEE IM 2019.
[6] V.Q. Rodriguez, F. Guillemin, and A. Boubendir. 5G E2E network slicing management with ONAP. ICIN 2020. [7] A. Boubendir et al. 5G edge resource federation:
Dy-namic and cross-domain network slice deployment. IEEE NetSoft2018.
[8] The open radio access network (ORAN) alliance: https: //www.o-ran.org.
[9] Open network automation platform (ONAP). https: //www.onap.org.
[10] E Haleplidis et al. Software-defined networking: Layers and architecture terminology. RFC 7426, IRTF 2015. [11] B. Yi et al. A comprehensive survey of network function
virtualization. Computer Networks 133 (2018): 212-262. [12] S. Secci, A. Diamanti, J. Sanchez Vilchez, and et al. Se-curity and performance comparison of ONOS and ODL controllers. Open Networking Foundation, Informational Report 2019.
[13] P. Cholda et al. A survey of resilience differentiation frameworks in communication networks. IEEE Commu-nications Surveys Tutorials 9.4 (2007): 32-55.
[14] M. Ibrahim. A resiliency measure for communication networks. ICIT 2017.
[15] I. B. Gertsbakh and Y. Shpungin. Network Reliability and Resilience. Springer Briefs in Electrical and Computer Engineering 2011.
[16] Y. Fang et al. Resilience-based component importance measures for critical infrastructure network systems. IEEE Trans. on Reliability65.2 (2016): 502-512. [17] Y. Fang and E. Zio. An adaptive robust framework
for the optimization of the resilience of interdependent infrastructures under natural hazards. European Journal of Operational Research276.3 (2019): 1119-1136. [18] J.P.G. Sterbenz et al. Resilience and survivability in
com-munication networks: Strategies, principles, and survey of disciplines. Computer Networks 54.8 (2010): 1245-1265.
[19] A. Jabbar. A Framework to Quantify Network Resilience and Survivability. PhD thesis, University of Kansas, USA, 2010.
[20] D. Zhang and J. P. G. Sterbenz. Measuring the resilience of mobile ad hoc networks with human walk patterns. RND2015.
[21] D. He et al. Software-defined-networking-enabled traffic anomaly detection and mitigation. IEEE Internet of Things Journal 4.6 (2017): 1890-1898.
[22] E. Eskin. Anomaly detection over noisy data using learned probability distributions. ICML 2000.
[23] D. Cotroneo, R. Natella, and S. Rosiello. A fault correlation approach to detect performance anomalies in virtual network function chains. IEEE ISSRE 2017. [24] C. Zhou et al. Anomaly detection with robust deep
autoencoders. ACM SIGKDD KDD 2017.
[25] R. J. Williams. Learning representations by back-propagating errors. Nature 323.6088 (1986): 533-536. [26] Y. Bengio, P. Simard, and P. Frasconi. Learning
long-term dependencies with gradient descent is difficult. IEEE Trans. on Neural Networks15.2 (1994): 157-166. [27] S. Hochreiter and J. Schmidhuber. Long short-term
memory. Neural computation 9.8 (1997): 1735-1780. [28] P. Malhotra et al. Long short term memory networks for
anomaly detection in time series. Presses universitaires de Louvain 2015.
[29] Z. Cui et al. Deep bidirectional and unidirectional lstm recurrent neural network for network-wide traffic speed prediction. arXiv preprint arXiv:1801.02143 2018. [30] Z. Zhao et al. Lstm network: a deep learning approach
for short-term traffic forecast. IET Intelligent Transport Systems11.2 (2017): 68-75.
[31] X. Ma et al. Long short-term memory neural network for traffic speed prediction using remote microwave sensor data. Transportation Research Part C: Emerging Tech-nologies 54 (2015): 187-197.
[32] A. Dalgkitsis, M. Louta, and G. T Karetsos. Traffic forecasting in cellular networks using the lstm rnn. PCI 2018.
[33] I. Alawe et al. Improving traffic forecasting for 5g core network scalability: A machine learning approach. IEEE Network32.6 (2018): 42-49.
[34] A. Imad et al. An efficient and lightweight load forecast-ing for proactive scalforecast-ing in 5g mobile networks. CSCN 2018.
[35] R. Mijumbi et al. Darn: Dynamic baselines for real-time network monitoring. IEEE NetSoft 2018.
[36] I. Goodfellow, Y. Bengio, and A. Courville. Deep Learning. http://deeplearningbook.org. MIT Press 2016. [37] OpenIMScore: http://openimscore.sourceforge.net/. [38] Kubernetes: http://github.com/kubernetes/kubernetes/. [39] 3GPP release 15: http://3gpp.org/release-15. [40] Sipp: http://sipp.sourceforge.net/. [41] NodeExporter: http://github.com/prometheus/node exporter. [42] SYRROCA : http://github.com/SYRROCA. [43] Cadvisor: http://github.com/google/cadvisor.
[44] G. Hinton et al. Improving neural networks by prevent-ing co-adaptation of feature detectors. arXiv:1207.0580 2012.
[45] N. Srivastava et al. Dropout: a simple way to prevent neural networks from overfitting. The journal of machine learning research15.1 (2014): 1929-1958.
[46] P. De Melo et al. Surprising patterns for the call duration distribution of mobile phone users. ECML PKDD 2010.