HAL Id: hal-03167402
https://hal.archives-ouvertes.fr/hal-03167402
Submitted on 12 Mar 2021
HAL is a multi-disciplinary open access
archive for the deposit and dissemination of
sci-entific research documents, whether they are
pub-lished or not. The documents may come from
teaching and research institutions in France or
abroad, or from public or private research centers.
L’archive ouverte pluridisciplinaire HAL, est
destinée au dépôt et à la diffusion de documents
scientifiques de niveau recherche, publiés ou non,
émanant des établissements d’enseignement et de
recherche français ou étrangers, des laboratoires
publics ou privés.
Distributed under a Creative Commons Attribution| 4.0 International License
functional status amongst Mexican community-dwelling
older adults
O. Y. Bello-Chavolla, C. A. Aguilar-Salinas, Jose Alberto Avila-Funes
To cite this version:
O. Y. Bello-Chavolla, C. A. Aguilar-Salinas, Jose Alberto Avila-Funes. The type 2 diabetes-specific
dementia risk score (DSDRS) is associated with frailty, cognitive and functional status amongst
Mexican community-dwelling older adults. BMC Geriatrics, BioMed Central, 2020, 20 (1), pp.363.
�10.1186/s12877-020-01776-5�. �hal-03167402�
R E S E A R C H A R T I C L E
Open Access
The type 2 diabetes-specific dementia risk
score (DSDRS) is associated with frailty,
cognitive and functional status amongst
Mexican community-dwelling older adults
Omar Yaxmehen Bello-Chavolla
1,2,3*, Carlos Alberto Aguilar-Salinas
2,4,5and José Alberto Avila-Funes
6,7Abstract
Background: The type 2 diabetes (T2D) specific dementia-risk score (DSDRS) was developed to evaluate dementia risk in older adults with T2D. T2D-related factors have been shown increase the risk of age-related conditions, which might also increase dementia risk. Here, we investigate the associations of DSDRS with frailty, disability, quality of life (QoL) and cognition in community-dwelling older adults with T2D.
Methods: We included 257 community-dwelling older adults with T2D to evaluate the association between DSDRS and Mini-mental state examination (MMSE), Isaac’s set-test (IST), clock drawing test (CDT), quality of life (SF-36), risk of malnutrition (Mini-Nutritional Assessment or MNA), as well as frailty, Katz’ and Lawton-Brody scores. We also assessed the phenotype and correlates of high-estimated dementia risk by assessing individuals with DSDRS >75th age-specific percentiles.
Results: Mean age of participants was 78.0 ± 6.2 years. DSDRS showed a significant correlation with MMSE test, IST, CDT, SF-36, MNA, Lawton-Brody and Katz scores, and an increasing number of frailty components. DSDRS was higher among frail, pre-frail, and subjects with limited ADL and IADL (p < 0.001). Participants with DSDRS >75th age-specific percentiles had lower education, MMSE, IST, SF-36, MNA, Katz, Lawton-Brody, and higher frailty scores. High-estimated 10-year dementia risk was associated with ADL and IADL disability, frailty and risk of malnutrition. When assessing individual components of DSDRS, T2D-related microvascular complications were associated to all outcome measures.
Conclusion: The DSDRS is associated with frailty, disability, malnutrition and lower cognitive performance. These findings support that T2D-related factors have significant burden on functional status, QoL, disability and dementia risk.
Keywords: Diabetes, Dementia, Frailty, Disability, DSDRS
© The Author(s). 2020 Open Access This article is licensed under a Creative Commons Attribution 4.0 International License, which permits use, sharing, adaptation, distribution and reproduction in any medium or format, as long as you give appropriate credit to the original author(s) and the source, provide a link to the Creative Commons licence, and indicate if changes were made. The images or other third party material in this article are included in the article's Creative Commons licence, unless indicated otherwise in a credit line to the material. If material is not included in the article's Creative Commons licence and your intended use is not permitted by statutory regulation or exceeds the permitted use, you will need to obtain permission directly from the copyright holder. To view a copy of this licence, visithttp://creativecommons.org/licenses/by/4.0/. The Creative Commons Public Domain Dedication waiver (http://creativecommons.org/publicdomain/zero/1.0/) applies to the data made available in this article, unless otherwise stated in a credit line to the data.
* Correspondence:oyaxbell@yahoo.com.mx
1Dirección de Investigación, Instituto Nacional de Geriatría, Mexico City,
Mexico
2Unidad de Investigación de Enfermedades Metabólicas, Instituto Nacional
de Ciencias Médicas y Nutrición Salvador Zubirán, Vasco de Quiroga 15. CP 14080, Tlalpan, Mexico City, Mexico
Full list of author information is available at the end of the article
Bello-Chavollaet al. BMC Geriatrics (2020) 20:363 https://doi.org/10.1186/s12877-020-01776-5
Background
Type 2 diabetes mellitus (T2D) is a main cause of morbidity and mortality in the Western World; the highest preva-lence of T2D cases occurs in individuals over 60 years in whom it contributes to premature mortality and disability [1]. Consistent epidemiological evidence has shown an increased risk of incident all-cause, vascular and Alzheimer’s disease dementia in individuals with T2D [2, 3]. Screening of dementia risk has gained interest recently, particularly upon identification of modifiable risk factors for dementia to design strat-egies aimed at delaying or preventing disease onset [4]. Risk stratification in individuals with T2D might be particularly useful, since dementia in individuals with T2D has an earlier onset, thus having significant impact on function and cognition in older adults [5].
Recently, the diabetes-specific dementia risk score (DSDRS) was developed to evaluate dementia risk in American older in-dividuals with T2D. DSDRS predicts of all-cause dementia by evaluating diabetes-specific risk factors including microvascu-lar complications, hyperglycemic and hypoglycemic crises and diabetic foot along with traditional risk factors for dementia such as age, schooling, cardiovascular disease, and depression [6]. Accumulated risk attributable to T2D-related factors has also been independently associated to age-related conditions including frailty, disability and cognitive impairment [7]. In addition,disability,frailtyandcognitiveimpairmentareassoci-ated to risk of malnutrition, late-life depression and functional impairment, leading to increase dependence and decreasing quality of life besides increasing dementia risk [8,9]. Therefore, the clinical utility of screening individuals using DSDRS might beapproachedwiththeaimofdesigningspecifictreatmentreg-imens to improve quality of life (QoL) and functional status in at-riskolderadults[10].Furthermore,sinceimpairedcognition and dementia have significant negative impacts on T2D self-care, closer attention might be given to individuals identified at higherbaselinerisk[11].
Despite the practicality of the score, the functional and cognitive phenotype identified by the score has not been described beyond clinical features related to T2D. We hypothesized that individuals with higher DSDRS would have functional and cognitive impair-ment, which are likely to also impact T2D self-care and QoL. Therefore, the main objective of the present study was to determine the associations of the DSDR S with frailty, disability, and cognitive measures aim-ing to identify the cross-sectional phenotype which relates it to conditions linked to high-dementia risk in subjects with T2D.
Methods
Study population
We performed a cross-sectional study of 257 older adults aged ≥70 years who participated in the Coyoacán
Cohort, an observational study conducted in the Coyoa-cán borough located in Southern Mexico City conducted between 2008 and 2009. Complete methodological de-tails for the design and protocols of this study have been published elsewhere, and questionnaire materials were similar for the full cohort [7, 12]. Briefly, recruited participants were non-institutionalized older adults with residence in Coyoacán who were registered at the comprehensive “Food Support, Medical Care and Free Drugs Program” (FMDP) government program. All participants underwent face-to-face interviews to collect self-reported socio-demographic and health data and a comprehensive geriatric assessment which included physical performance tests, cognitive, nutri-tional, and medical assessment. Baseline questionnaire data were collected between April–May 2008; clinical evaluation and biological sample collection were car-ried out between June 2008 and July 2009. In the ori-ginal cohort, a sample of 1294 participants was calculated to ensure a sample size which could esti-mate a prevalence of ~ 14% of frailty with α = 0.05 and β = 0.20. Among contacted potential participants, acceptance rate was 86.9% and a total of 1124 partici-pants completed the initial interview, which included individuals with and without T2D. For the present study, we included participants with T2D without previous clinical diagnosis of dementia, defined as report of previously diagnosed T2D and/or self-report of taking T2D medications (n = 236). To ac-count for subjects who were not previously diagnosed with T2D, we included subjects with fasting glucose ≥126 mg/dL (n = 21), who had enough information for their dementia-risk stratification using the DSDRS (overall, n = 257).
Definitions for potential correlates with DSDRS Frailty
We used a modified definition of the one proposed by Fried et al. which was previously validated for this popu-lation [13, 14]. This modified definition uses data from questionnaires and self-report to define the following dominions, previously described as: a) Unintentional weight loss≥5 kg in the last 12 months, b) Exhaustion, c) Low physical activity, d) Slowness, and e) Weakness. Participants were categorized as frail if they fulfilled ≥3 criteria, pre-frail if they fulfilled 1–2 criteria, and non-frail if none.
Depressive symptoms
The presence of depressive symptoms was defined as a score > 5 in the 15-item version of the Geriatric Depres-sion Scale (GDS).
Cognitive performance
Cognitive evaluation comprised an interview-based as-sessment, which included a questionnaire-based
cogni-tive evaluation comprising Mini-Mental State
Examination (MMSE) evaluation, verbal fluency abilities with the Isaacs Set Test (IST) where four semantic cat-egories were successively used (cities, fruits, animals, and colors) and the Clock-drawing test to assess visuo-constructional abilities. Low cognitive performance was based on a modified definition by Blaum et al., defined as scores <25th percentile in both MMSE and the IST semantic verbal fluency test or clock-drawing test, ad-justed for sex, age, and schooling based on normative cutoffs previously validated in the Coyoacán Cohort Study to account for inter-ethnic influences on MMSE scores which impact on the sentitivity of the test to de-tect cognitive impairment [12,15].
Disability
Determined using Lawton-Brody Instrumental Activities of Daily Living (IADL) scale and Katz Index for the Ac-tivities of Daily Living (ADL). We defined ADL or IADL disability as having at least one impaired dominion in the Katz scale (ADL disability) or the Lawton-Brody scale (IADL disability) [16–18].
Risk of malnutrition
Assessed by the Mini-Nutritional Assessment (MNA) questionnaire, scores < 24 were indicative of at-risk of malnutrition.
QoL
Assessed using the self-administered generic instrument SF-36 health questionnaire in the translated and vali-dated version for Mexican population. Items are formu-lated as statements to evaluate eight specific health scales including physical functioning, physical pain, role limitations due to physical health problems, role limita-tions due to personal or emotional problems, emotional well-being, social functioning, energy/fatigue and general health perceptions. Scales were classified in two physical (PCS) and mental component scores (MCS).
Dementia risk calculation
We evaluated dementia risk using the DSDRS [6]. Self-reported variables included in the score considered dur-ation of T2D from diagnosis in years, self-report of dia-betic kidney disease (DKD) and diadia-betic retinopathy, history of insulin use or oral T2D treatment, previous diagnosis of diabetic foot or peripheral vascular disease, acute myocardial infarction, and stroke. Microvascular complications to estimate DSDRS considered the clus-tering of DKD, and/or diabetic retinopathy; this defin-ition was also used in linear and logistic regression
models. Acute metabolic event was defined as a previous episode of hyperglycemia which required hospitalization or hypoglycemia, defined by self-reported episodes of hyperglycemia or fasting glucose levels < 70 mg/dL as recommended by ADA guidelines. High dementia-risk was defined as an estimated 10-year dementia risk >75th age-specific percentile based on incremental 5-year age categories described by the DSDRS. The selection of this age-specific percentile cut-off was performed to provide fair comparisons of DSDRS to detect age-related pheno-types without a significant influence from age as consid-ered in the DSDRS, whilst still allowing a detection of high-risk individuals within each age group.
Anthropometric and biochemical evaluation
We calculated the body mass index using anthropomet-ric evaluation using the formula of weight in kilograms divided by height in m2. Blood samples were acquired after a 10–12 h fast to measure fasting glucose (Yellow Springs Instruments Co.); serum lipid concentrations assessed total cholesterol, triglycerides and HDL-C and were measured using colorimetric assays (Unicel DxC 600 Synchron Clinical System Beckman Coulter).
Statistical analysis Intergroup differences
We compared groups according to the 75th age-adjusted percentile of DSDRS using Student’s t-test or Mann-Whitney U according to variable distribution. In all de-scriptive analyses, distribution of categorical variables is reported as frequencies which were compared between groups using chi-squared tests. A p-value < 0.05 was established as statistically significant.
Correlation between DSDRS, cognitive tests, frailty, and disability components
To investigate the association between dementia risk and the evaluated scores, we tested the correlation of DSDRS with the continuous MMSE, the IST, CDT, MNA, SF-36, Lawton, and Katz scores as well as the number of frailty components using Spearman’s correl-ation; 95% confidence intervals were estimated using 1000 bootstrap samples. To develop an explanatory model for DSDRS and identify independent predictors for dementia risk using these scores, we used step-wise multiple linear regression analyses adjusted for sex, years of schooling and years since diabetes diagnosis, with model selection carried out using Bayesian Information Criterion (BIC) minimization.
Logistic regression analyses
We developed an explanatory model for high-estimated 10-year dementia-risk to investigate the relation of sub-jects at higher risk with the investigated clinical
phenotypes identified by the scores when transformed into categorical variables. For this purpose, we used lo-gistic regression, treating high-dementia risk as the dependent variable and including as predictors frailty, ADL and IADL disability, risk of malnutrition and low cognitive performance; multiple logistic regression was carried out using step-wise models adjusted for years since diabetes diagnosis, years of schooling and sex. Model diagnostics were conducted using R2 and the Hosmer-Lemeshow test. Finally, we constructed ROC curves to estimate performance of DSDRS to identify phenotypes of frailty, low cognitive performance, ADL and IADL disability using probability estimates from re-gression modes; we also calculated sensitivity and speci-ficity for each phenotype.
Contribution of DSDRS components to the observed associations
To investigate whether the association of DSDRS with cognition, disability, frailty and impaired QoL were driven by factors other than age, we fitted multiple linear regression models to evaluate which components of the DSDRS were primarily associated with the outcomes. Predictors included individual components of the DSDR S, including age, microvascular complications, depres-sion, diabetic foot, acute metabolic events, cardiovascu-lar and cerebrovascular disease. We included as dependent variables scores correlated to DSDRS, which included the frailty score, Lawton, Katz, MMSE, MNA and SF-36 PCS. Model diagnostics were conducted using R2 and BIC; multicollinearity was assessed using toler-ance and varitoler-ance inflation factor (VIF). Predictors were tested on homoscedasticity and linearity assumptions; model diagnostics were conducted evaluating normality of residuals. Model parameters are expressed using β-coefficients and 95%CI. All statistical analyses were per-formed using the SPSS software (Version 22.0), R (Ver-sion 3.6.1) and GraphPad Prism (Ver(Ver-sion 6.0).
Results
Study subjects
We included 257 subjects with T2D, with a slight female predominance (54.1%), an average age of 78.0 ± 6.2 years and a median of 10 years since T2D diagnosis. Insulin use was observed in 58 subjects (22.6%), 89 subjects had fasting glucose ≤130 mg/dL (34.6%), 89 subjects were categorized as pre-frail (34.6%) and 32 subjects as frail (12.5%). In relation to microvascular complications, 62 subjects referred having a previous diagnosis of diabetic kidney disease (DKD) and 102 referred diabetic retinop-athy (39.7%). Furthermore, 88 subjects (34.2%) referred having any degree of diabetic foot disease; acute meta-bolic events occurred in 19 subjects (7.4%) of whom 7 were categorized ad hypoglycemic events (2.7%) and 12
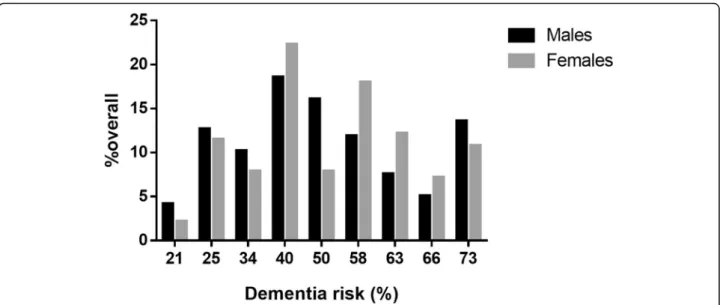
as hyperglycemic events requiring hospitalization (4.7%, Table1). The median of the DSDRS was 8.0 (range 6.0–
10.0), which corresponds to an estimated 10-year de-mentia risk of 50% (40.0–63.0%), which was unevenly distributed by sex, without significant differences in sex distribution across dementia risk categories (p = 0.327, Fig.1). When assessing sex-specific differences in DSDR S components, we identified that female participants had less years of education (6.0 [2.0–11.0], P = 0.003) and higher but non-significant rates of microvascular com-plications (55.4% vs 43.2%, P = 0.051) and of diabetic foot (39.6% vs. 28.0%, p = 0.051) compared to men but significantly lower rates of acute metabolic events (3.6 vs. 11.9%,p = 0.012).
DSDRS, cognition, frailty, QoL and functional scores
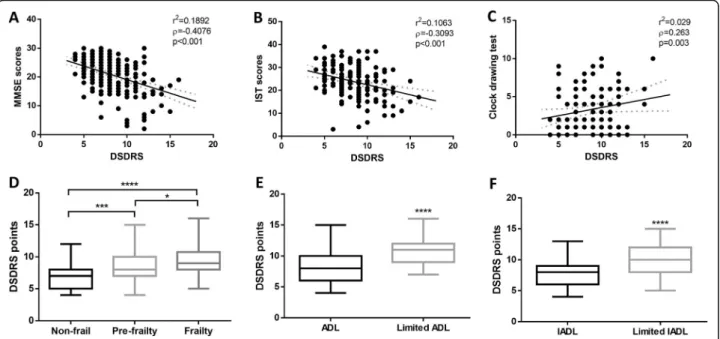
We observed negative adjusted and unadjusted linear as-sociations between DSDRS and MMSE, IST, SF-36 PCS, SF-36 MCS and MNA. We also observed a positive and significant linear associations between DSDRS and CDT, Katz, Lawton and the frailty score (Table2). We did not observe a significant correlation between DSDRS, fasting glucose, triglycerides, HDL-C, total cholesterol or BMI. Using step-wise linear regression analyses we identified that frailty (β = 0.400, 95%CI 0.080–0.719), MMSE (β = − 0.153 95%CI -0.255 - -0.050) and MNA scores (β = − 0.160 95%CI -0.283 - -0.037) explained 26.8% of the vari-ability in DSDRS, adjusted for sex, years of schooling and years since T2D diagnosis (R2= 0.268, p < 0.001). Furthermore, we observed significantly higher DSDRS among frail participants compared with non-frail sub-jects and in subsub-jects with disability (Fig.2).
DRDS, decreased cognitive performance, frailty, and disability
Subjects with high 10-year dementia risk had less years of education, lower MNA, SF-36 PCS, SF-36 MCS, MMSE, IST, Katz and Lawton-Brody scores, higher frailty and GDS scores, and years of T2D exposure in comparison to DSDRS <75th age-specific percentile (Table 1). As expected, subjects with high 10-year de-mentia risk were also more likely to be frail, at risk of malnutrition (50.0% vs. 20.0%, p < 0.001), with disability (ADL 29.8% vs. 12.4%, p = 0.002; IADL 22.0% vs. 7.1%, p = 0.001) and a trend towards low cognitive perform-ance (20.0% vs. 8.8%, p = 0.057). When evaluating the role of the DSDRS score to identify frailty and disability we observed highest area under the curve (AUC) for de-tection of ADL disability (AUC 0.803 95%CI 0.715– 0.892; sensitivity 85.7%, specificity 61.3%), IADL disabil-ity (AUC 0.733 95%CI 0.629–0.838; sensitivdisabil-ity 62.0%, specificity 75.7%), low cognitive performance (AUC 0.704 95%CI 0.582–0.826; sensitivity 83.3%, specificity 54.3%), and frailty (AUC 0.700 95%CI 0.601–0.799;
sensitivity 71.9%, specificity 69.1%). Using logistic regres-sion, high-estimated 10-year dementia risk was associ-ated to ADL and IADL disability, frailty and risk of malnutrition, adjusted for sex, years of schooling and years since T2D diagnosis. In multivariable logistic re-gression analyses, frailty and risk of malnutrition were associated with high-estimated 10-year dementia risk, adjusted for sex, years of schooling and years since T2D diagnosis (R2= 0.294,χ2=8.682,p = 0.370, Table3).
Specific DSDRS components and outcomes
In the case of the frailty score, age, microvascular com-plications, diabetic foot, stroke and depression explain the observed associations. Older age, microvascular complications and cardiovascular disease were associated with Lawton scores whilst older age, microvascular com-plications and were associated with lower Katz scores. For MMSE we observed significant associations with
age, schooling, depression and microvascular
Table 1 General characteristics of subjects included in the study, as well as a comparison between individuals with DSDRS above and below the 75th age-specific percentile, defined as high 10-year dementia risk. Results are presented as either mean ± SD or Median (IQR), according to variable distributions. *p < 0.05
Parameter Overall sample (N = 257)
Mean ± SD/Median (IQR)
DSDRS≤ 75th percentile (N = 198) Mean ± SD or Median (IQR)
DSDRS > 75th percentile (N = 59) Mean ± SD or Median (IQR)
Female sex (%) 139 (54.1) 110 (55.6) 29 (49.2) Age (years) 78.05 ± 6.16 77.83 ± 6.14 78.79 ± 6.22 Years since T2D diagnosis 10.0 (3.0–20.0) 7.5 (2.0–19.0) 17.0 (10.0–23.0)* Age at T2D diagnosis 64.93 ± 12.56 66.12 ± 12.30 61.01 ± 12.71* Schooling (years) 6.0 (1.0–9.0) 6.0 (2.0–9.0) 3.0 (0.0–6.0)* Glucose (mg/dL) 143.86 ± 60.23 139.13 ± 44.58 158.89 ± 93.22 Triglycerides (mg/dL) 185.36 ± 97.09 181.33 ± 97.55 198.15 ± 95.55 HDL-C (mg/dL) 42.05 ± 12.64 42.08 ± 12.97 41.98 ± 11.64 Total Cholesterol (mg/dL) 194.52 ± 42.01 195.12 ± 42.59 192.61 ± 40.50 BMI (kg/m2) 26.99 ± 4.02 27.01 ± 3.95 26.92 ± 4.28 MMSE score 20.83 ± 5.45 21.81 ± 4.88 17.46 ± 5.99*
Isaac’s set test score 23.78 ± 6.87 24.75 ± 6.41 21.58 ± 7.43*
Clock Drawing Test 2.0 (1.0–5.0) 6.0 (2.0–9.0) 7.5 (2.0–19.0)
Geriatric depression scale 2.0 (1.0–4.0) 2.0 (1.0–3.0) 5.0 (3.5–7.0)* Katz scale 5.21 ± 1.41 5.44 ± 1.16 4.42 ± 1.83* Lawton scale 5.30 ± 1.28 5.44 ± 1.11 4.83 ± 1.66* Mini-Nutritional Assessment 24.92 ± 3.29 25.67 ± 2.59 22.53 ± 4.12* SF-36 PCS 43.53 ± 9.67 44.35 ± 9.71 39.87 ± 8.68* SF-36 MCS 52.64 ± 9.59 53.66 ± 8.94 48.07 ± 11.10* Frailty (%) 32 (15.0) 20 (11.5) 12 (30.8)* Insulin use (%) 58 (22.6) 46 (23.2) 12 (20.3) Stroke (%) 20 (7.8) 4 (2.0) 16 (27.1)* Myocardial infarction (%) 27 (10.5) 14 (7.1) 13 (22.0)* Acute metabolic events (%) 19 (7.4) 7 (3.5) 12 (20.3)* Microvascular complications (%) 128 (49.8) 73 (36.9) 55 (93.2)* Diabetic foot (%) 88 (34.2) 52 (26.3) 36 (61.0)* DSDRS 8.0 (6.0–10.0) 7.0 (6.0–9.0) 11.0 (9.00–12.0)*
Abbreviations: T2D Type 2 diabetes, DSDRS Diabetes-specific dementia risk score, HDL-C High-density lipoprotein cholesterol, BMI Body-mass index, MMSE Mini-mental state examination,ADL Activities of daily life, IADL Instrumented activities of daily life
complications, whilst for MNA scores, we observed asso-ciations with diabetic foot disease, cardiovascular dis-ease, stroke and depression. Finally, lower SF-36 PC scores were associated with microvascular disease, car-diovascular disease and depression (Supplementary Material).
Discussion
Here, we demonstrate that the DSDRS is associated with measures of cognitive performance, frailty, risk of
mal-nutrition, QoL, and ADL/IADL disability among
community-dwelling older adults with T2D. Further-more, we observed higher DSDRS in pre-frail and frail participants and among those with disability. Relying on these associations, the identified cross-sectional pheno-type observed using the DSDRS is consistent with what
would be expected for patients at higher risk of demen-tia, regardless of T2D status. Subjects at higher risk of dementia identified by the DSDRS would most likely be frail, have some degree of disability, decreased cognitive performance, risk of malnutrition and lower QoL. These findings strengthen the notion that T2D and T2D-related complications have significant burden on func-tional status, QoL, disability and, subsequently, on de-mentia risk.
Frailty and dementia risk by DSDRS
Older adults with T2D are at an increased risk of frailty;
furthermore, interactions between frailty and
hypoglycemia during T2D treatment have been reported to increase dementia-risk. This is significant, since
pa-tients with increasing number of macro and
Fig. 1 Frequency distribution of estimated 10-year dementia risk amongst Mexican community-dwelling elderly with type 2 diabetes mellitus, stratified by sex. Despite the uneven distribution, we observed no significant differences in sex across dementia risk scores
Table 2 Partial correlation analyses and multiple linear regression of DSDRS with evaluated scores in the sample, adjusted for sex, years of schooling and years since diabetes diagnosis
Parameter Unadjusted correlation (95%CI) Adjusted correlation (95%CI) Multiple Linear R2
MMSE score −0.412 (−0.511 - -0.293) −0.359 (−0.445 - -0.277) 0.329
IST score −0.319 (− 0.470 - -0.161) − 0.250 (− 0.421 - -0.111) 0.158
Clock Drawing Test 0.285 (0.114–0.454) 0.257 (0.077–0.434) 0.170
SF-36 PCS −0.363 (− 0.482 - -0.254) −0.233 (− 0.361 - -0.117) 0.146 SF-36 MCS −0.176 (− 0.323 - -0.036) −0.183 (− 0.319 - -0.082) 0.067 Mini-nutritional assessment −0.354 (− 0.492 - -0.194) −0.326 (− 0.457 - -0.168) 0.240 Katz score −0.340 (− 0.446 - -0.226) −0.269 (− 0.370 - -0.167) 0.152 Lawton score −0.217 (− 0.342 - -0.078) −0.314 (− 0.430 - -0.173) 0.136 Frailty components 0.399 (0.282–0.509) 0.263 (0.077–0.428) 0.191
Abbreviations: DSDRS Diabetes-specific dementia risk score, MMSE Mini-mental state examination, IST Isaac’s Set Test, MNA Mini-nutritional assessment, SF-36 MCS Mental Component Score of the SF-36 quality of life questionnaire,SF-36 PCS Physical Component Score of the SF-36 quality of life questionnaire
microvascular complications might be assessed as re-quiring more intensive glycemic control which, in sub-jects with impaired functional status and frailty might increase dementia risk [19]. The role of frailty in increas-ing morbidity and impactincreas-ing QoL in patients with T2D has previously been shown and has led to recommenda-tions against intensive glycemic control in this popula-tion [20, 21]; in addition, frailty is related to vascular damage and might contribute to increased risk of vascu-lar dementia in T2D [22]. DSDRS might prove useful to identify patients with impaired functional status, mul-tiple comorbidities, and frailty, who might benefit from less intensive T2D treatment and might require treat-ment adjusttreat-ments [21]. In our study, we did not assess hypoglycemic episodes or hypoglycemia risk, but the interaction between frailty and hypoglycemia in relation
to DSDRS and its impact on dementia risk should be evaluated in future studies.
Microvascular complications and dementia risk by DSDRS
Microvascular complications, particularly diabetic retin-opathy, are evaluated by DSDRS to discriminate subjects with increased dementia risk who might also have dis-ability, impaired QoL and functional status [23]. Diabetic retinopathy and neuropathy cause severe sensory impair-ments in older patients with T2D; furthermore, T2D has been associated to increased risk of bilateral sensori-neural hearing loss in addition to established micro-vascular damage, which might contribute to further sensory loss [24, 25]. Sensory impairments, particularly in eyesight, hearing, and neuropathy have been associ-ated with increased dementia risk and favor the
Fig. 2 Correlation between increasing DSDRS and MMSE a, IST b and Clock test scores c. We also show comparisons of DSDRS according to frailty categories d, and functional status regarding activities of daily life e and instrumented activities of daily life f, demonstrating the role of DSDRS to discriminate functional and cognitive status. *p < 0.05, **p < 0.01, ***p < 0.001, ****p < 0.0001. Abbreviations: DSDRS, Diabetes-specific dementia risk score; MMSE, Mini-mental state examination; IST, Isaac’s set-test; ADL, Activities of daily life; IADL, Instrumented activities of daily life
Table 3 Simple and multiple logistic regression analyses of the association of evaluated scores and phenotypes with high-estimated dementia risk, defined as DSDRS >75th age-specific percentiles. Analyses were adjusted for sex, years of schooling and years since diabetes diagnosis
Model diagnostics Parameter OR (95%CI) p-value
Simple R2= 0.108;χ2=9.418,p = 0.308 IADL disability 2.92 (1.25–6.85) 0.014
R2= 0.214;χ2=3.113,p = 0.927 ADL disability 2.52 (1.15–5.51) 0.021
R2= 0.063;χ2=22.772,p = 0.004 Low cognitive performance 2.61 (0.94–7.20)) 0.064
R2= 0.240;χ2=4.254,p = 0.834 Frailty 3.91 (1.51–10.12) 0.005
R2= 0.249;χ2=7.161,p = 0.519 Risk of malnutrition 3.35 (1.39–8.09) 0.007
Multiple R2= 0.294;χ2=8.682, p = 0.370 Frailty 4.31 (1.34–13.94) 0.049
Risk of malnutrition 2.56 (1.01–6.54) 0.015
Abbreviations: DSDRS Diabetes-specific dementia risk score, MMSE Mini-mental state examination, ADL Activities of daily life, IADL impaired activities of daily life
development of disability and increased mortality; in addition, end-organ microvascular damage in T2D in-creases risk of falls and impairment of functional status [26,27]. The role of microvascular damage in the patho-physiology of dementia in diabetes has also been studied, but the evidence of this association is inconsistent and neurological changes have been observed in individuals with T2D without end-organ microvascular damage [28]. Thus, DSDRS might identify individuals at high risk of disability in IADL and ADL due in part to sensory im-pairment by recognizing a population with increased de-mentia risk in whom rehabilitation would be beneficial [29]. The role of depression, macro and microvascular factors and obesity in promoting disability in individuals with T2D has also been reported, and its evaluation by the score contributes to the identification of individuals with ADL and IADL disability [30].
Cognition, microvascular complications and DSDRS
Older adults with T2D present lower performance on cognitive evaluations, particularly when affected by mi-cro and mami-crovascular complications [31]. Cognitive evaluations of individuals with T2D have demonstrated impaired domains in information processing speed, visuospatial functions, attention, executive functioning abstract reasoning [32]; furthermore, individuals with T2D present a higher rate of cognitive decline, directly dependent with glycemic control. Individuals with T2D and cognitive impairment also experience a higher rate of conversion to dementia, with earlier disease onset and increased disease progression in relation to T2D dur-ation and microvascular complicdur-ations, as has been shown in previous studies [33, 34]. The lower cognitive performance observed in individuals with increased DSDRS in our study might be attributable to the consid-eration of microvascular damage, age and glycemic con-trol, which underlie associations with impaired cognition in T2D in most prospective studies. Furthermore, the impact of frailty and disability on cognition, both of which increase dementia risk, must also be considered [35, 36]. Since individuals with T2D are a population with high susceptibility to impaired cognition, our dem-onstration of lower cognitive performance when screen-ing subjects usscreen-ing the DSDRS provides evidence for its utility in a cross-sectional setting. Future longitudinal studies should shed light on the role of DSDRS for pre-diction of cognitive impairment conversion to dementia in individuals with T2D.
Strengths and limitations
Our study had some strengths and limitations. First, we performed a wide range of evaluations, which allowed a thorough assessment of cognition, QoL, disability, and frailty in a sample of community-dwelling individuals
with T2D in which most of these predictors had previ-ously been validated. We also demonstrated that the DSDRS identifies subjects who could be considered for short-term interventions to improve function and ameli-orate the negative effects of disability, frailty and T2D related complications. Furthermore, this is the first study in which DSDRS is used besides its original evaluation, demonstrating its utility in different populations and set-tings. Validation of DSDRS for functional and frailty sta-tus as demonstrated in this study allows to characterize the phenotype observed for subjects with high-estimated dementia risk score and extend the applications of DSDRS; nevertheless, prospective validation studies are required to both externally validate the score in different populations and replicate the observed associations for DSDRS in this study.
Amongst the limitations to be acknowledged is its cross-sectional setting, which limits the ability to es-tablish causal relationships and the self-report of co-morbidities and T2D complications, which might underestimate the true impact of the associations. The modified frailty definition which uses self-reported measures instead of physical evaluations has previously been applied in other studies involving the Coyoacán Cohort study; furthermore, epidemio-logical studies in other settings with self-reported data have been conducted and yielded reproducible results [17, 37]. Recent studies have compared the performance of frailty definitions which substitute physical based for self-reported based measures, identifying adequate diagnostic performance for self-reported definitions and adequate concordance with physical based definitions [38, 39]. Given this evi-dence, we propose that this operational definition should adequately capture the variability of the frailty phenotype in our subjects. Since the evaluated sample was representative of the community and previous reports have shown an increased rate of un-diagnosed T2D in our population [1], some cases of T2D with fasting glucose < 126 mg/dL could have been excluded, thus limiting information of such cases. In addition, since no specific dementia infor-mation was available for diagnosis in the Coyoacán Cohort study there exists a possibility for undiag-nosed cases of dementia not identified by cognitive assessment, thus modifying the strength of these as-sociations. Our results however are in accordance with recent findings which show that DSDRS might be useful to detect cognitive impairment in indivu-dals with T2D [40]. Moreover, cognitive assessment did not include more extensive measures of execu-tive function, which are highly sensiexecu-tive to T2D-related cognitive changes and remain to be explored in future studies.
Conclusions
The DSDRS is associated with frailty, disability, risk of malnutrition, lower cognitive performance and impaired quality of life. Evaluation of this score in primary care fa-cilities might prove useful for identification of subjects with T2D who might benefit from multidisciplinary in-terventions focusing on rehabilitation to improve upon IADL and ADL disability, frequent cognitive screening, nutritional counseling and evaluation of interventions to reduce burden related to frailty. The role of said inter-ventions to delay onset of cognitive decline and demen-tia in high risk patients identified using the DSDRS should be evaluated in future studies.
Supplementary information
Supplementary information accompanies this paper athttps://doi.org/10. 1186/s12877-020-01776-5.
Additional file 1. Supplementary Material. Regression models for individual components of DSDRS and its prediction of age-related pheno-types. This section includes an additional table which summarizes regres-sion models for prediction of age-related phenotypes.
Abbreviations
T2D:Type 2 diabetes; DSDRS: Diabetes-specific dementia risk score; HDL-C: High-density lipoprotein cholesterol; BMI: Body-mass index; MMSE: Mini-mental state examination; ADL: Activities of daily life; IADL: Instrumented activities of daily life; MMSE: Mini-mental state examination; IST: Isaac’s Set Test; MNA: Mini-nutritional assessment; SF-36 MCS: Mental Component Score of the SF-36 quality of life questionnaire; SF-36 PCS: Physical Component Score of the SF-36 quality of life questionnaire
Acknowledgements
This research was conducted as part of the Mexican Study of Nutritional and Psychosocial Markers of Frailty among Community-Dwelling Elderly.
Authors’ contributions
OYBC developed conceptualization and design of this study; contributed to interpretation of data, statistical analyses and manuscript drafting. He is the guarantor of the work, had full access to all the data in the study and takes responsibility for the integrity of the data and the accuracy of the data analysis. CAAS developed conceptualization and design of this study, contributed to interpretation of data and drafting and revision of the manuscript. JAAF developed conceptualization and design of this study; contributed to interpretation of data and drafting and revision of the manuscript. All listed authors have read and approved the final version of the manuscript.
Funding
This project was supported by a grant from Secretaría de Educación, Ciencia, Tecnología e Innovación de la Ciudad de México CM-SECTEI/041/2020“Red Colaborativa de Investigación Traslacional para el Envejecimiento Saludable de la Ciudad de México (RECITES)”. The funding body had no role the design of the study or in the collection, analysis, and interpretation of data nor in the process of writing the present manuscript.
Availability of data and materials
The datasets used and/or analysed during the current study are available from the corresponding author on reasonable request.
Ethics approval and consent to participate
The local Human Research Ethics Committee of the Instituto Nacional de Ciencias Médicas y Nutrición Salvador Zubirán approved all proceedings regarding this study and all participants provided written consent. In case that a participant was determined to be unable to provide consent given
their cognitive status, a guardian was authorized to provide consent on their behalf.
Consent for publication Not applicable.
Competing interests Nothing to disclose.
Author details
1Dirección de Investigación, Instituto Nacional de Geriatría, Mexico City,
Mexico.2Unidad de Investigación de Enfermedades Metabólicas, Instituto
Nacional de Ciencias Médicas y Nutrición Salvador Zubirán, Vasco de Quiroga 15. CP 14080, Tlalpan, Mexico City, Mexico.3Department of Physiology, Facultad de Medicina, Universidad Nacional Autónoma de Mexico, Mexico City, Mexico.4Departamento de Endocrinología y
Metabolismo, Instituto Nacional de Ciencias Médicas y Nutrición Salvador Zubirán, Mexico City, Mexico.5Instituto Tecnologico y de Estudios Superiores de Monterrey Tec Salud, Nuevo León, Mexico.6Geriatrics Department,
Instituto Nacional de Ciencias Médicas y Nutrición Salvador Zubirán, Mexico City, Mexico.7Centre de recherche INSERM, U1219, F-33076 Bordeaux, France. Received: 10 June 2020 Accepted: 16 September 2020
References
1. Bello-Chavolla OY, Rojas-Martinez R, Aguilar-Salinas CA, Hernández-Avila M. Epidemiology of diabetes mellitus in Mexico. Nutr Rev. 2017;75(suppl 1):4–12.
2. Chatterjee S, Peters SAE, Woodward M, Mejia Arango S, Batty GD, Beckett N, et al. Type 2 diabetes as a risk factor for dementia in women compared with men: a pooled analysis of 2.3 million people comprising more than 100,000 cases of dementia. Diabetes Care. 2016;39(2):300–7.
3. Bello-Chavolla OY, Antonio-Villa NE, Vargas-Vázquez A, Ávila-Funes JA, Aguilar-Salinas CA. Pathophysiological mechanisms linking type 2 diabetes and dementia: review of evidence from clinical, translational and epidemiological research. Curr Diabetes Rev. 2019;15(6):456–70. 4. Carrillo MC, Brashear HR, Logovinsky V, Ryan JM, Feldman HH, Siemers ER,
et al. Can we prevent Alzheimer’s disease? Secondary “prevention” trials in Alzheimer’s disease. Alzheimers Dement. 2013;9(2):123–31 e1.
5. Biessels GJ, Strachan MWJ, Visseren FLJ, Kappelle LJ, Whitmer RA. Dementia and cognitive decline in type 2 diabetes and prediabetic stages: towards targeted interventions. Lancet Diabetes Endocrinol. 2014;2(3):246–55. 6. Exalto LG, Biessels GJ, Karter AJ, Huang ES, Katon WJ, Minkoff JR, et al. Risk
score for prediction of 10 year dementia risk in individuals with type 2 diabetes: a cohort study. Lancet Diabetes Endocrinol. 2013;1(3):183–90. 7. Bello-Chavolla OY, Aguilar-Salinas CA, Avila-Funes JA. Geriatric syndromes
and not cardiovascular risk factors are associated with cognitive impairment among Mexican community-dwelling elderly with type 2 diabetes. Rev Investig Clin. 2017;69(3):166–72.
8. Johansson L, Guerra M, Prince M, Hörder H, Falk H, Stubbs B, et al. Associations between depression, depressive symptoms, and incidence of dementia in Latin America: a 10/66 dementia research group study. J Alzheimers Dis. 2019;69(2):433–41.
9. Bell SP, Liu D, Samuels LR, Shah AS, Gifford KA, Hohman TJ, et al. Late-life body mass index, rapid weight loss, Apolipoprotein Eε4 and the risk of cognitive decline and incident dementia. J Nutr Health Aging. 2017;21(10): 1259–67.
10. Shih I-F, Paul K, Haan M, Yu Y, Ritz B. Physical activity modifies the influence of apolipoprotein Eε4 allele and type 2 diabetes on dementia and cognitive impairment among older Mexican Americans. Alzheimers Dement. 2018;14(1):1–9.
11. Hewitt J, Smeeth L, Chaturvedi N, Bulpitt CJ, Fletcher AE. Self management and patient understanding of diabetes in the older person. Diabet Med. 2011 Jan;28(1):117–22.
12. Mokri H, Avila-Funes JA, Meillon C, Gutiérrez Robledo LM, Amieva H. Normative data for the mini-mental state examination, the free and cued selective reminding test and the Isaacs set test for an older adult Mexican population: the Coyoacán cohort study. Clin Neuropsychol. 2013;27(6):1004–18.
13. Fried LP, Tangen CM, Walston J, Newman AB, Hirsch C, Gottdiener J, et al. Frailty in older adults: evidence for a phenotype. J Gerontol A Biol Sci Med Sci. 2001 Mar;56(3):M146–56.
14. Ávila-Funes JA, Pina-Escudero SD, Aguilar-Navarro S, Gutierrez-Robledo LM, Ruiz-Arregui L, Amieva H. Cognitive impairment and low physical activity are the components of frailty more strongly associated with disability. J Nutr Health Aging. 2011;15(8):683–9.
15. Blaum CS, Ofstedal MB, Liang J. Low cognitive performance, comorbid disease, and task-specific disability: findings from a nationally representative survey. J Gerontol A Biol Sci Med Sci. 2002;57(8):M523–31.
16. Carmona-Torres JM, Rodríguez-Borrego MA, Laredo-Aguilera JA, López-Soto PJ, Santacruz-Salas E, Cobo-Cuenca AI. Disability for basic and instrumental activities of daily living in older individuals. PLoS One. 2019;14(7):e0220157. 17. Santos-Eggimann B, Cuénoud P, Spagnoli J, Junod J. Prevalence of frailty in
middle-aged and older community-dwelling Europeans living in 10 countries. J Gerontol A Biol Sci Med Sci. 2009;64(6):675–81.
18. Mlinac ME, Feng MC. Assessment of activities of daily living, self-care, and Independence. Arch Clin Neuropsychol. 2016;31(6):506–16.
19. Abdelhafiz AH, McNicholas E, Sinclair AJ. Hypoglycemia, frailty and dementia in older people with diabetes: reciprocal relations and clinical implications. J Diabetes Complicat. 2016;30(8):1548–54.
20. Sheen Y-J, Sheu WHH. Association between hypoglycemia and dementia in patients with type 2 diabetes. Diabetes Res Clin Pract. 2016;116:279–87. 21. Schernthaner G, Schernthaner-Reiter MH. Diabetes in the older patient:
heterogeneity requires individualisation of therapeutic strategies. Diabetologia. 2018;61(7):1503–16.
22. Avila-Funes JA, Carcaillon L, Helmer C, Carrière I, Ritchie K, Rouaud O, et al. Is frailty a prodromal stage of vascular dementia? Results from the Three-City study. J Am Geriatr Soc. 2012;60(9):1708–12.
23. Chen LK, Hwang AC, Liu LK, Lee WJ, Peng LN. Frailty is a geriatric syndrome characterized by multiple impairments: a comprehensive approach is needed. J Frailty Aging. 2016;5(4):208–13.
24. Exalto LG, Biessels GJ, Karter AJ, Huang ES, Quesenberry CP, Whitmer RA. Severe diabetic retinal disease and dementia risk in type 2 diabetes. J Alzheimers Dis. 2014;42(Suppl 3):S109–17.
25. Corriere M, Rooparinesingh N, Kalyani RR. Epidemiology of diabetes and diabetes complications in the elderly: an emerging public health burden. Curr Diab Rep. 2013;13(6):805–13.
26. Luo Y, He P, Guo C, Chen G, Li N, Zheng X. Association between sensory impairment and dementia in older adults: evidence from China. J Am Geriatr Soc. 2018;66(3):480–6.
27. Li J, Zhang Y, Fu X, Bi J, Li Y, Liu B, et al. Alteration of auditory function in type 2 diabetic and pre-diabetic patients. Acta Otolaryngol. 2018;138(6):542–7. 28. Formiga F, Chivite D, Ruiz D, Navarro M, Perez Castejon JM, Duaso E, et al.
Clinical evidence of diabetes mellitus end-organ damage as risk factor for falls complicated by hip fracture: a multi-center study of 1225 patients. Diabetes Res Clin Pract. 2015;109(2):233–7.
29. Umemura T, Kawamura T, Hotta N. Pathogenesis and neuroimaging of cerebral large and small vessel disease in type 2 diabetes: a possible link between cerebral and retinal microvascular abnormalities. J Diabetes Investig. 2017;8(2):134–48.
30. Fauth EB, Schwartz S, Tschanz JT, Østbye T, Corcoran C, Norton MC. Baseline disability in activities of daily living predicts dementia risk even after controlling for baseline global cognitive ability and depressive symptoms. Int J Geriatr Psychiatry. 2013;28(6):597–606.
31. Tabesh M, Shaw JE, Zimmet PZ, Söderberg S, Koye DN, Kowlessur S, et al. Association between type 2 diabetes mellitus and disability: what is the contribution of diabetes risk factors and diabetes complications? J Diabetes. 2018;10(9):744–52.
32. Ruis C, Biessels GJ, Gorter KJ, van den Donk M, Kappelle LJ, Rutten GEHM. Cognition in the early stage of type 2 diabetes. Diabetes Care. 2009;32(7): 1261–5.
33. de Bresser J, Reijmer YD, van den Berg E, Breedijk MA, Kappelle LJ, Viergever MA, et al. Microvascular determinants of cognitive decline and brain volume change in elderly patients with type 2 diabetes. Dement Geriatr Cogn Disord. 2010;30(5):381–6.
34. van den Berg E, Reijmer YD, de Bresser J, Kessels RPC, Kappelle LJ, Biessels GJ, et al. A 4 year follow-up study of cognitive functioning in patients with type 2 diabetes mellitus. Diabetologia. 2010;53(1):58–65.
35. Zilkens RR, Davis WA, Spilsbury K, Semmens JB, Bruce DG. Earlier age of dementia onset and shorter survival times in dementia patients with diabetes. Am J Epidemiol. 2013;177(11):1246–54.
36. Ma F, Wu T, Miao R, Xiao YY, Zhang W, Huang G. Conversion of mild cognitive impairment to dementia among subjects with diabetes: a population-based study of incidence and risk factors with five years of follow-up. J Alzheimers Dis. 2015;43(4):1441–9.
37. Rothman MD, Leo-Summers L, Gill TM. Prognostic significance of potential frailty criteria. J Am Geriatr Soc. 2008;56(12):2211–6.
38. Johansen KL, Dalrymple LS, Delgado C, Kaysen GA, Kornak J, Grimes B, et al. Comparison of self-report-based and physical performance-based frailty definitions among patients receiving maintenance hemodialysis. Am J Kidney Dis. 2014;64(4):600–7.
39. Op Het Veld LPM, de Vet HCW, van Rossum E, Kempen GIJM, van Kuijk SMJ, Beurskens AJHM. Substitution of Fried’s performance-based physical frailty criteria with self-report questions. Arch Gerontol Geriatr. 2018;75:91–5. 40. Verhagen C, Janssen J, Exalto LG, van den Berg E, Johansen OE, Biessels GJ.
Diabetes-specific dementia risk score (DSDRS) predicts cognitive performance in patients with type 2 diabetes at high cardio-renal risk. J Diabetes Complicat. 2020;16:107674.
Publisher’s Note
Springer Nature remains neutral with regard to jurisdictional claims in published maps and institutional affiliations.