Publisher’s version / Version de l'éditeur:
Vous avez des questions? Nous pouvons vous aider. Pour communiquer directement avec un auteur, consultez la
première page de la revue dans laquelle son article a été publié afin de trouver ses coordonnées. Si vous n’arrivez pas à les repérer, communiquez avec nous à PublicationsArchive-ArchivesPublications@nrc-cnrc.gc.ca.
Questions? Contact the NRC Publications Archive team at
PublicationsArchive-ArchivesPublications@nrc-cnrc.gc.ca. If you wish to email the authors directly, please see the first page of the publication for their contact information.
https://publications-cnrc.canada.ca/fra/droits
L’accès à ce site Web et l’utilisation de son contenu sont assujettis aux conditions présentées dans le site LISEZ CES CONDITIONS ATTENTIVEMENT AVANT D’UTILISER CE SITE WEB.
Internal Report (National Research Council of Canada. Division of Building Research), 1959-06-01
READ THESE TERMS AND CONDITIONS CAREFULLY BEFORE USING THIS WEBSITE.
https://nrc-publications.canada.ca/eng/copyright
NRC Publications Archive Record / Notice des Archives des publications du CNRC :
https://nrc-publications.canada.ca/eng/view/object/?id=b699c17c-ccbc-46bb-8995-912e299331a3 https://publications-cnrc.canada.ca/fra/voir/objet/?id=b699c17c-ccbc-46bb-8995-912e299331a3 For the publisher’s version, please access the DOI link below./ Pour consulter la version de l’éditeur, utilisez le lien DOI ci-dessous.
https://doi.org/10.4224/20338092
Access and use of this website and the material on it are subject to the Terms and Conditions set forth at
Heat flow and ice segregation at an Ottawa site
HEAT FWW AND ICE SEGREGATION AT AN OTTAWA SITE by
L.W. Gold
Report No.
171
of the
Division of Building Research
Ottawa
June
1959
Measurements of ground thermal conditions have been made by the Snow and Ioe Section in studies of the oonditions and properties of the snow cover. Other Seotions of the
Division have interost in the temperatures, heat flow, moisture migration and frost effeots in the ground itself. Reoently
the Snow and Ice Section has been asked to broaden its interests and to assume responsibility for some of the Divisional studies of the ground thermal oondition as well.
It has been possible from results of several sets of measurements made at the outdoor experimental area adjaoent to the Building Researoh Centro to oome to oertain tentative
oonolusions regarding the ohanging thermal oonduotivities and the extent of ioe segregation in the ground during freezing. These are now reported. Further oonfirmation is desirable and may be obtained from subsequent measurements.
The author is a researoh offioer with the Division and as head of the Snow and Ioe Section has speoial interests in the properties of snow and ioe and the environmental faotors whioh affeot them.
Ottawa June
1959
NoBo Hutoheon, Assistant Direotor.
L. W. Gold
During the winters 1955-56, 1956-57, 1957-58, observa-tions were made on the heat flow from the ground in the Ottawa area (1). The observation site was a grassed field セゥエィ the snow cover undisturbed. Temperatures in the ground down to the 8-foot level were measured at a site nearby during 1956-57 (2) and in the immediate vicinity down to the 25-foot level during 1957-58. It was desired to correlate the heat-flow measurements with the ground-temperature observations. A
series of observations was therefore made on the water content of the frozen soil so that an estimate of the heat associated with the freezing of the soil water could be made if necessary.
The analysis of the heat flow and the ground temperature observations was made (3). For this study, the observations related to the freezing of the soil water were not described.
Since these observations are relevant to the frost action
problem, and since field observations and their interpretation are always of value in understanding what is actually occurring under natural conditions, they are ーイセウ・ョエ・、 and discussed in this paper.
WATER CONTENT OF THE FROZEN SOIL
The soil in which the observations were made is a highly sensitive plastic clay with 65 セ・イ cent by weight having a
grain size in the clay range
(4).
Figure 1 shows that theaverage water content in per cent of dry weight tends to increase with depth down to about the 20-foot level but that below this
it is reasonably constant at 80 per cent. The values for the water content for depths below 15 feet were taken from another paper
(4).
In 1958, the moisture contents in the frozen layer were measured at the end of February and beginning of March when the depth of the frozen ground was a maximum, about 30 em.
(12 in.). Two methods were used. Initially, soil chips as obtained with an auger were used to determine the moisture
content in per cent of the dry weight of the soil. Unfortunately, this method does not give the water content per unit volume
which is the quantity required for the heat-flow determinations. Continuous samples were therefore obtained by driving cylindri-cal steel thin-walled tubes verticylindri-cally into the frozen layer
and extracting a sample of the frozen soil. These samples were immediately removed to a cold room and cut into sections of known volume. The water content and dry density of the soil in these volumes were then determined. Figure 2 shows the observed change with depth of the water content expressed as per cent of dry weight. In Fig.
3
is shown the observed change with depth of the water content per unit volume and the dry density.It is well known that all the water in a fine-grain
porous material does not freeze when the temperature is lowered below
ooc
(5).
The ground temperature at 10 cm.(4
in.) below the ground surface at the observation site was never lower than-5°c
during Februarl1958.
When the frozen sample was taken it had risen to-3
C. From the results of the work of Lovell, it was estimated that the weight of unfrozen water per unit volume was about25
per cent of the dry density of thesoil for the temperatures encountered. This estimate is probably a little high.
Calorimetric observations by P.J. Williams indicated that the estimate was of the right order. Unfortunately, the potential errors when using crude equipment in the field made the calorimetric observations unreliable. In Table I are shown the calculated amounts of unfrozen and frozen water based on the average of the water content observations shown in Fig.
3.
In Fig.3,
the change with depth of the calculated frozen water content セ・イ unit volume is given. To convert to heat(cal/cm3 ) the frozen water content per unit volume was multi-plied by 80. The dashed line in Fig.
3
gives the values for the ice content per unit volume used in the heat calculations.From the ground temperature observations, it is possible to obtain the time dependence of the depth of the OOC isotherm. This is plotted in Fig.
4
for1956-57
and in Fig.5
for1957-58.
From the observations made by the Soil Mechanics Section ofthe Division of Building Research on the depth to the bottom of the frozen layer during
1956-57,
it appears that this depth need not coincide with the OoC isotherm. This was borne out by the more careful observations during February1958.
Unfor-tunately, the depth of the frozen layer was not observed con-tinuously during the1957-58
winter. .In order to estimate the rate at which the water was frozen in the soil during
1957-58,
it was assumed that the depth to the bottom of the frozen layer coincided with the OoC isotherm until January15
and that it decreased linearly thereafter to the maximum depth on February 26.TABLE I
ESTIMATED ICE CONTENT FOR EACH DEPTH FOR THE WINTER OF 1957-58
Average Calculated Average
measured unfrozen measured Estimated De)th dry density water water content ice content
(em. (tn.) (gm/cc) (gm/cc) (gm/cc) (gm/cc) 2.5 1 0.81 0.20 0.55 0.35 5 2 0.68 0.17 0.57 0.40 7.5 3 0.82 0.20 0.59 0.39 10
4-
0.92 0.23 0.54 0.31 12.5 5 0.83 0.21 I 0.55 0.34 15 6 0.82 0.20 0.61 0.41 17.5 7 1.10 0.28 0.49 0.21 20 8 1.14 0.28 '0.50 0.22 22.5 9 1.16 0.29 0.50 0.21 25 10 1.16 0.29 0.51 0.22 27.5 11 1.32 0.33 0.49 0.16 30 12 1.37 0.34 0.44 0.10From the information plotted in Figs .. 4 and 5 it was possible to estimate the rate of increase of the depth of the セイッコ・ョ layer. With this information, and that contained in Fig. 3, it was possible to calculate the time dependence of
the heat associated with the freezing of the water. In Figs. 4 and 5, the heat flow measured at the 5-cm level for 1956-57 and the 10-cm level for 1957-58 and the calculated heat associated with the freezing of the water for these
winters are given. The calculations for the winter of 1956-57 were made possible by assuming that the water content per unit volume in the frozen layer was the same as for 1957-58. This
assumption was considered reasonable as the moisture contents as a percentage of dry weight determined during the
1956-57
winter by the Soil Mechanics Section agreed with those deter-mined during
1957-58
as shown in Fig. 2.One of the interesting facts shown in Fig.
3
is thedecrease in ice content with depth. In the following discussion, various factors are considered which might be responsible for this observed decrease.
FACTORS RELATED TO ICE SEGREGATION IN THE SOIL
Penner
(6),
Power(7),
and Gold(8)
have shown that during ice segregation the temperature of the freezing planeshould be depressed below the normal freezing temperature of water (OOC). The observations on the depth to the freezing
plane and the depth to the OOC isotherm support this conclusion. The estimated temperature at the freezing plane at maximum
penetration was about
-1°C
for the1956-57
winter and about-0.5°c
for the1957-58
winter. Overburden PressurePenner (6) has shown that a clay soil such as that at the observation site, can develop negative pressures in excess of
1000
gm/cm2 in the pore water, before ice segregation in the soil is halted. He has also shown that if the pore water pressure is zero, an overburden pressure greater than the maximum negative pore water pressure is required to stop the ice segregation(9).
For the depths of freezing and soildensities encountered in the field observations, the overburden pressure would hardly exceed
100
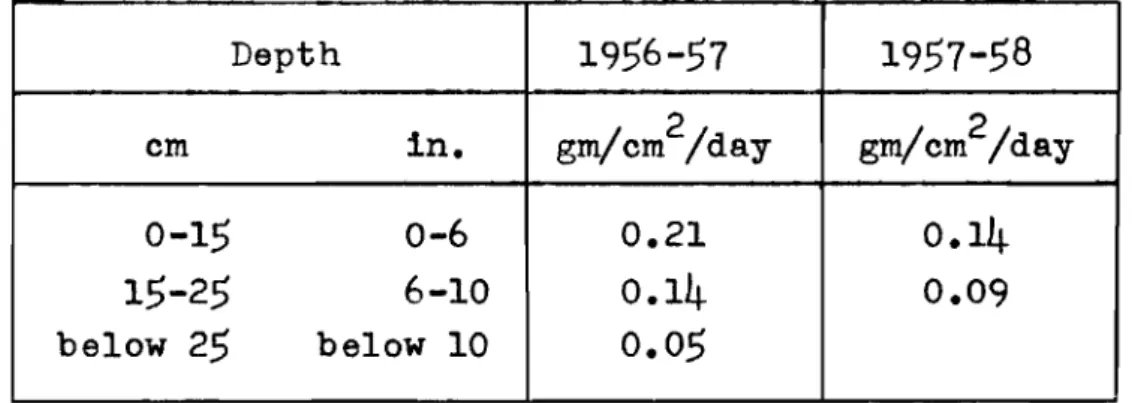
gm/cm2• It is therefore con-cluded that overburden pressure would have little influence on the observations.Rate of Flow of Water to Freezing Plane
The water content in the upper
15
em(6
in.) of the soil in late October and early November before freezing commenced was between25
to30
percent of the dry weight. From Fig. 1, which gives also the standard deviation in the water content observations of each level, it is S6en that the water content is not much above30
per c6nt down to the45
cm(18
in.) level. Since about25
per cent by dry weight of the water remainsunfrozen the amount of water drawn into any level during freezing would be about equal to the amount of water frozen. In Table II are given the calcula.ted flow rates corresponding to the estimated amount of frozen water for vnrlous levels for the two years.
TABLE II
ESTIMATED UPPER LIMIT TO RATE OF FLOW OF WATER TO FREEZING PLANE
Depth 1956-57 1957-58 in. 2 gm/cm2/day em gm/cm /day 0-15 0-6 0.21 0.14 15-25 6-10 0.14 0.09 below 25 below 10 0.05
From Table II it is seen that the maximum rate observed was of the order of 0.2 gm/cm2/day or 80 3 x 10⁻³ grn/cm2
/ hr.
Thesoil has a permeability coefficient of the order of 0.8 x 10⁻³ (cc/cm2) / (em H20/em). Penner has shpwn that this permeability coefficient is almost independent of water content over the soil water pressure range of 0 to -500 gm/cm2 (10). For pressures
less than -500 gm/cm2, the permeability coefficient decreases slowly with decreasing pressure. To supply 8.3 x 10⁻³ gm/cm2
/ hr
would require a pressure gradient in the soil moisture of the order of 10 (gm/cm2)/(cm). The freezing plane could therefore draw water from a depth below it of about 60 cm (2 ft) before the permeability coefficient would begin to decrease and thus become a limiting factor in the flow rate. As the freezingplane penetrates, the flow rate decreases and water can be drawn from greater depths still without seriously affecting the
permeability coefficient of the soil. Since the water table at the observation site was within 3 ft of the surface when the winter began, the observations indicate that availability of water and permeability of the soil should not have interfered
Negative Pore Water Pressures
Penner (6) has shown that the rate of heaving of a frost-susceptible soil, and therefore the amount of ice formed over a given period of time, depends partly on the magnitude of the pore water pressure. No measurement of the pore water pressure was made in the field but the existence of the temperature
depression at the freezing plane indicates that a negative
pore water pressure did exist. An increasing negative pressure as the frost line penetrates would contribute to the decrease in frozen water content with depth.
Pearce has carried out a detailed analysis of ground temperatures observations made in the Ottawa area (II). He found that below 30 cm (1 ft) the observations satisfied certain requirements for the application of standard heat conduction theory and could be fitted closely by the first harmonic approximation to the annual temperature cycle at any depth. Above 30 cm, deviations occurred which could be attri-buted to non-homogeneity of the soil, the influence of soil water and to the higher frequency components in the temperature variations. He concluded that the simple thermal model, which was satisfactory for depths below 30 cm, did not accurately describe the thermal behaviour of the upper soil layers. It is necessary to go directly to the observations to obtain an appreciation of the thermal behaviour 'of these layers.
In Fig. 6 is plotted a series of temperature - depth curves. A sudden change in the temperature gradient at about the 15 cm (6 inJ level is characteristic of these profiles. Above 15 cm, the soil has a significant organic content and therefore a lower thermal conductivity is to be expected.
The thermal properties of this soil are such that daily temperature fluctuations have virtually disappeared at the l5-cm level. Lower frequency temperature cycles due to varia-tions in the weather have virtually disappeared at the 60 cm
(2 ft) level. When there is more than 15 cm (6 in.) of snow cover, the daily fluctuations in temperature virtually disappear at the 5-cm level. Generally speaking, the higher the frequency of the temperature disturbance, the larger can be the possible temperature gradients associated with it.
Since the ground エ・ュー・イ。セウ do not change very rapidly when there is a snow cover, it is possible to obtain from the ground temperature and heat flow observations, values for the apparent thermal conductivity of the soil for the upper 15 cm and for the layer below the freezing plane. Average values are given in Table III for the period January
14
to 21 and Februaryequal to the heat flow in the frozen layer minus the amount calculated for the freezing of the water.
Over the period used in the calculations, the thermal conductivity is fairly constant, but it changes markedly from January to February. Observations on the thermal characteristics of the snow cover tend to confirm エィセエ this change is not due to errors in the measurement of the heat flow and 80 must be related to changes in the thermal properties of the soil. It is possible that this change with time is related to the move-ment of water vapour under the combined temperature and vapour pressure gradient which need not be simply related near the ground surface. The figures in Table III indicate the diffi-culty in calculating the heat flow through soil near the
surface from assumed thermal constants even over short periods, the density and the water content of the soil being known.
TABLE III
AVERAGE THERMAL CONDUCTIVITY VALUES CALCULATED FROM THE TEMPERATURE GRADIENT AND HEAT FLOW OBSERVATIONS
Calculated Thermal Conductivity
Period
*
0-15
cm(0-6
in.)40-80
cm(16-32
in.)1958
cal/cm
2
/ hr
Btu/ft2
/ hr
cal/cm2
/ hr
Btu/ft2
/ hr
°C/cm °F/ft °C/cm °F/ft
Jan
14-21
5.0
0.34
13.9
0.93
Feb
14-21
2.9
0.19
9.1
0.61
i} Values calculated for the frozen layer not corrected for
heaving of the soil. These values are probably about
Heat Balance at the Freezing Plane
Before discussing the possible relation between the temperature gradient and ice segregation, it will be of value to introduce some simple heat flow conditions and equations which apply. Considering the heat balance at the freezing plane, the heat flowing from the freezing plane to the surface must equal the heat flowing from the unfrozen soil to the
freezing plane plus the heat released when the water freezes. If qf is the heat flow in the frozen layer, qu is the conducted heat in the unfrozen layer and ql is the heat released when the water freezes. Then
If it is assumed that the thermal conductivity of the frozen soil remains constant and that the ratio of the heat flow to the temperature gradient in the un£rozen soil is also constant over a reasonable length of observation time, then
where kf is the thermal conductivity of the frozen soil aId
(d Tf) / HセクI is the temperature gradient in the frozen soil;
where ku is the apparent thermal conductivity of the unfrozen soil and
(d
Tu) / (d x ) is the temperature gradient in the unfrozen soil.
For ice segregat ion to occur, kf
(a
Tf) / «)x ) must be greater than ku
(d
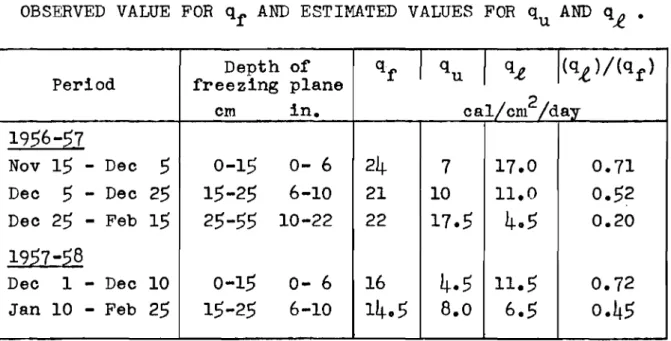
Tu) / HセクIN In Table IV are given theobserved values for qf and the estimated values for qu and
qL
for various periods. The depth of the freezing plane is also given.From Table IV it is seen that from the surface down to the
25
cm (10 in.) level, qf on the average is greater than twice que The temperature profiles plotted in Fig. 6 show no marked discontinuity in the temperature gradient at the freezing plane, within the accuracy of the experiments, which did not exist while the soil was in the unfrozen state. It would therefore appear that the increase in heat flow on the frozen side of the freezing plane is associated primarily with an increase in the thermal conductivity.Kersten (12) has shown from laboratory studies that
when soil freezes there can be a marked increase in the thermal conductivity. The amount of increase depends on the moisture content; the higher the initial moisture content, the greater the increase. For a fine-grain soil such as clay, he shows an increase of about
50
per cent for an initial water content of30 per cent of the dry weight. Kersten reported that no ice segregation occurred during freeZing. If ice segregation were to occur in the soil during freeZing, it is to be expected that the increase in the thermal conductivity would exceed the
values reported by Kersten.
Heat Flow and Ice Segregation
Let it be assumed, as indicated by the observations, that the temperature gradient is continuous across the freezing plane. Assume also that the thermal conductivity of the soil
increases by a factor セ on freezing; kf
=
e><:.k u• Then(dT
f ) / HセクI
=
(aTu) / (ox) at the freezing plane. q.( = ku (0< - 1) (-a Tf) /
«)
x )For (qt) / (qf) to be of the order of 0.70 the conduc-tivity in the frozen state must be about 3 times the conductivity in the unfrozen. Information is not available to show if this increase can occur with the soil in the upper layers at the observation site, but the temperature profiles in Fig. 6 indi-cate that it is possible.
TABLE IV
OBSERVED VALUE FOR qr AND ESTIMATED VALUES FOR qu AND q,e •
Depth or qr
I
quI
q-e /(q.e}/(qf) Period freezing planecm in. ca1/cm2/day 1956-57 Nov 15 - Dec 5 0-15 0- 6 24 7 17.0 0.71 Dec 5 - Dec 25 15-25 6-10 21 10 11.0 0.52 Dec 25 - Feb 15 25-55 10-22 22 17.5 405 0.20 1957-2.§ Dec 1 - Dec 10 0-15 0- 6 16 4.5 11.5 0.72 Jan 10 - Feb 25 15-25 6-10 1405 8.0 6.5 0.45
If (J T) / (a x ) does not increase by very much at the freezing plane, then アセ should depend primarily on ku' セ and the temperature gradient at the freezing plane. Generally
speaking, when the freezing plane is advancing into the ground, the temperature gradient decreases with depth and at any depth, decreases with time. Moreover, the larger アセ or rate or ice
segregation, the larger should be the value for セN These factors working together tend to make アセ ' the rate or ice segregation, largest near the surface and to decrease as the freezing plane penetrates. The amount of water frozen at any
level would depend on the rate of ice segregation and the rate of penetration of the freezing plane. Figure
4
shows that for1956-57,
when no extended warm periods occurred such as during December of1957,
the frost line on the average advanced down-ward at an almost constant rate. It is of interest to note that the rate of advance of the OoC isotherm below the30
cm(12 in.) level agreed reasonably well with that which would be predicted from the thermal model developed by Pearce taking into account the snow cover.
The one factor which has been neglected in this discus-sion is the heaving of the ground during ice segregation. The decrease in dry density in the upper level shown in Fig•
3
3
isprobably due to this heaving. The estimated
0.36
gm/cm of frozen water at the surface is consistent with an initial dry density of about 1.2 gm/cc assuming this amount of water caused a heave of about0.36
cm. This value for the initial drydensity is not unreasonable. If the swelling of the soil is about
30
per cent, then for the upper15
cm(6
in.) the tempera-ture gradients given in Fig.6
are too steep by about30
per cent and the thermal conductivities in Table III too low by about the same amount. These errors decrease with depth.The original purpose of the heat flow observations made at the Montreal Road Laboratory site キセウ to determine the
effect of snow cover on heat flow from the ground. It was shown (1) that during periods of continuous below freezing temperature, the relationship between the integrated heat flow from the ground and the air temperature and snow depth is
where the integration is over the time period of interest and is the thermal conductivity of the snow corresponding to the average density of the snow cover
is the air temperature measured at the 120 cm
(4
ft) level in a Stevenson screenis the ground temperature at the 10 cm level is the depth of the snow cover plus
5
cmIt was assumed that the insulating effect of the ground was about half that of the snow. The observations on the
from the ground varies directly with the difference in tempera-ture hetween the air and the temperatempera-ture at the ground-snow interface and inversely as the depth of the snow for snow of given thermal properties. With these facts, it is possible to account for all the significant fluctuations in the heat flow and shallow ground tempera.ture observations during the winter period.
SUMMARY
At an observation site at Ottawa, ice segregation was observed in a grass covered clay soil with undisturbed snow cover. The amount of ice segregation decreased with depth. The observations, interpreted in the light of published labora-tory investigations, indicate that the ice segregation was not
seriously limited by overburden pressure or by availability of water.
Two factors were considered which would account for the decrease in frozen water content with depth. The first factor was the development of negative pore water pressures which
affects the rate of ice segregation. The second was the thermal balance at the freezing plane. Since the observed temperature gradient showed no discontinuity at エセ・ freezing plane, it was concluded that the thermal conductivity of the frozen soil must be greater than the unfrozen in order for the heat flow to balance at the freezing plane during ice segregation. The rate of ice segregation would thus depend on the increase in the thermal conductivity of the soil on freezing, the magnitude of the temperature gradient and the magnitude of the pore
water pressure. The thermal conditions and the hydraUlic conditions must always adjust themselves so that equilibrium is maintained. The decrease in the temperature gradient and the likely increase in the negative pore water pressure with depth and with time during the freezing period combined with an almost constant rate of penetration of the freezing plane would account for the decrease in ice content with depth.
1. Gold, L.W. Influenoe of snow oover on heat flow from the ground. Some observations made in the Ottawa area.
From Assooiation Internationale dtHydrologie Soientifique, Union Geodesique et Geophysique Internationale, Assemblee Generale de Toronto 1957, Gentbrugge 1958, Tome IV, pp 13-21. NRC 4827.
Legget, R.F. and C.B. Crawford. Soil temperatures in water works praotioe. Jour. Amer. Water Works Assoo. vol.
44,
nos 10, October 1952, pp 923-939. Division of BuildingResearoh, National Researoh Counoil, Ottawa, NRC 2910.
3.
6.
Pearoe, D.C. and L.W. Gold. Observations on the ground temperature and heat flow at Ottawa. Submitted for publioation.
Eden, W.J. and C.B. Crawford. Geotechnioal properties of Lada olay in the Ottawa area. Division of Building Research, National Researoh Council, Ottawa, 1957, NRC 4383.
Lovell, C.W. Temperature effects on phase composition and
strength of partially-frozen soil. Highway Research Board, Bull. 168, 1957. pp 74-95.
Penner, E. Soil moisture tension and ice segregation. Highway Researoh Board Bull. 168, 1957. pp 50-64. Division of Building Researoh, National Research Council, Ottawa, NRC 4738.
7.
Powers, T.C. Resistance of conorete to frost at early ages. RlLEM Symposium on Winter Concreting, Copenhagen, 1956, Proceedings, Session C, General Report, 50 p.8. Gold, L.W. A possible force meohanism assooiated with the freezing of water in porous materials. Highway Researoh Board Bull. 168, 1957. PP 65-73. Division of Building Research, National Researoh Council, Ottawa, NRC 4737. 9. Penner, E. Pressures developed in a porous granular system as
a result of ice segregation. Presented at the 37th Annual Meeting of the Highway Researoh Board, Washington, D.C. January 1958.
10. Penner, E. On the meohanism of frost heaving in soils. Presented at the 38th Annual Meeting of the Highway Researoh Board, Washington, D.C. January 1959.
11.
Pearce, D.C. Ground temperature studies at Saskatoon and ottawa. From Association Internationale d1Hydrologie Scientifique,Union Geodesique et Geophysique Internationale, Assemblee Generale de Toronto
1957,
Gentbrugge1958,
Tome IV,pp
279-290.
Division of Building Research, National ResearchCouncil, ottawa, NRC
4796.
12.
Kersten, M.S. Thermal properties of soils. University of Minnesota, Eng. Exp. Station, Bull. No.28,
Minneapolis,20 25 6·0 7·5
a:
1·22 1·5 0'85 5 1·11 \ \\
\ 3·0 \ 10 (f) \ a: \ -LLI....
....
\ u. LLI -:E \ J:-
\....
% 4-5 15 CL LLI....
0 CL LLI 0o
10 20 30 40 50 60 70 80 90 100WATER CONTENT (% OF DRY WEIGHT) VALUES FOR I TO 6 FT. AVERAGE OF MONTHLY READINGS TAKEN OVER PERIOD OCT./56 TO OCT./57.
(S IS STANDARD DEVIATION OF THE 13 OBSERVATIONS AT EACH DEPTH.
BELOW _15 FT. VALUE S TA KEN FROM RE FERENCE 4.
FIGURE I
WATER CONTENT OF SOIL AT OBSERVATION SITE
90 n CONTINUOUS SAMPLE
-
セ"
•
II " } USED ALSO セ•
C) 80•
II II FOR UNIT-
LLI"
II II VOLUME 3= D•
>- 70•
•
CALCULATIONS a:::"
..
0...
0
•
i
•
セ AUGERED SAMPLE (ONE SAMPLE)o
•
0•
u, 60 j 0 0"
0 .0•
セ c· 0 50 0-
•
0•
0•
セ•
c•
•
z 40"
"
.& 0 LLI•
I- o"
"
Z dセ 0 30 0•
•
0 u 0•
a セ a:::•
•
セ..
LLI 20•
セセ
10 0 0 5 10 15 20 25 30 35 40 45 50 DEPTH (em) FIGURE 2o • WATER CONTENT gm/ee SAMPLE I
セ 1·6 • WATER CONTENT om/ee SAMPLE 2
-E
01 A ESTIMATED FROZEN WATER CONTENT gm/ee
-
0:: 1·4 0 -a IJJ 0 セ [] <t 1·2 0 0-セ 0 a
.
[] -oJ 0 1·0 n 0 0 a -(f) [] [] 0 )- 0·8 13 -0:: 13 [] C 0 I.L 0.6g
セ•
•
-0
•
•
•
••
•
•
II
I
•
)-•
•
•
セ•
- 0·4 A A -(f) _ _ , _ _ _ _ _ A_ - - - - A - - - , Z & \ IJJ \ c 0·2 \- .... - - A- - -&- - - &_ ---A--
- A - - - - A .& OL I,
I I I I I I 0 5 10 15 20 25 30 35 40 45 DEPTH (em) FIGURE 3DEPENDENCE OF THE DRY DENSITY OF THE SOIL AND THE WATER CONTENT
LEGEND:
-i
80o FROST DEPTH BY AUGER • DEPTH OF O°C ISOTHERM
60 20 30
E
2 70 40 :J: l-ll. I.Ll 50 Cl oWITH THE FROZEN WATER
0"-0
セo
BセBGセ
II
I
-,-.
,/' ,/"セ
GNセMMMM
--"
".
•
•
MEASURED HEAT FLOW AT 5 em LEVEL 2400 2200 2000
cf
1800 u セ 1600 1:1 u ' - " セ 1400 0 ...J LL. 1200 t-el UJ 1000 :J: 800 600 400 200 0NOV. DEC. JAN. FEB. MAR. APR. MAY
FIGURE 4
HEAT ASSOCIATED WITH THE FROZEN WATER
.--.-
...
-
...
セ Nセ セ I \ I \ tl \ I \ 0 0 " .....
,.
.
...
\ /'.
, / \.
Gセ , ' /.
.
r'e ... '-... 20 E u 60 50 30 ::I: I-a.. LLI 40 0 MAY APR. MAR. LEGEND:o FROST DEPTH BY AUGER • DEPTH OF O°C ISOTHERN
5 10 15 20 25 5 10 15 20 25 5 10 15 20 25
FEB.
5 10 15 2025
JAN. DEC.
MEASURED HEAT FLOW AT 10em LEVEL NOV. 2400 2200 2000 1800 N 1600 E セ 1400 0 u
...
セ 1200 0 ...J LL 1000 l-e:( 1JJ 800 ::I: 600 400 200 0 FIGURE 540 60 80 1/10/57 5/11 /57 3/12/57
-
::::E 0 100-
8 10 12 14 16 2 4 6 8 10 -2 0 2 4 6 :r: t-O 0-W 0 20 40 60 14/1/58 28/1/58 18/2/58 80 100 -4 -2 0 2 4 -4 -2 0 2 4 -4 -2 0 2 4 TEMPERATURE(oel
FIGURE 6GROUND TEMPERATURE PROFILES