Uncertainty, and Marketing
Strategy
by
Xinyu Cao
B.S. in Mathematics and Physics, Tsinghua University, 2011
M.S. in Industrial Engineering and Operations Research,
University of California, Berkeley, 2013
S.M. in Management Research,
Massachusetts Institute of Technology, 2016
Submitted to the MIT Sloan School of Management
in partial fulfillment of the requirements for the degree of
DOCTOR OF PHILOSOPHY IN MANAGEMENT
at the
MASSACHUSETTS INSTITUTE OF TECHNOLOGY
JUNE 2018
®
Massachusetts Institute of Technology 2018. All rights reserved.
Author...
Signature redacted
MIT Sloan School of Management
Certified by...Signature
redacted
May 8, 2018
Juanjuan Zhang
Epoch Foundation Professor of International Management
Professor of Marketing
Signature redacted
Thesis Supervisor
A ccep ted by ...
...
Catherine Tucker
MASSACHETS ILNSTITUTE OF TECHNOLOGYJUN 15 2018
LIBRARIES
Sloan Distinguished Professor of Management
Professor of Marketing
Chair, MIT Sloan PhD Program
Consumer Inattention,
Consumer Inattention, Uncertainty, and Marketing Strategy
by
Xinyu Cao
Submitted to the MIT Sloan School of Management on May 8, 2018, in partial fulfillment of the
requirements for the degree of
DOCTOR OF PHILOSOPHY IN MANAGEMENT
Abstract
This dissertation investigates the implications of consumer inattention and uncer-tainty for firms' advertising and pricing decisions.
The first chapter is an overview of the problems addressed in the dissertation and the main findings.
The second chapter develops a theory-based, cost-effective method to estimate the demand for new products using choice experiments. The premise is that consumers are uncertain about their valuation of a new product and need to spend costly effort to learn their valuation. The effort consumers spend is affected by the probability of their choice being realized, and as a result will change the manifested demand curve derived from choice experiments. We run a large-scale choice experiment on a mobile game platform, where we randomize the price and realization probability of a new product. Data support our theoretical hypothesis. We then estimate a structural model of consumer decisions. The structural estimates allow us to accurately infer actual demand based on choice experiments of small to moderate realization probabilities.
The third chapter examines firms' advertising strategy on social media under consumers' limited attention. Advertising on social media faces a new challenge as consumers can actively select which advertisers to follow. A Bayesian learning model suggests that consumers with limited attention may rationally choose to unfollow a firm. This happens if consumers already know about the firm's value well and if the firm advertises too intensely. However, we find that intensive advertising may still be the optimal strategy for firms. If a firm is perceived as providing low value, it will want to advertise aggressively to change consumers' mind; if a firm is perceived as providing higher value, it will also want to advertise intensively, but in an effort to crowd-out advertising messages from its competitors. Tracking company accounts of 49 TV shows on the most popular tweeting website in China provides empirical evidence that both popular and non-popular firms advertise intensively, although the number of followers does go down when a firm advertises too intensively.
The fourth chapter investigates channel coordination in search advertising. Given that consumers have limited attention, there are only a limited number of advertising slots on search engine platforms that can attract positive number of clicks. A
manu-facturer can sponsor retailers to advertise its products while at the same time compete with them in a position auction with limited number of slots. We prescribe the op-timal cooperative search advertising strategies for the manufacturer. We find that it may not be optimal for a manufacturer to cooperate with all of its retailers, even when these retailers are ex ante the same. This finding reflects the manufacturer's tradeoff between higher demand and higher bidding cost caused by more intensified competition. With two asymmetric retailers, the manufacturer should support the retailer with the higher channel profit per click to get a higher position than the other retailer. The manufacturer should take a higher position than a retailer when its profit per click via direct sales exceeds the channel profit per click of the retailer. We also investigate how a manufacturer uses both wholesale and advertising contracts to coordinate channels with endogenous retail prices.
Thesis Supervisor: Juanjuan Zhang
Title: Epoch Foundation Professor of International Management Professor of Marketing
Acknowledgments
In the first place, I would like to express my gratefulness to my thesis supervisor, Juanjuan Zhang. I deeply feel that having Juanjuan as my advisor is one of the most fortunate things in my life. Before formally working with Juanjuan, I was perplexed about my research direction. It was Juanjuan that helped me find the research topics that I am truly excited about. Every meeting with Juanjuan was inspiring and could spark new ideas. Juanjuan gives me not only invaluable guidance in research, but also incredible support in many other aspects of life. She is always very positive and encouraging. Every time when I feel frustrated due to an obstacle in research or a failed interview, she can always cheer me up and make my heart full of hope. She generously shares all her experiences, and always encourages me to be myself. Since I started to work with Juanjuan, I became more confident and comfortable in various situations. She is definitely my role model in my academic career.
I would also like to thank all other faculty members who have helped me
through-out my Ph.D. study. John Hauser encouraged me to explore my research interests early on and provided invaluable support. I also learned many concepts and tech-niques from his carefully designed Ph.D. seminar, which helped me a lot in my re-search. Tony Ke and I had been known each other before I came to MIT. He was my mentor when I was a graduate student at UC Berkeley. It is like a miracle that after several years, we met again at MIT. I am incredibly lucky to have Tony as my mentor, coauthor, and friend. Working with him is efficient and enjoyable. He can always quickly get to the key point, pushing me to think deeper and more rigorously. Birger Wernerfelt gave me precious opportunities to be his research assistant and teaching assistant for many times, and I benefited tremendously from these experiences. From his class and our individual meetings, I learned how to formulate and screen research ideas at the early stage, and how to investigate managerial problems at a deep level. From Catherine Tucker, I learned how to dig into data, as well as how to teach in a very effective and inspiring way. I have also got extremely helpful suggestions on my research from Sinan Aral, Sharmila Chatterjee, Dean Eckles, John Little, Drazen
Pr-elec, and Duncan Simester. I deeply admire them as superb researchers and charming professors.
I am very lucky to be surrounded by a brilliant group of peers and friend at
MIT. Thanks to the marketing family - Matthew Cashman, Yiqun Cao, James Duan, Madhav Kumar, Song Lin, Nell Putnam-Farr, Xiang Song, Artem Timoshenko, Jeremy Yang, Shuyi Yu, Yunhao Zhang, and Yuting Zhu, my Ph.D. life has been not lonely at all. I am especially thankful to my former officemate and also my marketing "brother" Song Lin for his tremendous help and guidance. I was touched by his diligence and unselfishness. My friends from other departments, Jie Bai, Yu Shi, Fei Song, Shujing Wang, Yufei Wu, Xin Xu, and many others, have made my life at MIT
full of joy.
Words cannot describe my gratitude to my family. I have always been feeling that I have the best parents in the world. Though they are not very wealthy, they supported me to get the best possible education in my hometown and in my home country. Though I am their only child, they encouraged me to go abroad to see the world. They are always supportive and cheerful. No matter how many difficulties I met, I never lose hope, because I know my family is there supporting me. Bin, thank you for your unconditional love and support. Life has not been easy for a family with two Ph.D. students in two different cities. The many flights on Friday midnight and Monday morning, as well as the long phone calls everyday have recorded our love and memorable doctoral life. After six years being in long distance, we will finally unite to start our new chapter of life.
Contents
1 Overview 15
2 Prelaunch Demand Estimation
2.1 Introduction . . . . 2.2 Literature Review . . . .
2.3 Theory Model . . . .
2.4 Field Experiment . . . .
2.5 Reduced-Form Evidence . . . .
2.6 Evaluating the Demand Estimation Method . . . .
2.6.1 A Structural Model of Consumer Product Choice 2.6.2 Estimation Procedure . . . . 2.6.3 Identification . . . . 2.6.4 Estimation Results . . . .
2.6.5 Forecasting Demand in Real Purchase Settings . . .
2.7 Concluding Remarks . . . .
2.A Appendix . . . . 2.A .1 Figures . . . .
2.A .2 Tables . . . . 2.A.3 Proof of Proposition 1 . . . . 2.A.4 Proof of Proposition 2 . . . .
2.A.5 Details of Structural Estimation and Extrapolation
19 19 22 26 30 32 34 35 37 38 38 39 43 44 44 49 53 54 57
3 Rational Spamming
3.1 Introduction ...
3.2 Background and Motivating Phenomena .
3.1 Background and Data
3.2 Summary Statistics and
3.3 M odel . . . . 3.1 Rational Unfollowing 3.2 Rational Spamming . 3.3 Extensions . . . . 3.4 Concluding Remarks . . . . . 3.A Appendix . . . . 3.A.1 Figures . . . . 3.A.2 Tables . . . .
3.A.3 Proof of Proposition 4 3.A.4 Proof of Proposition 5
3.A.5 Online Survey . . . . .
Motivating Phenomena
4 Cooperative Search Advertis 4.1 Introduction . . . . 4.2 Basic Model . . . . 4.1 Position Auctions . 4.2 Coordination Game 4.3 Equilibrium Analysi 4.4 Integrated Channel 4.3 Manufacturer's Direct Parti 4.4 Extensions . . . . 4.1 Identity-Dependent 4.2 Endogenous Retail I 4.3 Endogenous Wholes 117 . . . 117 . . . 125 . . . 125 . . . 127 . . . 129 . . . 135 139 143 143 144 149 Clic-ThoughRa... . . . . . . . . .
cipation in Search Advertising . .
Click-Through Rate . . . .
rices with Price Competition . ale Contracts and Retail Prices 4.5 Conclusion . . . . 61 61 66 66 68 74 77 81 87 92 94 94 97 101 110 112 155
4.A Appendix ...
4.A.1 Figures . . . .. 4.A.2 Proof of Theorem 2 4.A.3 Analysis of the Case 4.A.4 Proof of Proposition 4.A.5 Proof of Theorem 3 4.A.6 Proof of Theorem 4 4.A.7 Proof of Theorem 5: 4.A.8 Endogenous Wholesa
. .. .V . ... . . . . .. . . . .
6...
with Vabetween ri andi2r2 6 .. . . .
le Contracts and Retail Prices:
157 157 161 163 165 172 187 189 194
List of Figures
2-1 Intended Contribution of the Chapter . . . . 44
2-2 Illustration of Theory Prediction . . . . 45
2-3 Screenshot of the Choice Task . . . . 45
2-4 Content of the Player Package . . . . 46
2-5 Aggregate-Level Experiment Result . . . . 47
2-6 Compare Actual and Forecast Demand Curves . . . . 48
3-1 Average Posting Intensity vs. Popularity . . . . 94
3-2 The Consumer's Optimal Strategy of Unfollowing . . . . 95
3-3 Comparative Statics . . . . 96
3-4 The Probability of Being Chosen as a Function of Posting Intensity, Given All Other Firms Post to the Upper Bound Intensity . . . . 96
3-A ES(1, h; ni, n2) as a function of ni when -2 < U2, M > Mo . . . . 108
4-1 An Example of Google Ads on"Laptop". . . . . 157
4-2 Manufacturer's Optimal Cooperative Search Advertising Strategy, Given Two Symmetric Retailers. . . . . 158
4-3 Manufacturer's Optimal Advertising and Cooperative Search Adver-tising Strategies, Given Two Symmetric Retailers and Equal Channel Profit. ... ... 159
4-4 Timeline of Events with Endogenous Wholesale Contracts and Retail P rices. . . . . 159
4-5 Manufacturer's Optimal Wholesaling and Cooperative Advertising Strate-gies under Linear Wholesale Contracts. . . . . 160
List of Tables
2.1 Number of Users by Realization Probability and by Price . . . . 49
2.2 Summary Statistics of User Characteristics . . . . 49
2.3 Individual-Level Experiment Result . . . . 50
2.4 Price Sensitivity Increases with Realization Probability . . . . 50
2.5 Summary Statistics of Effort Measures . . . . 50
2.6 Effort Increases with Realization Probability . . . . 51
2.7 Estim ation Results . . . . 51
2.8 Estimated Effort Level and Effort Cost . . . . 51
2.9 Performance Comparison across Demand Estimation Methods . . . . 52
3.1 Summary Statistics of Accounts . . . . 97
3.2 Hourly Number of Posts, Conditional on Posting . . . . 98
3.3 Advertising Intensively May Drive Followers Away, Hourly . . . . 99
3.4 Advertising Intensively May Drive Followers Away, 4-Hour Period . . 100
3.A1 When n1+n2 ;> M, n2 > 0, the relationship between f (i) = ES(1, 1; ni, n2) and 0 = " . . . 104
3.A2 Summary Statistics of the 5-level Questions and Time of Taking the Survey . . . . 115
4.A1 Profits and NE Condition for each Position Configuration - Integrated C hannel . . . 170
4.A2 Profits under each Position Configuration for Integrated Channel and Non-integrated Channel . . . . 171
Chapter 1
Overview
When faced with a product (or a set of products), consumers are uncertain about their valuation of the products and need to spend the effort to learn about the product's valuation (e.g. Wernerfelt 1994, Villas-Boas 2009, Wathieu and Bertini 2007, Guo and Zhang 2012) before making a purchase decision. Such effort is costly as people have limited attention in receiving and processing information (e.g. Sims 2003, DellaVigna
2009). Thus, consumers can rationally choose the amount of effort they put into
learning about a product's valuation before purchasing, and rationally decide the amount and type of information they would like to obtain about the product, which should have significant implications on firms' pricing and advertising decisions. This dissertation investigates firms' pricing and advertising strategies considering consumer inattention.
Chapter 2 develops a demand estimation method using choice experiments consid-ering consumers' uncertainty in product valuation and their rational choice of effort level when making a choice. Demand estimation is important for new products to succeed, as it is the key to making the pricing and production decisions. Researchers have developed hypothetical and incentive-aligned experiments to elicit consumers' product choices. These approaches are much less expensive than test marketing, since consumers' choices will be realized with zero or a small probability in the experiments. However, this study suggests that these approaches can lead to biased estimation of demand because consumers choose a lower level of effort than in the real purchase
setting when making a choice. A theory model is first proposed, which shows that consumers' level of effort increases with the probability of their choice being realized in a choice experiment, and as a result, the manifested demand curve derived from a choice experiment becomes steeper as the realization probability increases. We con-duct a large-scale choice experiment on a mobile game platform to validate the theory
by randomizing the realization probability and price, and the data support the
theo-retical hypothesis. Then a structural model is built based on the theory mechanism, and estimated using data from the incentive-aligned conditions in the field experi-ment. We extrapolate the structural estimates to the real purchase setting, and find that the structural extrapolation is an accurate forecast of the real demand curve. In other words, the structural estimation and extrapolation allow for accurate inference of the actual demand based on choice experiments of small to moderate realization probabilities. Hence this method can help companies determine their optimal price and product plan in a cost-effective way.
Chapter 3 examines firms' advertising strategies on social media under consumers' limited attention. Advertising on social media faces a new challenge as consumers are exposed to a vast amount of information and they can actively select which adver-tisers to follow. A Bayesian learning model is built, which suggests that consumers with limited attention may rationally choose to unfollow a firm. This happens if consumers already know about the firm's value well and if the firm advertises too intensely. However, intensive advertising may still be the optimal strategy for firms. The intuition is that consumers have noisy beliefs about firms' product quality ex ante. If a firm is perceived as providing low value, it will want to advertise
aggres-sively to change consumers' perception about its product quality; if a firm is perceived as providing higher value, it will also want to advertise intensively, but in an effort to crowd-out advertising messages from its competitors. Tracking company accounts of 49 TV shows on the most popular tweeting website in China provides empirical evidence that both popular and non-popular firms advertise intensively, although the number of followers does go down when a firm advertises too intensively.
ad-vertising is an adad-vertising outlet where consumers' limited attention has been made salient: the market is highly concentrated and there are only a limited number of ad-vertising slots on search engine platforms that can attract positive attention (number of clicks) from consumers. A manufacturer can sponsor retailers to advertise its prod-ucts while at the same time compete with them in a position auction with a limited number of slots. Due to the high market concentration of search advertising, a man-ufacturer and its retailers' ads compete instead of complement with each other. We consider a manufacturer, who can sponsor its retailers by sharing a fixed percentage (called "participation rate") of each retailer's advertising cost while at the same time compete with its retailers and outside advertisers in search advertising. We prescribe the optimal cooperative advertising strategy for the manufacturer, in terms of how many and which retailers to sponsor, as well as when the manufacturer should partic-ipate in search advertising directly. We find that it can be optimal for a manufacturer to cooperate with only a subset of its retailers even if they are ex ante symmetric. This finding reflects the manufacturer's tradeoff between higher demand and higher bidding cost caused by more intensified competition. With two asymmetric retail-ers, the manufacturer should support the retailer with the higher channel profit per click to get a higher position than the other retailer, which indicates the efficiency of participation rate mechanism. The manufacturer should take a higher position than a retailer when its profit per click via direct sales exceeds the channel profit per click of the retailer. We also investigate how a manufacturer uses both wholesale and advertising contracts to coordinate the channel when search advertising is a major source of demand.
Chapter 2
Prelaunch Demand Estimation
2.1
Introduction
Accurate demand estimation is important for new products to succeed, but is chal-lenging in the absence of historical sales data (e.g., Braden and Oren 1994, Urban et al.
1996, Hitsch 2006, Desai et al. 2007, Bonatti 2011). For decades, researchers have
spent considerable effort developing market research strategies to estimate product de-mand before actual launch. Solutions to date can be classified into three categories.
Hypothetical approaches ask participants to either state their product valuation or
make hypothetical product choices which are then used to infer their product valua-tion (e.g., Miller et al. 2011). Incentive-aligned approaches further engage respondents
by requiring them to actually purchase the product at the price they are willing to pay
with a "realization probability" (e.g., Becker et al. 1964, Ding 2007). Test marketing, which can be seen as fully incentive-aligned choice experiments, sells the product in trial markets to gather consumer choice data in real purchase environments.
These solutions are imperfect. Hypothetical approaches are known to generate hypothetical biases (e.g., Frykblom 2000, Wertenbroch and Skiera 2002). Incentive alignment can improve the accuracy of demand estimation compared with the hypo-thetical approach (e.g., Ding 2007, Miller et al. 2011), but may not recover demand in real purchase settings accurately (e.g., Miller et al. 2011, Kaas and Ruprecht 2006). Test marketing achieves the highest external validity among the three methods (Silk
and Urban 1978). However, the gain in external validity comes at a cost. Other things being equal, the higher the realization probability, the more actual products the company must provide for market research. Besides higher operational costs, more products means greater opportunity costs of selling at suboptimal prices - by
definition, the company would not know the optimal price before it is able to esti-mate demand.' As a result, existing market research methods often have to trade off external validity against cost control.
In this chapter, we try to resolve this cost-validity conundrum by developing a theory-based, cost-effective method to estimate the demand of new products. This method is low-cost because it relies only on moderate to small realization probabilities. It is effective because it is able to approximate the demand estimation results of test marketing. Figure 2-1 presents the intended contribution of this chapter.
The idea is as follows. We posit that consumers must make a costly effort to learn their true product valuation. For example, consumers may spend time inspecting product features, searching through alternative options, or thinking about possible usage scenarios (e.g., Shugan 1980, Wathieu and Bertini 2007, Guo and Zhang 2012, Guo 2016, Kleinberg et al. 2017). Whether consumers are willing to make this costly effort depends on the realization probability. Intuitively, if a consumer knows that her product choice is unlikely to be realized, she will have little incentive to uncover her true product valuation and will make her choice based on her prior belief. On the contrary, if a consumer knows that her product choice is for real, she will want to think about how much she truly values the product and make her choice prudently. As a result, there exists a structural relationship between realization probability and manifested demand. Our proposed demand estimation method thus proceeds in two steps: first, estimate this structural relationship using product choice data under smaller realization probabilities; second, use the estimation results to forecast product demand in actual purchase settings.
We formalize the above mechanism with a theory model, in which consumers
'The company we collaborate with confirmed that it had refrained from test marketing for the same reason.
decide whether they are willing to purchase a product at a given price and a given realization probability.2 The model predicts that manifested price sensitivity increases
with realization probability. To understand the intuition, imagine that the company had offered the product for free. Agreeing to buy the product had been a no-brainer. Now, suppose the company raises the price gradually. As the price approaches a consumer's prior valuation for the product, she will have a greater incentive to zoom in and think carefully about her true need for the product, and the only change this thinking brings to her decision is to not buy the product. A higher realization probability increases the gravity of the purchase decision and amplifies this negative effect of price on demand. Therefore, it will appear as if consumers are more price-sensitive under higher realization probabilities.
To test the theory model and to evaluate the proposed demand estimation method, we run a large-scale field experiment. We choose the field, as opposed to the lab, in order to minimize factors that may affect external validity other than the realization probability (Simester 2017). We collaborate with a mobile soccer game platform. The new product is a new game package that may enhance user performance. We set four realization probabilities: 0, 1/30, 1/2, and 1, where the 0-probability group is designed to capture the effect of hypothetic approaches and the 1-probability group is designed to mirror test marketing. We randomly assign prices and realization probabilities across users exposed to the experiment.
The experiment results support the theory prediction - consumers are more price-sensitive under higher realization probabilities. We rule out a number of competing explanations of this effect using data from a post-choice survey. Moreover, we obtain process measures of consumers' decision effort. We find that decision effort increases with realization probability, consistent with the behaviorial mechanism underlying the theory prediction.
Having validated the theory foundation of the proposed demand estimation method, we develop a structural model of consumer effort choice and purchase decision based
2
This choice experiment can be seen as a form of incentive-aligned choice-based conjoint analysis
with price being the only product attribute. Marketing practitioners call the hypothetical version of this type of experiment a "Monadic pricing survey."
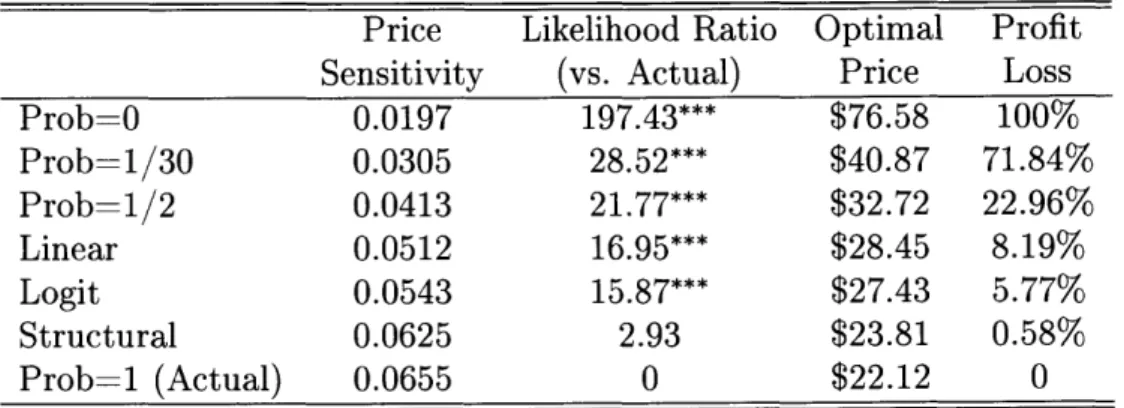
on the mechanism developed in the theory. This forms the core of our proposed de-mand estimation method. More specifically, we estimate the structural model using data from the subsample of smaller realization probabilities (1/30 and 1/2 in the field experiment). To assess the external validity of the proposed method, we use the estimation results to forecast product demand in real purchase settings and compare the forecast against the holdout sample where realization probability equals 1. The structural forecast performs remarkably well. For example, the forecast error in price sensitivity is only 4.49% compared against the holdout sample. Simple extrapolation of data from smaller realization probabilities to actual purchase settings, in contrast, yields forecast errors of around 20%. This suggests that the external validity of the proposed method relies on a detailed, structural understanding of the behavioral process.
The rest of the chapter proceeds as follows. We continue in Section 2.2 with a review of the related literatures. In Section 2.3, we develop a theory model to illustrate the mechanism and to formulate testable predictions. We then present the field experiment in Section 2.4 and discuss model-free evidence of the theory in Section 2.5. In Section 2.6, we draw on the theory to develop and evaluate a method to estimate new product demand based on structural use of choice data from smaller realization probabilities. We conclude in Section 2.7 with discussions of future research.
2.2
Literature Review
Researchers have long been exploring ways to estimate product demand, or equiva-lently, consumers' product valuation. The most reliable way to estimate demand is to use actual sales data or test market data (Silk and Urban 1978). These types of data have high external validity because they are observed in real purchase settings. However, actual sales data is not available for new products prior to launch, whereas test market data is costly to obtain. Even in the 1970s, the cost of test marketing could surpass one million US dollars. Furthermore, test marketing can be risky for
a firm as it allows competitors to obtain the firm's product information and respond
strategically.
As a result, researchers have developed pre-test-market methods, usually called laboratory or simulated test markets, in which recruited consumers are given the opportunity to buy in a simulated retail store (Silk and Urban 1978). Pre-test-market methods also have high external validity, because they provide a realistic purchase environment and consumers' choices are realized for certain (Silk and Urban 1978,
Urban and Katz 1983, Urban 1993). However, pre-test-market methods are still
costly - the company incurs not only the logistical costs of actual selling, but also the
opportunity cost of selling at potentially suboptimal prices. It can even be infeasible as the company may not have enough product samples to sell at the prelaunch stage.
A different approach to estimating product demand is to use hypothetical
sur-veys or hypothetical choice experiments. Marketing researchers have developed hypo-thetical choice-based conjoint analysis to measure consumers' tradeoffs among multi-attribute products (see Hauser and Rao 2004, Rao 2014 for an overview), and choice-based conjoint analysis can be augmented to estimate product valuation (e.g., Kohli and Mahajan 1991, Jedidi and Zhang 2002). Economists have used "contingent valu-ation methods" to estimate people's willingness-to-pay for public goods (Mitchell and Carson 1989), where participants are asked to either state their valuation directly (open-ended contingent evaluation) or to choose whether they are willing to purchase a good at a given price (dichotomous choice experiments).
These hypothetic methods ask participants to answer questions or make choices without actual consequences. As a result, these methods are riskless, low-cost, and widely applicable to concept testing. However, researchers have often found hypo-thetical methods unreliable. Both hypohypo-thetical open-ended contingent valuation and hypothetical choice experiments are found to over-estimate product valuation com-pared to actual purchases (Diamond and Hausman 1994, Cummings et al. 1995, Balistreri et al. 2001, Lusk and Schroeder 2004, Miller et al. 2011). This happens due to participants' lack of incentive to expend cognitive efforts needed to provide an accurate answer, ignorance of their budget constraints, or tendency to give socially
desirable answers in hypothetical settings (Camerer et al. 1999, Ding 2007).
A stream of literature tries to derive more reliable demand estimates using data
from hypothetic methods, but the results are mixed. One solution is to use "calibra-tion techniques" but the calibra"calibra-tion factors vary significantly and are specific to the product and the context (Blackburn et al. 1994, Fox et al. 1998, List and Shogren
1998, Murphy et al. 2005). Cummings and Taylor (1999) propose a "cheap-talk"
de-sign of questionnaire to reduce the hypothetical bias. List (2001) applies this dede-sign to a well-functioning marketplace that auctions off sports cards. He finds that the cheap-talk design mitigates the hypothetical bias, but only for inexperienced bidders. Another stream of research tries to overcome the hypothetic bias by making par-ticipants responsible for the consequences of their choices with a probability, called the "realization probability." Becker et al. (1964) design such a mechanism (hereafter BDM), where a participant is obliged to purchase a product if the price drawn from a lottery is less than or equal to her stated product valuation. The BDM mechanism has been widely used to elicit willingness-to-pay in behavioral decision experiments (e.g., Kahneman et al. 1990, Prelec and Simester 2001, Wang et al. 2007). Wertenbroch and Skiera (2002) compare BDM with hypothetical contingent valuation methods, and find that BDM yields lower willingness-to-pay.
Extending the BDM approach, Ding et al. (2005) and Ding (2007) design an incentive-aligned mechanism for conjoint analysis by replacing stated product valua-tion with inferred product valuavalua-tion from conjoint responses. Again, participants must adopt the product they chose with a realization probability. The authors show that incentive-aligned choice-based conjoint analysis outperforms its hypothet-ical counterpart in out-of-sample predictions of actual purchase behavior. Based on this idea, researchers have developed more-advanced incentive-aligned preference mea-surement methods (e.g., Park et al. 2008, Ding et al. 2009, Dong et al. 2010, Toubia et al. 2012), and confirm that incentive alignment leads to substantial improvement in predictive performance when compared to hypothetical methods.
However, whether incentive alignment can fully recover actual choices remains a question. Notably, Yang et al. (2015a) find that consumers become more price
sensi-tive as realization probability increases in incensensi-tive-aligned choice experiments. Our work reinforces this finding and shows that, indeed, incentive-aligned choice experi-ments may misrepresent demand in actual purchase settings, although they forecast demand more accurately compared with hypothetical approaches. We propose and empirically validate a theory of decision effort that can explain the bias in incentive-aligned choice experiments. Based on the theory, we develop a method to correct the bias in incentive-aligned experiments, which allows us to estimate the real demand curve in a cost-effective way.
Our decision effort mechanism emphasizes the idea that consumers need to incur a cost to learn their product valuation. Consumers are often uncertain about product performance and individual preferences (e.g., Urbany et al. 1989, Kahn and Meyer
1991, Ariely et al. 2003, Ofek et al. 2007, Wang et al. 2007). It is costly to evaluate
product features (e.g., Wernerfelt 1994, Villas-Boas 2009, Kuksov and Villas-Boas 2010) or to think through one's subjective preferences (e.g., Shugan 1980, Wathieu and Bertini 2007, Guo and Zhang 2012, Huang and Bronnenberg 2015, Guo 2016). In a recent paper, Kleinberg et al. (2017) show that the notion of costly valuation learn-ing has important implications for mechanism design; in particular, it renders the popular increasing-price auction ineffective. As a result of costly preference learning, consumers face an effort-accuracy tradeoff when making choices instead of maximizing decision accuracy as conventionally assumed (Hauser et al. 1993, Payne et al. 1993, Yang et al. 2015b). Wilcox (1993) shows that increased incentives raise subjects' willingness to incur decision effort and hence influence decision outcomes. Smith and Walker (1993) survey 31 experimental studies and find that higher rewards shift the experiment results towards the prediction of rational models. They also explain this result with effort theory - that is, higher rewards induce agents to exert more cogni-tive effort. Yang et al. (2015a) find that consumers' amount of attention to the choice problem increases with the scale of incentives as measured by the realization prob-ability. There is also evidence from neuroeconomics that, when choosing consumer goods, brain activation is stronger and more widespread in the real choice condition than in the hypothetical condition (Camerer and Mobbs 2017).
In this chapter, we further investigate the role of costly decision effort on consumer response in choice experiments, where consumers' effort incentive depends on the probability of their decisions being realized. This allows us to portray the structural relationship between realization probability and product demand. In the following session, we develop a theory model to describe this mechanism and to form testable predictions.
2.3
Theory Model
Consider a market with a unit mass of consumers. The true valuation of a new prod-uct, v, is heterogeneous across consumers, following a distribution
f(-)
unknown to the firm and consumers (otherwise there is no need for demand estimation). Consider a representative consumer i. She does not know her true product valuation vi ex ante. The mean of her prior belief about the true valuation is p0i, which can be decomposed as p1oi = vi + ej, where the perception error ej follows a distribution g(-). We assumethat g(.) is continuous and symmetric around 0, is the same across consumers, and that consumers know g(.) ex ante.
The consumer can expend a decision effort to learn about her true valuation of the product. If the consumer devotes effort t, she will know the true value of vi with probability t, and her belief about vi stays at poi with probability 1 - t. An example
of a choice context this formulation captures is a consumer's search of whether she already has a product in her possession that is a good substitute for the new product. Alternatively, we can model the decision effort as smoothly reducing a consumer's uncertainty about her true product valuation, but the qualitative insight of the theory model remains the same. We write the cost of effort as Ict2 to capture the idea
of increasing marginal cost. We assume that consumer i's utility from purchase is Uj = vi - p and the consumer has a reservation utility of zero. Thus consumer i will
purchase the product priced at p if and only if E[vi] > p, where E[vi] denotes the consumer's expected value of vi.
consumer observes the price p and the realization probability r. She is told that if she chooses "willing to buy," she will have to pay p and receive the product with probability r, and will pay nothing and not receive the product with probability 1- r. In the second stage, the consumer chooses the level of her decision effort, t. In the third stage, the consumer decides whether to choose "willing to buy" based on the outcome of her decision effort. If she is willing to buy, a lottery will be drawn and with probability r she will pay price p and receive the product as promised in stage one.
We first derive the optimal effort of the representative consumer. The consumer chooses effort t to maximize her expected net utility:
E[U(t, poj; p, r)] = r tE[(vi - p)+] + (1 - t)(po -) - ct2, (2.1)
where the expectation is taken over consumer i's prior perceived distribution of vi before she expends any decision effort.
The first-order condition of OE[U(t, poi; p, r)]/t = 0 yields the optimal effort level:
t*(Poi; p, r) = (E[(vi - P) _(oi _ (2.2)
c
The second-order condition is trivially satisfied for this optimization problem. We obtain the following comparative statics results.
Proposition 1 Suppose p-- poi is strictly within the support of g(-). The consumer's
optimal decision effort increases with realization probability r, and decreases with the distance between price and her prior belief of her valuation |p - poi|. A greater
realization probability amplifies the latter effect.
Proof: see the Appendix.
Intuitively, expending effort helps a consumer make a better informed purchase decision based on her true product valuation. The higher the realization probability, the higher the value of this effort. When realization probability equals 1, the consumer makes the same effort as in real purchase decisions. When realization probability
equals 0, choices become purely hypothetical with no impact on consumer utility, and the consumer makes no effort to learn her product valuation.3 Moreover, when product price is extremely low (or high), the consumer may trivially decide to buy (or not buy) regardless of her true valuation, which makes the decision effort unnecessary. On the other hand, when price is closer to a consumer's prior valuation, making a purchase decision based on the prior belief alone is more likely to lead to a mistake, and the consumer will want to expend more effort to discover her true valuation.
Knowing consumers' optimal effort decisions, we can derive the "manifested de-mand" for the product, i.e., the expected fraction of consumers who choose "willing to buy" given price p and realization probability r:
D(p, r) = fv e t*(vj+ej; p,r)1(vj 2! p)+(1- t*(vj+ej; p,r))1(vj+ej ! p)]g(ej)f(vj)dejdvj.
(2.3)
We emphasize the notion of manifested demand, as opposed to estimated demand, to highlight the theoretical effect of realization probability on consumer choices. In other words, even if consumers are behaving truthfully based on their expected product valuation and even if there is no empirical error, manifested demand may still differ from actual demand because consumer choices are not fully realized.
Now we investigate how realization probability affects the manifested demand curve. Let OD(p r) denote the local slope of the demand curve at price p, measuring
ap
consumers' price-sensitivity at price p. To facilitate presentation, we define the slope of the demand curve at the center of the true valuation distribution, ap,r)s
the "central" slope of the demand curve. The following proposition summarizes our finding.
Proposition 2 Suppose g(.) is symmetric around 0 and is weakly decreasing on
(0,oo). Suppose f(.) has a unique mode p, and is weakly increasing on (-oo, )
and weakly decreasing on ([pv, oc). Then the following results hold.
D(p, r) is weakly decreasing in the realization probability r when p > Aw, and is
weakly increasing in r when p < pr . Denote Z-(p) =
{z
> 0 : f (p+z)-f (p-z) < 0}, 3The consumer may choose randomly or be pro-social towards the experimentalist and chooseZ+(p) = {z > 0: f(p+z)-f(p-z) > 0}, and S. = {z > 0 : g(z) >
0}.
For p> Pv, if the (Lebesgue) measure of Z- (p) n Sg is greater than 0, then D(p, r) strictly decreases in r. For p < AV, if the (Lebesgue) measure of Z+(p) n S9 is greater than 0, thenD(p, r) strictly increases in r.
The central slope of the demand curve, defined as DP is weakly decreasing
in r. If Z(p,) = { z > 0 : f (,p+z)+f (pu-z) < 2f(v)}} has a non-empty intersection with the set of z where g(z) is strictly decreasing, then when r increases, the central slope of the demand curve strictly decreases, i.e., the demand curve becomes steeper.
Proof: see the Appendix.
It should be noted that many commonly seen distribution functions satisfy the conditions for the results in the above proposition to hold strictly. We illustrate this fact using normal and uniform distributions, respectively. In the first example, the true valuation vi follows a normal distribution N(p,, o) and the perception error follows a normal distribution N(0, uo). Hence the perception error distribution g(.) is always positive, so that Sg = (0, oc). When p > p, the true valuation distribution
f(.)
is strictly decreasing, which implies Z-(p) = (0, oo). When p < A,f(-)
is strictly increasing, so that Z+(p) = (0, oc). Therefore, the manifested demand D(p, r) strictly decreases with r for any p > M, and strictly increases with r for any p < pav. We also have Z(pv) = (0, oo), which is the same as the set of z where g(z) is strictly decreasing. Therefore, the central slope of the demand curve Dp,r) pg,, strictly decreases withr.
In the second example, the true valuation vi is uniformly distributed on [/I -u-,, put + a-] and the perception error is uniformly distributed on [-o,
co.
It followsthat Sg = (0, oo). When p > p, Z-(p) = (p - (p, + U)1, p - (V- o-)), so
manifested demand D(p, r) strictly decreases with r if and only if co > 1p - (AV + O%)1,
that is, if and only if M, + (9- - 07-) < p < pav + (u- + ou-). When p < p, Z+(p) =
(|(p' - 9V) - p1, (itv + o-v) - p), manifested demand D(p, r) strictly decreases with r if
and only if o > (pv--u) -pl,'that is, if and only if AV-(U-V+UO) < p < 1u -(UV-Uo).
r assuming
f(-)
and g(-) are both uniform distributions.4 We can see that the de-mand curve rotates at p = ,ut as realization probability changes. Specifically, demand increases with realization probability for any price below p, and decreases with real-ization probability for any price above /t. As realreal-ization probability increases, the demand curve becomes steeper, and consumers appear to be more price sensitive.2.4
Field Experiment
We run a field experiment to validate the prediction and the mechanism of the theory and to evaluate the proposed demand estimation method. We choose the field exper-iment approach to minimize threats to external validity such as the decision context. This allows us to identify the effect of realization probability on the external validity of demand estimation methods.
We collaborate with a top mobile platform of soccer games in China. Founded in 2013, the platform currently hosts 80,000 daily active users, generating 2 million
US dollars in monthly revenue. In the game, each user manages a soccer team and
the goal is to win as many times as possible. A team's likelihood of winning depends on the number of high-quality players it enlists. The new product we sell in the field experiment is a "lucky player package" that consists of six high-quality players. This player package had never been sold on the game platform prior to the experiment.
We want to randomize realization probability and price. We set four different realization probabilities: 0, 1/30, 1/2, and 1. The 0-probability group is designed to replicate hypothetical surveys, and the 1-probability group is meant to mirror the actual purchase setting. We add two interim realization probability groups because the proposed demand estimation method needs at least two realization probability levels for empirical identification and we choose only two for a conservative evaluation of the method's predictive power. We assign a 1/2-probability group to observe the effect of moderate realization probabilities. In addition, we create a 1/30-probability group because, in many experiments, the rule-of-thumb is to recruit 30 subjects per
condition. For future applications of the proposed demand estimation method using
30 subjects per condition, this realization probability can be more tangibly interpreted
as one out of the 30 subjects buying the product for real, which makes the experiment looks more trustworthy than using a smaller realization probability.
We set five price levels, measured as 1600, 2000, 2400, 2800, or 3200 "diamonds," which is the currency used in the game. Users need to pay real money to obtain diamonds. The exchange rate is about 1 US dollar for 100 diamonds. We discuss with the company to make sure this price range is reasonable and at the same time the gap between prices is large enough to elicit different purchase rates. The five price levels, combined with the four realization probabilities, lead to 20 conditions for the experiment. Once a user enters the experiment, she is randomly assigned to one of the conditions.
Each condition presents the user with a screen of the choice task. (Figure 2-3 presents the screen for the 1/30-probability group.) On this screen, we inform the user that she has a chance to purchase a lucky player package at price p and ask her to choose between "willing to purchase" and "not willing to purchase." For the 0-probability group, we inform the user that this is a hypothetic survey and no actual transaction will take place. For the 1-probability group, we notify the user that she has the chance to actually purchase the package. For the interim probability groups, we explain that if the user chooses "willing to purchase," a lottery will be drawn and there is probability r that she will actually receive the player package and will be charged the price p automatically. If the user chooses "not willing to purchase" or does not win the lottery, she will not receive the player package and will not be charged anything. Users can click on the player package and see the set of players contained therein (see Figure 2-4). They can also click on each player and see what skills the player has. After making the purchase decision, the user will be directed to a follow-up survey, which we designed to obtain auxiliary data to test the theory.
The experiment took place from 12AM, December 2, 2016 to 12PM, December 4, 2016. We randomly selected half of the platform's Android servers, and all users on these servers automatically entered the experiment once they accessed the game
during the period of the experiment. A total of 5,420 users entered the experiment,
271 in each condition. Among these users, 3,832 (70.7%) completed the choice task.
Among those who completed the choice task, 2,984 (77.87%) filled out the survey. Table 2.1 reports the number of users assigned to each probability and price group, and the number that completed the choice task or the survey. We notice higher completion rates in the 0-probability group. However, reassuringly, for all groups with positive realization probabilities, neither completing the choice task nor completing the survey is significantly correlated with the assigned realization probability (Corr =
-0.0163,p = 0.2993 and Corr = -0.0195,p = 0.3080, respectively) or the assigned
price level (Corr = 0.0023,p = 0.8660 and Corr = 0.0265,p = 0.1013, respectively).
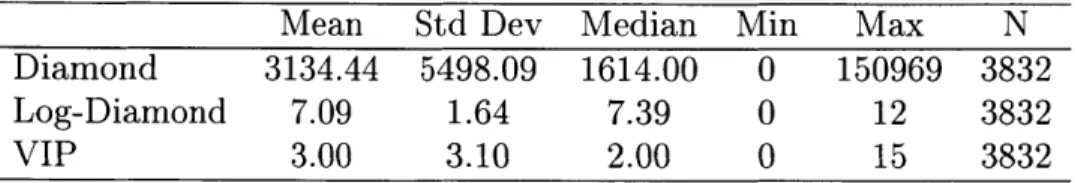
For each user who completed the choice task, we collect data on her characteristics at the time of the experiment, including the number of diamonds the user has (Dia-mond) and the VIP level of the user (VIP). The VIP level is determined by how much money the user has spent in the game. Table 2.2 presents the summary statistics. We can see that Diamond is a highly right-skewed variable, hence we convert it into a new variable Log-Diamond = log(Diamond
+
1) and will use this new measure insubsequent analysis.
2.5
Reduced-Form Evidence
In this section, we present reduced-form evidence of the theory prediction and of the decision effort mechanism, using data from the field experiment.
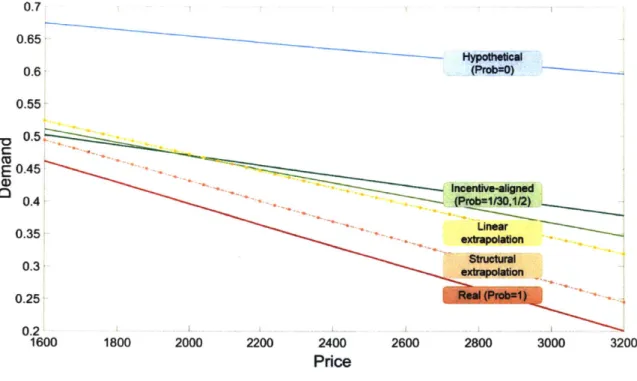
We first examine aggregate-level demand. By demand, we mean the proportion of users who chose "willing to purchase" out of those who completed the choice task in each condition. Figure 2-5 shows how aggregate-level demand changes with price under each realization probability. We see a pattern - as the realization probability increases, demand seems to decrease faster with price; in addition, the overall level of demand seems to decrease with realization probability.
To verify these observations, we fit a linear demand curve for each realization probability group by regressing individual-level purchase decisions on price. The
de-pendent variable Purchase equals 1 if the user chooses "willing to purchase" and 0 if the user chooses "not willing to purchase." For the ease of presentation, we normalize the five price levels to 4, 5, 6, 7, 8 respectively in this regression and subsequent
anal-ysis. Table 2.3 presents the estimated price coefficient and intercept of the demand curves. The slope of demand curve (absolute value of the price coefficient) increases with the realization probability, consistent with the prediction of our theory.
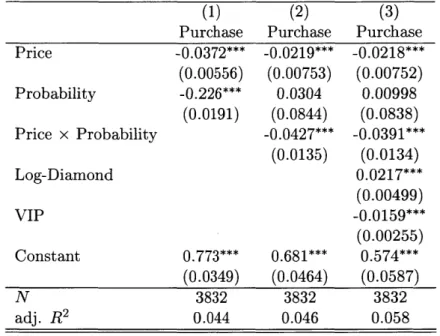
We further examine how individual-level purchase decisions are jointly influenced
by price and realization probability. Column (1) of Table 2.4 shows that the likelihood
of purchase decreases with price, as expected. It also decreases with realization prob-ability, an effect we will comment on later. In column (2), we add the interaction term of price and realization probability, and this interaction term has a significantly nega-tive coefficient. This means that users are more price sensinega-tive with higher realization probabilities, consistent with the theory prediction. In column (3), we further con-trol for user characteristics, namely, Log-Diamond and VIP. Having more diamonds and having lower VIP status are associated with higher purchase rates. Again, users become more price sensitive as realization probability increases.
A comment on the level of demand is in order. According to our theory model,
for any given price, the level of demand decreases with realization probability only when prices are higher than users' average product valuation. As a further test of the theory, in the post-choice survey we ask users to rate how they perceive the price of the product on a scale from 1 (very low) to 5 (very high). Indeed, the answers confirm that users view the price as relatively high; the mean answer is 3.99, significantly higher than the neutral level of 3 (t = 52.83, p < 0.001).
So far, data support our theory prediction that the demand curve becomes steeper as the realization probability increases. Next we examine whether the change in the slope of the demand curve is driven by the decision effort mechanism we propose. We need a measure of users' decision effort and examine how it changes with price and realization probability. Measuring decision effort is difficult (Bettman et al. 1990), and we try to do so using two measures. First, our experiment setting allows us to gauge how much a user has learned about the product. More specifically, in the
post-choice survey, we ask each user to answer "which of the following soccer players was not included in the player package."
If a user has carefully thought about her valuation of the player package,
pre-sumably she should know its content. We let the effort measure equal 1 if the user provides the correct answer (there is only one correct answer), and 0 otherwise. As a second proxy of decision effort, we draw upon the classic measure of decision time (Wilcox 1993). We record decision time as the number of seconds it takes from the point the user first arrives at the choice task page to the point she makes a choice. The decision time variable is highly right-skewed with some extremely large values, hence we take a log transformation of it for subsequent analysis. Table 2.5 reports the summary statistics of these effort measures.
As a direct mechanism test, we regress the two measures of decision effort on realization probability and price. Table 2.6 presents the result. For both measures of effort, users' effort input increases with realization probability, consistent with Proposition 1. Effort also decreases with price, although the effect is insignificant. The negative effect of price on effort echoes the survey result that users perceive the price of the player package as relatively high. As price increases from an already-high level, not to buy becomes a clearer decision regardless of a user's true product valuation, which makes effort less needed. This result is again consistent with Proposition 1.
2.6
Evaluating the Demand Estimation Method
In this section, we use data from the field experiment to evaluate the proposed demand estimation method. The core of the method is a structural model of consumer product choice based on the decision effort mechanism we propose. We estimate the structural model drawing on choice data from the 1/2-probability and 1/30-probability groups, leaving data from the 1-probability group as the holdout sample. We then use the structural estimates to forecast demand in actual purchase settings (i.e., settings where realization probability equals 1), and compare the forecast with demand in the holdout sample. To assess the value of having a theory-based model, we also compare
the structural forecast with simple extrapolation of demand from the 1/2-probability and 1/30 probability groups.
2.6.1
A Structural Model of Consumer Product Choice
The structural model captures the same behavioral process as the theory model of Section 2.3 but operationalizes it to match the empirical context. For a conservative evaluation of the proposed demand estimation method, we strive to keep the structural model parsimonious.
We let user i's true valuation of the product be
Vi = bo + biLog-Diamondi + b2VIPi + evi, (2.4)
where eri represents the unobserved heterogeneity in consumers' true product val-uation, which follows a normal distribution N(0, of). Recall that Log-Diamondi =
log(Diamondi + 1), where Diamondi is the number of diamonds user i has at the time of the experiment. VIP denotes the VIP level of user i at the time of the experiment, which is determined by how much this user has spent in the game. For the ease of interpreting the parameter estimates, we scale both Log-Diamond and VIP to [0, 11
by dividing each variable by its maximum value. We conjecture that a user with more
diamonds at hand is likely to have a higher willingness-to-pay for the product. The sign of VIP is a priori ambiguous. A user who has spent a lot may be more likely to spend on the new product out of habit, or less likely to spend because she already owns high-quality players contained in the player package.
User i's prior belief about her product valuation, puoi, follows the normal
distribu-tion N(vi, a 2), where the prior uncertainty aO is operationalized as
o = exp (ao + a1VIPi) . (2.5)
We use the exponential function here to guarantee that uo is positive. We expect VIP to have a negative coefficient because, other things being equal, more spending
arguably means greater experience with the game and hence less uncertainty about product valuation.
Knowing her prior mean valuation of the product poi and her prior uncertainty
o-0i, user i can derive her optimal level of effort in the same way as in the theory
model:
tj = min{i (1E [(vi - pi)+ _ ([toi _ i)+), 1} (2.6)
_ci
where the expectation is taken over consumer i's belief that vi ~ N(Poi, ok). pi and ri are the price and realization probability that user i is randomly assigned in the experiment. We restrict effort t2 to be no larger than 1 because it is defined as the
probability that the consumer will learn her true valuation (see Section 2.3). We further operationalize user i's effort cost ci as
ci = exp (c1 + c2eci) , (2.7)
where eci ~ N(O, 1). The exponential transformation guarantees that effort cost is positive. The ecj term allows effort cost to be heterogeneous among consumers.
Given her effort level ti, with probability ti, user i learns her true product valuation vi and should buy the product if vi > pi. With probability 1 - ti, user i retains her prior belief and should buy if [poi > pi. We assume that users have a response error
when making purchase decisions, and the response error follows i.i.d. standard Type
I extreme value distribution. It follows that user i's probability of choosing "willing
to buy" is given by the standard logit formula:
exp(Vi - As) exp(Poi - Pi)
Pr(Buyj = 1) = tI exp(vi - A + (1 - ti) exp(i (28)
1
+
exp(vj - pi) 1+
exp~ios -p
2
Y(28
The log-likelihood function of the observed purchase decision data isN
LL = 1(Buy = 1) log Pr(Buyi = 1) + 1(Buy = 0) log (1 - Pr(Buyi = 1))]. i=1
(2.9) The above formulation of the log-likelihood function does not rely on actual data