iScience, Volume
23
Supplemental Information
Structural Diversity with Varying Disorder
Enables the Multicolored Display
in the Longhorn Beetle
Sulawesiella rafaelae
Esteban Bermúdez-Ureña, Cédric Kilchoer, Nathan P. Lord, Ullrich Steiner, and Bodo D.
Wilts
Supplementary Figures
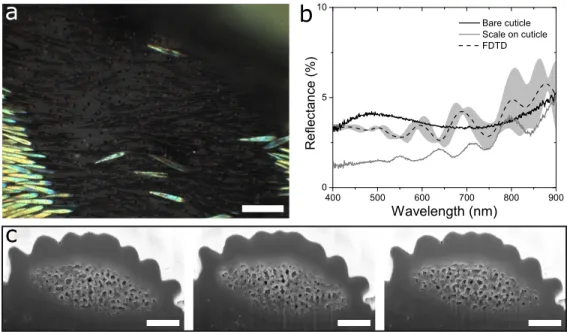
Figure S1. Structure and optics of black scales, related to Figure 1. a) Optical
micrograph of a black region. Black scales are sparsely covering a dark brown elytra. b) Reflectance spectra for the bare cuticle surface (black solid line) and a scale above the cuticle (grey solid line). The mean and standard deviation of 2D FDTD simulated reflection spectra are shown as a black dashed line and shaded grey area respectively. c) FIB-SEM cross-section images of the black scale that were implemented to simulate the reflection spectra. Scale bars: a) 100 µm, c) 1 µm.
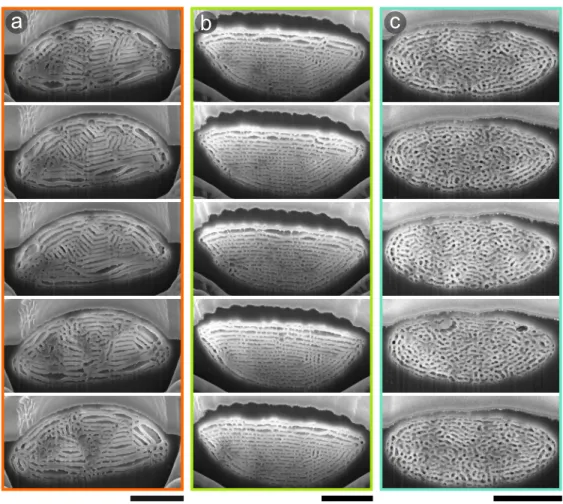
Figure S2. Sulawesiella rafaelae scale cross-sections, related to Figure 3. FIB-SEM cross-section images implemented in the FDTD simulations for the orange (a), yellow-green (b) and turquoise (c) colored scales. Scale bars: 3 µm
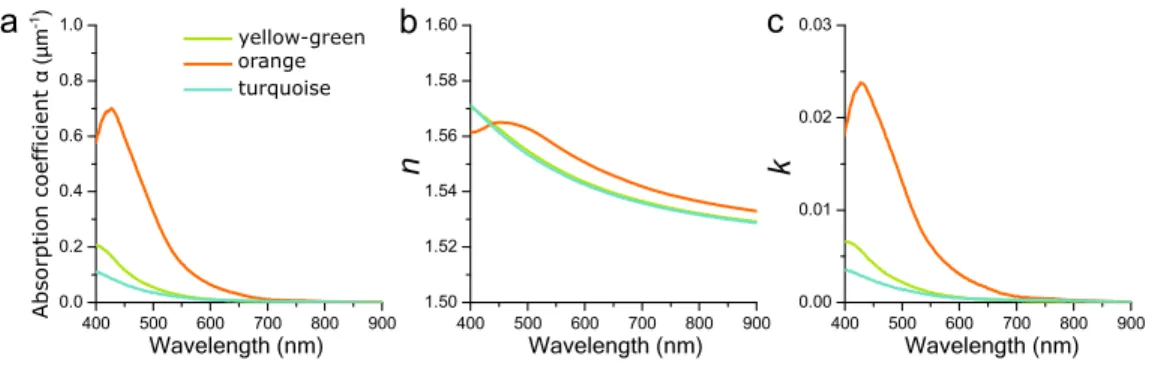
Figure S3. Absorption and refractive indices, related to Figure 4. a) Absorption coefficient 𝛼 for
orange, yellow-green, and turquoise colored scales derived from transmittance measurements of single wing scales immersed in refractive index-matching oil (see Transparent Methods). Real part (b) and imaginary part (c) of the refractive index 𝑛˜ = 𝑛 + 𝑖𝑘 for the orange, yellow-green, and turquoise colored scales used in the FDTD modelling derived from Kramers-Kronig relations of the spectra shown in panel a.
Transparent Methods
Specimen
Specimen (N=13) of Sulawesiella rafaelae (Landsberge, 1885; Coleoptera: Cerambycidae: Lamiinae: Tmesisternini, Latreille, 1829) were purchased from Bughouse.be and insect-sale.com. Optical characterization
Spectral characterization was performed using a xenon light source (Thorlabs SLS401; Thorlabs GmbH, Dachau, Germany) and a ZEISS Axio Scope.A1 microscope (Zeiss AG, Oberkochen, Germany) using an air objective (Zeiss Epiplan Apochromat 20x, NA 0.6). The light reflected from the sample was collected using an optical fibre (QP50-2-UV-BX, 50 µm core) with a measurement spot diameter ∼4 µm. The spectra were recorded by a spectrometer (Ocean Optics Maya2000 Pro; Ocean Optics, Dunedin, FL, USA). Optical micrographs were captured with a CCD camera (GS3-U3-28S5C-C, Point Grey/ FLIR Integrated Imaging Solutions Inc., Richmond, Canada). k-space measurements were performed by placing a Bertrand lens (Zeiss 453671) into the imaging pathway and by using a high numerical aperture air objective (Zeiss Epiplan Neofluar 100x, NA 0 .9). This allows the measurement of scattering angles up to ∼ 64◦. The
spectral measurements within the back focal plane image were recorded through an optical fiber (QP50-2-UV-BX). In all spectral measurements, a metallic mirror was used as a reference (Thorlabs PF10-03-P01).
Scale pigmentation
Isolated scales were immersed in a refractive-index matching fluid with a refractive index of 1.55 (Series A; Cargille Laboratories, Cedar Grove, USA). The absorbance of a scale was determined from a transmittance measurement via 𝐴 = − log(𝑇) and divided by the estimated effective solid thickness of the elytral scale (2.85 µm for green-yellow scales, 2.30 µm for orange scales and 2.05 µm for blue scales, estimated from FIB-SEM images). The refractive index dispersion spectra were calculated from the absorption coefficient by using Kramers-Kronig relations as detailed elsewhere (Wilts et al. 2017; Tianqi et al. 2020).
Ultrastructural analysis
Scales were detached from selected areas of the beetle and transferred to carbon adhesive discs glued onto standard SEM stubs (Plano-EM, Wetzlar, Germany). To prevent charging effects, a 5 nm gold layer was sputter coated on the samples (Cressington 208 HR, Cressington Scientific Instruments, Watford, England). Scale cross-sections were prepared and imaged using a FEI Scios 2 dual-beam scanning electron microscope equipped with a Ga+column and a field-emission
electron gun (FEI, Eindhoven, the Netherlands).
Structural analysis of the SEM cross-sectional images was performed using Fiji (Schindelin et al. 2012). The OrientationJ plug-in (http://bigwww.epfl.ch/demo/orientation/) was used for the layer orientation analysis, on the image-processed and binarized 2D cross-sections, using a local window of ∼30 nm and minimum coherency and energy values of 5%. FFT analysis was also performed using Fiji’s built-in FFT tool and structural length and mean layer thicknesses were extracted from the primary and secondary structural features of the FFT, respectively.
Optical modelling
Two-dimensional (2D) optical modelling was performed with a finite-difference time-domain (FDTD) method using commercial software (FDTD Solutions, v. 8.20; Lumerical Inc, Canada). We directly processed the cross-sections of Fig. 3, imported these as binary 2D profiles into our 2D FDTD simulation box and assigned calculated complex refractive index data for each type of scale (Fig. S3). For each colored scale, we averaged the simulated response of five different cross-sections extracted from the same scale within a ∼ 1 𝜇m length (Fig. S2). In the 2D FDTD simulation, we considered unpolarized plane-wave illumination (400 – 900 nm), perfectly matched layers for all boundaries, and a mesh size of 5 nm. The width of the FDTD region was set to 4 𝜇m, approximating the experimental collection spot size. Linear power monitors placed behind the source were used to collect the reflected power from the imported binary profiles.
In addition, we implemented an analytical transfer matrix method to model the optical response of idealized chitin/air multilayers (STACK solver, Lumerical Inc, Canada). In this method, for each of the three colored scales, we considered stacks of 15 chitin/air bilayers with randomly assigned thicknesses based on the mean and standard deviation values extracted from fast Fourier transform (FFT) analysis of SEM cross-sections. The presence of the enveloping cortex was also considered. For the material properties we used the same complex refractive index data as in the 2D FDTD simulations. The results in Figure 4 (dashed lines) correspond to the average over 100 iterations.
Supplementary References
Schindelin, J., Arganda-Carreras, I., Frise, E., Kaynig, V., Longair, M., Pietzsch, T., Preibisch, S., Rueden, C., Saalfeld, S., Schmid, B., et al. (2012) Fiji: an open-source platform for biological-image analysis. Nat. Methods. 9, 676–682.
Tianqi, S., Saba, M., Dufresne, E., Steiner, U., and Wilts, B. D. (2020) Designing Refrac-tive Index Fluids using the Kramers-Kronig Relations. Faraday Discuss., doi: 10.1039/ D0FD00027B.
Wilts, B. D., Wijnen, B., Leertouwer, H. L., Steiner, U., and Stavenga, D. G. (2017) Extreme refractive index wing scale beads containing dense pterin pigments cause the bright colors of pierid butterflies. Adv. Opt. Mater. 5, 1600879.