HAL Id: hal-01504602
https://hal.archives-ouvertes.fr/hal-01504602
Submitted on 10 Apr 2017HAL is a multi-disciplinary open access
archive for the deposit and dissemination of sci-entific research documents, whether they are pub-lished or not. The documents may come from teaching and research institutions in France or abroad, or from public or private research centers.
L’archive ouverte pluridisciplinaire HAL, est destinée au dépôt et à la diffusion de documents scientifiques de niveau recherche, publiés ou non, émanant des établissements d’enseignement et de recherche français ou étrangers, des laboratoires publics ou privés.
A gas aggregation source for the production of
heterogeneous molecular clusters
Isabelle Braud, Sébastien Zamith, Jean-Marc l’Hermite
To cite this version:
Isabelle Braud, Sébastien Zamith, Jean-Marc l’Hermite. A gas aggregation source for the production of heterogeneous molecular clusters. Review of Scientific Instruments, American Institute of Physics, 2017, 88 (4), pp.043102. �10.1063/1.4979639�. �hal-01504602�
A gas aggregation source for the production of heterogeneous molecular
clusters
I. Braud,
1,2)S. Zamith,
1,2)and J.-M. L’Hermite
1,2)1Université de Toulouse ; UPS ; Laboratoire collisions Agrégats Réactivité, IRSAMC ; F-31062 Toulouse, France 2
CNRS ; UMR 5589 ; F-31062 Toulouse, France
We present the design of a versatile gas aggregation source that allows producing molecular beams of charged clusters con-taining a controlled amount of chosen impurities. Several examples of clusters production using this source characterized by time of flight mass spectrometry are presented here. We demonstrate the source ability to produce homogeneous clusters, such as pure protonated water and alcohol clusters, as well as inhomogeneous ones such as water clusters containing a few units of uracil, glycine, sulfuric acid or pyrene.
I. INTRODUCTION
Clusters are assemblies of a few units up to several thousand atoms or molecules. Atomic clusters (rare gas, metallic) have long been studied and led to the discovery of geometric or electronic shell structures for instance1,2. One of the interests of studying clusters resides in the possibility to observe the size evolution of matter properties. It is then possible to study the emergence of macroscopic properties out of microscopic properties1–3.
Molecular clusters are interesting in several aspects. In atmospheric chemistry, water clusters and clusters containing atmospheric relevant molecules, such as ammonia or sulfuric acid, are of particular interest for nucleation of water droplets and ion induced chemistry in the atmosphere4–6. Hydrogenated aromatic polycyclic molecules (HAP) are also present in the atmosphere as a result of imperfect combustion of fuel in cars or domestic heating. Furthermore, grains formed from HAP and water are also expected to be of importance for the chemistry of interstellar medium7–9.
Doping water clusters enables to study the influence of solvation on molecular conformation or dissociation10. Nano-solvated molecules can thus be seen as prototypes for experimental and theoretical studies of biochemical processes, which generally take place in aqueous environment11.
It is therefore desirable to be able to produce molecular clusters containing impurities or mixed clusters, and more spe-cifically hydrogen bonded clusters such as water clusters. A wide variety of sources were developed since the early 1980s in order to produce clusters1–3,12. Clusters have been produced using seeded supersonic nozzle sources13,14, gas-aggregation sources15–17, laser vaporization sources18, ion sputtering sources19, liquid-metal ion sources20 or electrospray21. Among these devices, gas aggregation sources have been widely and successfully used for the production of large clusters22. Originally
2
designed for the production of metallic clusters16, it has since also been used to produce molecular clusters23,24.The success of the gas aggregation source comes from its great simplicity of operation, the ease of production of charged species and, as will be demonstrated with our design, its versatility. Moreover, they are used advantageously whenever one wants to thermal-ize the clusters just after their production: a second cooling stage attached directly to the source benefits from the already present buffer gas therefore available for thermalization. Furthermore the ability of these sources to produce charged clusters prior to thermalization is also an advantage when one is interested in mass selecting the clusters while preserving the control over their temperature, such as in nanocalorimetry experiments25–28.
The principle of operation of this type of cluster source is rather simple: an overheated vapor condenses in a cold at-mosphere created by a buffer gas. The source itself usually consists in a chamber whose walls are refrigerated with water or liquid nitrogen. Inside this chamber a crucible allows one to vaporize the condensable material from which clusters are to be formed. A buffer gas, usually a rare gas, is introduced in the chamber. This buffer gas is cooled by collisions with the wall of the chamber and creates the cold supersaturated environment necessary for the vapor to undergo nucleation. Clusters are formed and exit the source transported by the buffer gas stream, thus producing a continuous cluster beam.
Clusters can be ionized in situ by using the crucible as a cathode for creating a discharge in the source. A voltage ap-plied to the crucible is generally sufficient to create a discharge in this type of source owing to the relatively high pressure in the source (typically 1 mbar).
We present here a gas aggregation source that has been initially optimized for the production of water clusters. This source is also well suited for the production of alcohol clusters and virtually any molecular species with a sufficiently high vapor pressure. Atomic or molecular clusters are generated by nucleation of their supersaturated vapor that can be either injected in the source from outside, seeded in an inert carrier gas, or produced by heating a crucible embedded in the source, which contains the liquid or solid condensable element; using these two possibilities simultaneously allows us producing mixed clusters. One innovative feature of our source is its special ability to produce a variety of mixed clusters of compo-nents that have an extended range of vapor pressures. This will be demonstrated with the production of mixed clusters con-taining both water molecules and either sulfuric acid, glycine, uracil, or HAP. These mixed clusters (H2O)pXq are produced
over a rather extended size range and with controlled stoichiometry.
The manuscript is organized as follows: in the next section the source design is described in details. The next two sec-tions will be devoted to the demonstration of the source ability in producing various clusters, pure (section III) and containing impurities (section IV). The last section will draw conclusions.
3
II. DESCRIPTION OF THE SOURCE
A schematic of the gas aggregation source is presented in FIG. 1(a). The source consists in a cylindrical double wall stainless steel chamber that is placed under vacuum. This chamber has an inner diameter of 10 cm and is 18 cm long. Liquid nitrogen is circulated in the double wall in order to cool down the source.
Outside the source a glass reservoir contains the liquid material from which clusters are to be formed. The temperature of this reservoir can be controlled in order to adjust the vapor pressure.
A 6mm external diameter, 4mm internal diameter stainless steel tube goes through the back wall of the source. This tube is used to bring into the source the carrier gas, helium, seeded with the condensable vapor from which clusters will be formed. The amount of condensable vapor is adjusted with the help of a needle valve above the reservoir and connected to the helium pipe. Inside the source, the tube is connected to a 50mm long and 30mm inner diameter oven. It is made of stain-less steel due to its corrosion resistance to a broad range of chemicals, such as sulfuric acid . The exit hole of this oven is 4 mm in diameter. The tube that brings in the carrier gas and the condensable vapor is heated, at typically 20°C, so that no condensation nor freezing can occur in the tube. Finally the source is closed by an aluminum cover extended by a 20 mm inner diameter cylinder, 6.5 cm long, that is connected to the thermalization chamber. Sealing of the source is done with indium wires. The exit hole diameter of the source is generally 7 mm. The choice of aluminum for this part is motivated by the good thermal conductivity of aluminum compared to stainless steel.
4
FIG. 1: (a) Schematic of the gas aggregation source. (b) Zoomed view of the oven in the source with the attached minia-ture electron gun which is used to ionize the clusters. The aluminum housing of the tungsten filament is 20mm high and has a 16 mm external diameter (12mm inner diameter).
A coaxial heating element allows to control the oven temperature in the source Toven , which can be varied from -150°C
up to 150°C. Temperatures are measured in the source at three different places. One measure is done close to the back wall of the source, with a platinum resistance thermometer. Another platinum resistance thermometer records the temperature at the end of the cylindrical extension, at the source exit. Under typical operation conditions, the temperatures recorded in the source are -120°C at the back of the source and -180°C at the end of the source. The third temperature is measured in the oven with a type T thermocouple and regulated with the help of a proportional–integral–derivative controller. The oven tem-perature is usually kept between -20°C and +20°C when pure hydrogen bonded clusters are produced. For the production of water clusters containing impurities, depending on the nature of the impurity, the oven has to be heated up to 120°C in order to have a sufficiently high vapor pressure of the material of interest.
In order to ionize the clusters, a discharge can be produced inside the oven by applying a voltage to a small stainless steel ring electrode placed 5 mm towards the oven entrance. Typical voltages applied range from 300 to 900 V, leading to discharge current on the order of few tens of µA to several hundreds of µA. Alternatively, a miniature electron gun depicted in FIG. 1(b) placed just outside the oven can be used for clusters ionization. It consists in a filament mounted on a ceramic plate, usually used for electron microscopy (Kimball ES-020), and housed in small aluminum cylinder. Typical working current and voltage are I=2.7A and V=-100V, respectively.
5
Inside the oven is placed, if desired, the material to be added to the condensable element injected with the carrier gas. So far we have tested sulfuric acid, glycine, uracil and pyrene onto water. Varying the oven temperature also allows controlling the stoichiometry of the mixed clusters produced.
The helium flow into the source is usually on the order of 5 mbar.l.s-1 (extreme values go from 2 to 7 mbar.l.s-1), leading to a pressure inside the source on the order of 1 mbar. The helium flow is controlled by a mass flow controller (Tylan 2900).
Condensation occurs spontaneously in the cold source environment. Although the principle of operation of this source is quite simple, we cannot provide a clear detailed understanding of the nucleation processes at play in this source. However, we can still observe the influence of the various source parameters, such as helium flow, condensable vapor amount, oven temperature, discharge current, exit hole diameter on the cluster production and more specifically on the size distribution obtained from the source.
After the source, the clusters enter a thermalization chamber. It consists in a 20 cm long, 2 cm inner diameter copper piece, which is attached to a closed-cycle helium cryostat whose temperature is controlled within 1 K and can be varied from 25 K to 340 K. Thermalization of the clusters is assumed through collisions with the helium carrier gas. Efficient thermaliza-tion is insured by the large amount of collisions (of the order of 105) between clusters and carrier gas atoms29. In most of the results presented here the cluster temperature is at 25 K. The ion current exiting the thermalization chamber has been meas-ured by collecting the ions onto a +/-30V biased metal plate. The currents measmeas-ured are of the order of few tens of nA (which corresponds to about 1011 ions/s), both for positively and negatively charged clusters.
Time of flight mass spectrometry is used to characterize the size distribution of the ionized clusters produced in the source. Cluster size distribution can be varied by adjusting the source parameters. Obviously, the amount of condensable vapor introduced in the helium flow plays a direct role: the more vapor is introduced, the bigger the clusters. Another im-portant parameter is the helium flow: large flows tend to reduce the residence time of the clusters in the source and favor the production of smaller sizes. Conversely, small flows tend to increase the residence time and thus produce bigger sizes. We have also noticed the influence of the oven temperature and discharge intensity on the size distribution, although the origin of these influences are quite unclear. Higher oven temperatures favor the production of smaller clusters. Similarly intense dis-charges favor as well small cluster production.
Using this various parameters, one can quite easily tune the size distribution, going from size distribution centered around a few units up to few hundred molecules per cluster.
6
In the following we will first give some examples of the influence of source parameters for the production of water ters. We will then give several example of clusters production for different species, going from pure hydrogen bonded clus-ters (methanol, ethanol, pyrene) to water clusclus-ters containing impurities (sulfuric acid, glycin, uracil, pyrene).
III. PRODUCTION OF PURE HYDROGEN BONDED CLUSTERS
A. Water clusters
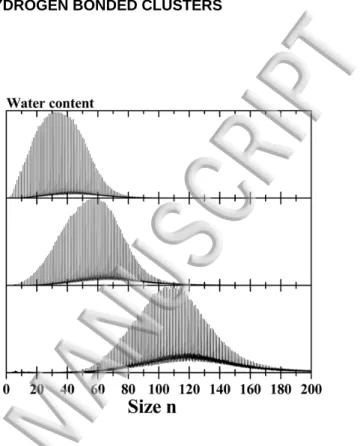
FIG. 2: Evolution of the TOF-MS of protonated water clusters as the amount of water introduced in the source is in-creased, from top to bottom.
In order to produce water clusters, the reservoir outside the source is filled with 99.99% H216O (Sigma Aldrich). We use
isotopically enriched water in order to limit the number of isotopic peaks in the mass spectra, in particular those due to the presence of 18O isotope whose abundance is far from negligible in large clusters: in (H2O)100 natural water clusters for
in-stance, the probability to find one 18O atom is about 20%. This reservoir being at room temperature, the vapor pressure of water inside is about 20 mbar. The amount of water introduced in the helium flow is regulated with the help of a needle valve. FIG. 2 presents the influence of the variation of the amount of water on the size distribution of protonated water cluster (H2O)nH+. As the needle valve above the water reservoir is opened more, the quantity of water entering the helium flow is
increased. More water is then available in the source for the production of clusters, and bigger sizes are formed. As illustrated in FIG. 2, the size distribution can be easily varied from a distribution centered around n=30 to n=110.
7
We have estimated the water flow used to produce water clusters to be of the order of 1.3 10-4 mol/min (0.053 mbar.l.s-1). For a typical helium flow of 5 mbar.l.s-1, we have thus about 1% water in helium entering the source.
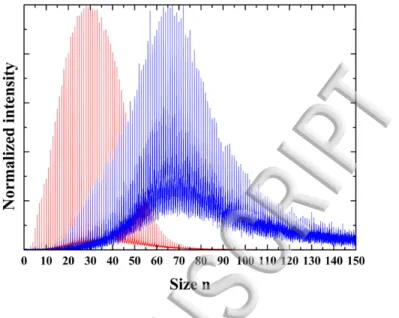
FIG. 3: TOF-MS showing the size distribution obtained with the same source conditions for protonated water clusters (red) and deprotonated water clusters (blue).
Charged water clusters are produced in our gas aggregation source under protonated (H2O)nH+ and deprotonated
(H2O)n-1OH- form. Both species are produced simultaneously by the discharge taking place in the oven. Under the same
source conditions, the size distribution obtained for negatively charged clusters are centered around bigger sizes as shown in FIG. 3 which gives an example of two TOF-MS recorded for the exact same source conditions for deprotonated and proto-nated water clusters. The protoproto-nated clusters size distribution is centered around n=25 whereas it is centered around n=70 for the deprotonated ones. The TOF-MS have been normalized by dividing by the maximum intensity in FIG. 3 and the time acquisition is the same. One can clearly see that the noise level is much better for protonated water clusters. Although the ion current measured at the exit of the thermalization chamber is of the same order for positively and negatively charged clusters, we have always noticed that the transmission in the TOF mass spectrometer for the negatively charged clusters is poorer than the one of the positively charged. We have traced back the origin of this phenomenon to a different transmission through the skimmer placed in between the source chamber and the high vacuum part containing the TOF-mass spectrometer. Negatively charged species are more likely to release their excess electron than positively charged ones are expected to catch an electron from the skimmer. The electrons released by anions contribute to build up electrostatic charging of the skimmer and neigh-boring surfaces and thus alter the transmission of ions.
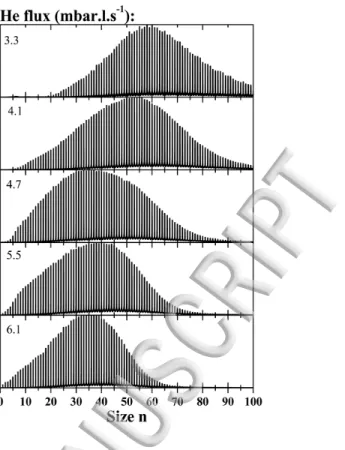
FIG. 4 shows the effect of helium flow on the size distribution of clusters. The discharge current is kept constant at 300µA. As the helium flow is increased, the voltage required for the same discharge current diminishes from 900 to 540V.
8
Increasing the helium flow favors the production of smaller clusters. This tendency can be explained by the fact that the resi-dence time in the growing region in the source is diminished as the gas flow is increased.
These few examples have shown how the source parameters can influence the water clusters size distribution. We have at hand more parameters to influence the cluster production. As already mentioned one can as well vary the discharge intensi-ty, the oven temperature or change the exit diameter of the source.
To summarize, we report here our observations about the influence of these various parameters:
- Helium flow : Increasing the helium flow favors the production of small clusters. As a side effect, for a given voltage on the electrode in the oven, this increases the discharge current and the source temperature.
- Discharge current : Increasing the discharge current favors the production of small clusters.
- Amount of water : Increasing the amount of water introduced in the helium flow favors the production of big clusters. Side effect: for a given voltage the discharge current increases.
- Oven temperature : Increasing the oven temperature favors the production of small clusters. Side effect : discharge current diminishes, source temperature rises.
- Exit diameter : bigger diameters favors the production of small clusters.
As can be seen, varying a source parameter often led to a change in the others. This mutual dependence of the source parameters makes it sometimes tricky to operate. Nevertheless, we have found the operation of the source reliable enough to perform complicated and lengthy experiments. Furthermore, once a set of parameters have been found to obtain the desired size distribution, the same size distribution can be obtained from day to day using the same parameters.
9
FIG. 4 Evolution with the helium flow of the TOF-MS for protonated water clusters. As the helium flow is increased, from top to bottom, the size distribution shifts towards small sizes.
B. Alcohol clusters
For the production of alcohol clusters we have simply replaced the water in the reservoir by methanol or ethanol. We used 99% pure alcohols. However, this purity is not high enough to get rid of impurities in clusters mass spectra, and in order to reduce the water content observed in the mass spectra, molecular sieves are placed together with the alcohols in the reser-voir.
Alcohol vapor pressure is much higher than water vapor pressure. In order to obtain the required alcohol flow - which is comparable to the required water flow - the needle valve should be very slightly opened, which would drastically reduce the precision of flow control. Cooling down alcohol reduces its vapor pressure, allowing to operate at a larger valve opening and thus to increase its precision. The reservoir was typically cooled down to 5°C for both alcohols. FIG. 5 and 6 give examples of mass spectra obtained with ethanol and methanol. We can see on these mass spectra that despite the efforts to reduce the water content, one can still clearly see alcohol clusters containing water, especially for ethanol. In the case of methanol one can also see a peak at +14 amu from the pure methanol clusters that could originate from ethanol contamination. For both alcohols, the positively charged clusters have an excess proton.
10
For alcohols, we have noticed that the discharge created in the oven was not optimal: indeed, after few hours, the amount of clusters tends to diminish. We noticed that the oven interior and the electrode used for the discharge were covered by a black powder. For alcohols, the discharge may create some cracking reactions inside the oven. To circumvent this issue, we used instead for the ionization of the clusters the miniature electron gun.
FIG. 5: TOF-MS of protonated ethanol clusters. (a) Whole size distribution. (b) Zoom on the size distribution showing ethanol clusters containing one water molecule. The peaks structure is due to the presence of isotopes.
FIG. 6: TOF-MS of protonated methanol clusters. (a) Whole size distribution. (b) Zoom on the size distribution. The peaks structure is due to the presence of isotopes.
11
V. PRODUCTION OF WATER CLUSTERS CONTAINING IMPURITIES A. Sulfuric acid
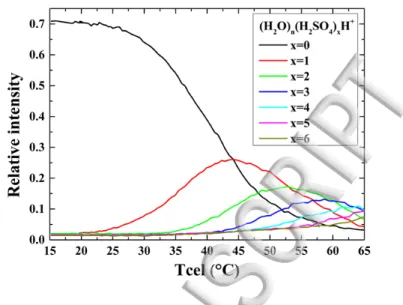
FIG. 7: Evolution of the population of clusters as the temperature of the oven is increased. At low temperature only pure protonated water clusters are observed. At the highest temperature, water clusters containing up to 6 sulfuric acid molecules are observed.
Sulfuric acid has a quite low vapor pressure at room temperature, namely about 3.10-5 mbar at 20°C. In order to produce water clusters containing one or more sulfuric acid molecules, 99.99% pure sulfuric acid is put in the oven in the source. A few ml of sulfuric acid is deposited in a small Teflon tank placed in the oven. Once the optimal conditions are achieved for the production of water clusters in the desired size range, the oven temperature is increased until the appearance of water clusters containing sulfuric acid. As the temperature increases, small peaks of (H2O)n(H2SO4)H+ first appear. At 50°C, the
vapor pressure of sulfuric acid is about 5 10-4 mbar. At this oven temperature, the peak intensity of (H2O)n-1(H2SO4)H+ and
(H2O)nH+ become comparable. As the temperature further increases, the amount of pure water clusters diminishes as more
and more clusters are produced with one or more sulfuric acid molecules. This is illustrated in FIG. 7 where the amount of pure water clusters and of water clusters containing from one up to 6 sulfuric acid molecules is plotted as a function of the oven temperature. At a given cell temperature, the population of clusters plotted as a function of the number of sulfuric acid molecules follows a poissonian distribution. This suggests that the mixed clusters are formed by successive attachment of the sulfuric acid molecules on preexisting water clusters. In FIG. 8
(
a) is displayed a time of flight mass spectrum where the dis-tributions of pure water clusters and water clusters containing up to 3 sulfuric acid molecules are highlighted. The maximum12
of the different distributions are shifted due to the much higher mass of the sulfuric acid molecule, about 98 amu, compared to the one of water, about 18 amu.
FIG. 8: TOF-MS of protonated water clusters doped with sulfuric acid. The oven temperature in the source is 50°C. (a) The size distributions for different clusters composition, from pure water clusters to water clusters containing up to 3 sulfuric acid molecules, are highlighted. (b) A closer look at the TOF-MS shows the different clusters species.
In FIG. 8(b), we take a closer look at the TOF-MS, around the n=37 water cluster. We can clearly distinguish the differ-ent species and assign unambiguously the clusters as being of the type (H2O)n(H2SO4)xH+ : clusters are always produced with
an excess proton carrying the charge. For the most intense peak, (H2O)32(H232SO4)H+ in this part of the TOF-MS, we also
observe small peaks at +1 and +2 amu. These peaks originate from the isotopes in H2SO4, in particular the isotope 34S which
has a relative abundance of 4.5%.
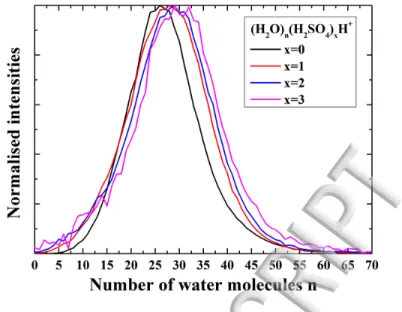
The size distributions of the different clusters species have been extracted from the TOF-MS presented in FIG. 8(a). In FIG. 9
,
these size distributions are normalized and plotted as a function of the number of water molecules in the clusters. The size distributions of water clusters containing sulfuric acid closely follow the one of pure water clusters: everything happens as if sulfuric acid molecules attaches to already formed water clusters. This is consistent with the above mentioned poissoni-an distribution of the clusters as a function of the number of sulfuric acid molecules. However, one cpoissoni-an observe a slight shift of the size distribution as the number of acid molecules increase, together with an increase in width towards the bigger sizes. Nevertheless these effects remain quite small and thus the adjunction of sulfuric acid does not deeply perturb water clusters production.13
FIG. 9: Normalized size distributions extracted from the peaks area in FIG. 8: TOF-MS of protonated water clusters doped with sulfuric acid. The oven temperature in the source is 50°C. (a) The size distributions for different clusters compo-sition, from pure water clusters to water clusters containing up to 3 sulfuric acid molecules, are highlighted.
B. Uracil
In order to produce protonated water clusters containing uracil C4H4N2O2 (U), uracil powder is introduced in the oven.
In FIG. 10 we show a TOF-MS showing the production of water clusters containing up to 3 uracil molecules. The source was here operated so that quite small clusters were produced. The oven was heated to 120°C and even with such a high tempera-ture, the source is still able to produce water clusters. The size distribution is centered around n=13 for the protonated water clusters. Under these conditions we are able to see both the bare ionized uracil molecule U+ and its protonated from UH+. For the solvated uracil, the main species are in the protonated form (H2O)n(U)xH+.
14
C. Glycine
Protonated water clusters have been produced with glycine powder introduced in the oven. The TOF-MS presented in FIG. 11 has been obtained with an oven temperature of 105°C. At this temperature we can clearly observe clusters containing up to three glycine molecules. The main prominent peaks correspond to clusters in the protonated form, that is (H2O)n(Gly)xH+.
As one can see from FIG. 11b the mass spectrum is quite rich, with peaks appearing every 1 amu. This might be due to the discharge taking place in the oven that fragments the glycine molecule.
The fact that the magic numbers at n=21 and n=28 for protonated water clusters are so clearly visible comes from the fact that these data were recorded with a relatively high thermalizer temperature of 168K.
15
D. Pyrene
FIG. 12: (a) TOF-MS of pure pyrene clusters. (b) Detail of the peak structure around n=2.
Pyrene powder ( 98% pure, Sigma-Aldrich) is placed in the oven which is heated up to 80°C. We were able to produce pure pyrene clusters over an extended size range as shown in FIG. 12. It is then possible to introduce a little amount of water to produce pyrene clusters with few units of water. It is also possible to start with pure water clusters and by heating progres-sively the oven, as for sulfuric acid, glycine or uracil, one produces water clusters with an increasing number of pyrene mole-cules.
In the case of the production of pure pyrene clusters, it can be difficult to have a stable discharge in the oven. We have once again tested successfully the miniature electron gun presented above to ionize the clusters. Alternatively, we can intro-duce a minute quantity of water so that a discharge takes place. The amount of water introintro-duced is so small that the presence of water in the mass spectrum is hardly noticeable.
FIG. 12(b) presents details of the peak corresponding to (Py)2+. Multiple peaks separated by 1 amu are present. The
main peak is due to (Py)2+. Peaks at +1 amu and +2amu mainly come from the isotopic abundance. We cannot exclude
com-pletely the production of pyrene clusters in the protonated form (Py)2H+. The peaks at -1 and -2 amu correspond to the loss of
16
V. CONCLUSION
We have demonstrated the ability of our source design to produce easily pure hydrogen bonded molecular clusters (wa-ter, ethanol, methanol). Hydrogen bonded charged clusters are produced with both positive and negative polarity, essentially in their protonated or deprotonated forms, respectively. Other species can be produced as well as demonstrated with pyrene clusters.
Our source is well suited for the production of clusters containing a controlled amount of selected impurities. These im-purities can have very different vapor pressures from the molecules forming the clusters. The cluster size distributions ob-tained with this source can be tuned easily and extend over a broad range, from a few units up to tens or even hundreds of molecules, which is of particular interest when the size evolution of clusters properties is investigated.
We have demonstrated that atmospheric or biological relevant molecules can be added to water clusters.
This source has been effectively used to carry experiment on size selected clusters, for instance we have measured the at-tachment cross-section of molecules onto ethanol and methanol clusters30, we have studied the collision induced fragmenta-tion of solvated uracil31 and ongoing experiments are performed to measure the evaporation rate of size selected pyrene clus-ters.
ACKNOWLEDGMENTS
The authors thank warmly Laurent Polizzi, Michel Gianesin and Daniel Castex for their technical support in the design and construction of the cluster source.
This work has been partly funded by the Agence Nationale de la Recherche (ANR) under Grant No. ANR 2011-BS04-028-01.
17
1H. Haberland (Ed.), Clusters of Atoms and Molecules (Springer Series of Chemical Physics, 1994).
2
W.A. de Heer, Rev Mod Phys 65, 611 (1993).
3 K.D. Sattler (Ed.), Handbook of Nanophysics: Clusters and Fullerenes, CRC Press (2010).
4
A. Hirsikko, T. Nieminen, S. Gagné, K. Lehtipalo, H.E. Manninen, M. Ehn, U. Hõrrak, V.-M. Kerminen, L. Laakso, P.H. McMurry, A. Mirme, S. Mirme, T. Petäjä, H. Tammet, V. Vakkari, M. Vana, and M. Kulmala, Atmospheric Chem. Phys. 11, 767 (2011).
5
K.D. Froyd and E.R. Lovejoy, J. Phys. Chem. A 107, 9800 (2003).
6
A.W. Castleman, Jr. and I.N. Tang, J Chem Phys 57, 3629 (1972).
7
A.G.G.M. Tielens, Annu. Rev. Astron. Astrophys. 46, 289 (2008).
8
M. Rapacioli, C. Joblin, and P. Boissel, Astron. Astrophys. 429, 193 (2005).
9
A. Simon and F. Spiegelman, J. Chem. Phys. 138, 194309 (2013).
10
S. Wei, W.B. Tzeng, R.G. Keesee, and A.W. Castleman, J. Am. Chem. Soc. 113, 1960 (1991).
11
M.S. de Vries and P. Hobza, Annu. Rev. Phys. Chem. 58, 585 (2007).
12
J.E. Campana, Mass Spectrom. Rev. 6, 395 (1987).
13
O.F. Hagena, Rev. Sci. Instrum. 63, 2374 (1992).
14
M. Förstel, M. Neustetter, S. Denifl, F. Lelievre, and U. Hergenhahn, Rev. Sci. Instrum. 86, 073103 (2015).
15
K.M. McHugh, H.W. Sarkas, J.G. Eaton, C.R. Westgate, and K.H. Bowen, Z. Für Phys. At. Mol. Clust. 12, 3 (1989).
16
K. Sattler, J. Mühlbach, and E. Recknagel, Phys Rev Lett 45, 821 (1980).
17
H. Schaber and T.P. Martin, Surf. Sci. 156, 64 (1985).
18
M.A. Duncan, Rev. Sci. Instrum. 83, 041101 (2012).
19
W. Begemann, K.H. Meiwes-Broer, and H.O. Lutz, J. Phys. Colloq. 50, C2 (1989).
20
N.D. Bhaskar, R.P. Frueholz, C.M. Klimcak, and R.A. Cook, Phys. Rev. B 36, 4418 (1987).
21
C.K. Meng and J.B. Fenn, Org. Mass Spectrom. 26, 542 (1991). 22 H. Haberland, M. Karrais, and M. Mall, Z. Phys. D 20, 413 (1991).
23
M. Schmidt, A. Masson, and C. Bréchignac, Int. J. Mass Spectrom. 252, 173 (2006).
24
A. Domaracka, M. Capron, S. Maclot, J.-Y. Chesnel, A. Méry, J.-C. Poully, J. Rangama, L. Adoui, P. Rousseau, and B.A. Huber, J. Phys. Conf. Ser. 373, 012005 (2012).
25
M. Schmidt, T. Hippler, J. Donges, W. Kronmüller, B. von Issendorff, H. Haberland, and P. Labastie, Phys Rev Lett 87, 203402 (2001).
26
M. Schmidt and B. von Issendorff, J Chem Phys 136, 164307 (2012).
27
C. Hock, M. Schmidt, R. Kuhnen, C. Bartels, L. Ma, H. Haberland, and B. v.Issendorff, Phys Rev Lett 103, 073401 (2009).
28
J. Boulon, I. Braud, S. Zamith, P. Labastie, and J.-M. L’Hermite, J. Chem. Phys. 140, 164305 (2014).
29
S. Zamith, P. Feiden, P. Labastie, and J.-M. L’Hermite, J Chem Phys 133, 154305 (2010).
30
I. Braud, J. Boulon, S. Zamith, and J.-M. L’Hermite, J. Phys. Chem. A 119, 6017 (2015).
31
W a t e r c o n t e n t
0 2 0 4 0 6 0 8 0 1 0 0 1 2 0 1 4 0 1 6 0 1 8 0 2 0 0
0 1 0 2 0 3 0 4 0 5 0 6 0 7 0 8 0 9 0 1 0 0 1 1 0 1 2 0 1 3 0 1 4 0 1 5 0 N o r m a li z e d i n te n si ty S i z e n
4 . 1 4 . 7 5 . 5 0 1 0 2 0 3 0 4 0 5 0 6 0 7 0 8 0 9 0 1 0 0 6 . 1 3 . 3 S i z e n H e f l u x ( m b a r . l . s - 1) :
5 1 0 1 5 2 0 2 5 3 0 3 5 N o rm a li ze d i n te n si ty S i z e n
( a )
9 2 0 9 3 0 9 4 0 9 5 0 9 6 0 9 7 0( b )
( C 2H 6O )2 0( H 2O ) H + ( C 2H 6O )2 1H + m a s s ( a . m . u . ) ( C 2H 6O )2 0H +0 1 0 2 0 3 0 4 0 5 0 6 0 7 0 8 0 N o rm a li ze d i n te n si ty S i z e n
( a )
6 4 0 6 5 0 6 6 0 6 7 0 6 8 0 ( C H 4O )2 0( H2O ) H +( b )
( C H 4O )2 0H + + 1 4 a m u ( C H 4O )2 1H + m a s s ( a . m . u . ) ( C H 4O )2 0H +1 5 2 0 2 5 3 0 3 5 4 0 4 5 5 0 5 5 6 0 6 5 0 . 0 0 . 1 0 . 2 0 . 3 0 . 4 0 . 5 0 . 6 0 . 7 ( H 2O )n( H 2S O 4)xH + x = 0 x = 1 x = 2 x = 3 x = 4 x = 5 x = 6
R
el
a
ti
v
e
in
te
n
si
ty
T c e l ( ° C )
0 2 5 0 5 0 0 7 5 0 1 0 0 0 6 6 8 6 7 0 6 7 2 6 7 4 6 7 6 6 7 8 6 8 0 6 8 2 6 8 4 6 8 6 6 8 8 6 9 0
( b )
( H 2O )n( H 2S O 4)xH + x = 0 x = 1 x = 2 x = 3 N o rm a li ze d i n te n si ty m a s s ( a . m . u . )( a )
( H 2O )2 7( H 2S O 4)2H + ( H 2O )3 8H + ( H 2O )2 1( H 2S O 4)3H + ( H 2O )3 2( H 2 3 2S O 4) H + ( H 2O )3 7H + m a s s ( a . m . u . )0 5 1 0 1 5 2 0 2 5 3 0 3 5 4 0 4 5 5 0 5 5 6 0 6 5 7 0
N
o
rm
a
li
se
d
i
n
te
n
si
ti
es
N u m b e r o f w a t e r m o l e c u l e s n
( H 2O )n( H 2S O 4)xH + x = 0 x = 1 x = 2 x = 30 2 5 0 5 0 0 7 5 0 1 0 5 1 1 0 1 1 5 1 2 0 1 2 5 1 3 0 1 3 5 ( H 2O )n( U )xH + x = 0 x = 1 x = 2 x = 3 N o r m a li z e i n te n si ty m a s s ( a . m . u . )
( a )
( b )
U + ( H 2O )6H + ( H 2O )7H + U ( H 2O ) H + m a s s ( a . m . u . ) U H +0 2 0 0 4 0 0 6 0 0 8 0 0 1 0 0 0 1 2 0 0 1 4 0 0 5 4 0 5 4 5 5 5 0 5 5 5 5 6 0 ( H 2O )n( G l y )xH + x = 0 x = 1 x = 2 x = 3 N o rm a li ze d i n te n si ty m a s s ( a . m . u . )
( a )
( b )
( H 2O )2 2( G l y )2H + ( H2O )3 1H + ( H2O )2 6G l y H + m a s s ( a . m . u . ) ( H 2O )3 0H +0 2 0 0 0 4 0 0 0 6 0 0 0 8 0 0 0 3 9 0 4 0 0 4 1 0 ( P y )n N o r m a li z e i n te n si ty m a s s ( a . m . u . )