Control of Cell Identity Genes Occurs in Insulated
Neighborhoods in Mammalian Chromosomes
The MIT Faculty has made this article openly available.
Please share
how this access benefits you. Your story matters.
Citation
Dowen, Jill M. et al. “Control of Cell Identity Genes Occurs in
Insulated Neighborhoods in Mammalian Chromosomes.” Cell 159.2
(2014): 374–387.
As Published
http://dx.doi.org/10.1016/j.cell.2014.09.030
Publisher
Elsevier
Version
Author's final manuscript
Citable link
http://hdl.handle.net/1721.1/105841
Terms of Use
Creative Commons Attribution-NonCommercial-NoDerivs License
Control of cell identity genes occurs in insulated neighborhoods
in mammalian chromosomes
Jill M. Dowen#1, Zi Peng Fan#1,2, Denes Hnisz#1, Gang Ren#3,4, Brian J. Abraham1, Lyndon
N. Zhang1,5, Abraham S. Weintraub1,5, Jurian Schujiers1, Tong Ihn Lee1, Keji Zhao3, and Richard A. Young1,5
1 Whitehead Institute for Biomedical Research, 9 Cambridge Center, Cambridge, MA 02142 2 Computational and Systems Biology Program
3 Systems Biology Center, NHLBI, National Institutes of Health, 9000 Rockville Pike, Bethesda,
MD 20892, USA.
4 College of Animal Science and Technology, Northwest A&F University, Xi'An, P. R. China 5 Department of Biology, Massachusetts Institute of Technology, Cambridge, MA, 02139 # These authors contributed equally to this work.
SUMMARY
The pluripotent state of embryonic stem cells (ESCs) is produced by active transcription of genes that control cell identity and repression of genes encoding lineage-specifying developmental regulators. Here we use ESC cohesin ChIAPET data to identify the local chromosomal structures at both active and repressed genes across the genome. The results produce a map of enhancer-promoter interactions and reveal that super-enhancer driven genes generally occur within chromosome structures that are formed by the looping of two interacting CTCF sites co-occupied by cohesin. These looped structures form insulated neighborhoods whose integrity is important for proper expression of local genes. We also find that repressed genes encoding lineage-specifying developmental regulators occur within insulated neighborhoods. These results provide new
© 2014 Elsevier Inc. All rights reserved.
Corresponding Authors: Richard A. Young Whitehead Institute for Biomedical Research 9 Cambridge Center Cambridge, MA 02142 Tel: (617) 258-5218 Fax: (617) 258-0376 Keji Zhao National Heart, Lung, and Blood Institute, NIH Building 10, 10 Center Dr Bethesda, MD 20892 Tel: (301) 498-2098 Fax: (301) 480-0961.
Publisher's Disclaimer: This is a PDF file of an unedited manuscript that has been accepted for publication. As a service to our
customers we are providing this early version of the manuscript. The manuscript will undergo copyediting, typesetting, and review of the resulting proof before it is published in its final citable form. Please note that during the production process errors may be discovered which could affect the content, and all legal disclaimers that apply to the journal pertain.
AUTHOR CONTRIBUTIONS
J.M.D and G.R. performed ChIA-PET. Z.F.P performed ChIA-PET data analysis with help from L.N.Z. Genome-wide computational analyses were performed by Z.F.P., B.J.A. and L.N.Z. D.H and A.S.W. designed and performed genome editing experiments. D.H., A.S.W. and J.S. performed gene expression analyses. G.R. performed 3C experiments. T.I.L and K.Z. contributed to the conceptual development of the study. J.M.D., Z.P.F, D.H and R.A.Y wrote the paper. All authors edited the manuscript.
ACCESSION NUMBERS
Raw and processed sequencing data were deposited in GEO under accession number GSE57913 (www.ncbi.nlm.nih.gov/geo/). SUPPLEMENTAL INFORMATION
NIH Public Access
Author Manuscript
Cell. Author manuscript; available in PMC 2015 October 09. Published in final edited form as:
Cell. 2014 October 9; 159(2): 374–387. doi:10.1016/j.cell.2014.09.030.
NIH-PA Author Manuscript
NIH-PA Author Manuscript
insights into the relationship between transcriptional control of cell identity genes and control of local chromosome structure.
INTRODUCTION
Embryonic stem cells depend on active transcription of genes that play prominent roles in pluripotency (ES cell identity genes) and on repression of genes encoding lineage-specifying developmental regulators (Ng and Surani, 2011; Orkin and Hochedlinger, 2011; Young, 2011). The master transcription factors (TFs) OCT4, SOX2 and NANOG (OSN) form super-enhancers at most cell identity genes, including those encoding the master TFs themselves; these super-enhancers contain exceptional levels of transcription apparatus and drive high-level expression of associated genes (Hnisz et al., 2013; Whyte et al., 2013). Maintenance of the pluripotent ESC state also requires that genes encoding lineage-specifying developmental regulators remain repressed, as expression of these genes can stimulate differentiation and thus loss of ESC identity. These repressed lineage-specifying genes are occupied by Polycomb group proteins in ESCs (Boyer et al., 2006; Lee et al., 2006; Margueron and Reinberg, 2011; Squazzo et al., 2006). The ability to express or repress these key genes in a precise and sustainable fashion is thus essential to maintaining ESC identity.
Recent pioneering studies of mammalian chromosome structure have suggested that they are organized into a hierarchy of units, which include Topologically Associating Domains (TADs) and gene loops (Figure 1A)(Dixon et al., 2012; Filippova et al., 2014; Gibcus and Dekker, 2013; Naumova et al., 2013; Nora et al., 2012). TADs, also known as Topological Domains, are defined by DNA-DNA interaction frequencies, and their boundaries are regions across which relatively few DNA-DNA interactions occur (Dixon et al., 2012; Nora et al., 2012). TADs average 0.8 Mb, contain approximately 7 protein-coding genes and have boundaries that are shared by the different cell types of an organism (Dixon et al., 2012; Smallwood and Ren, 2013). The expression of genes within a TAD is somewhat correlated, and thus some TADs tend to have active genes and others tend to have repressed genes (Cavalli and Misteli, 2013; Gibcus and Dekker, 2013; Nora et al., 2012).
Gene loops and other structures within TADs are thought to reflect the activities of transcription factors (TFs), cohesin and CTCF (Baranello et al., 2014; Gorkin et al., 2014; Phillips-Cremins et al., 2013; Seitan et al., 2013; Zuin et al., 2014). The structures within TADs include cohesin-associated enhancer-promoter loops that are produced when enhancer-bound TFs bind cofactors such as Mediator that, in turn, bind RNA polymerase II at promoter sites (Lee and Young, 2013; Lelli et al., 2012; Roeder, 2005; Spitz and Furlong, 2012). The cohesin-loading factor NIPBL binds Mediator and loads cohesin at these
enhancer-promoter loops (Kagey et al., 2010). Cohesin also becomes associated with CTCF-bound regions of the genome and some of these cohesin-associated CTCF sites facilitate gene activation while others may function as insulators (Dixon et al., 2012; Parelho et al., 2008; Phillips-Cremins and Corces, 2013; Seitan et al., 2013; Wendt et al., 2008). The chromosome structures anchored by Mediator and cohesin are thought to be mostly cell-type-specific, whereas those anchored by CTCF and cohesin tend to be larger and shared by
NIH-PA Author Manuscript
NIH-PA Author Manuscript
most cell types (Phillips-Cremins et al., 2013; Seitan et al., 2013). Despite this picture of cohesin-associated enhancer-promoter loops and cohesin-associated CTCF loops, we do not yet understand the relationship between the transcriptional control of cell identity and the sub-TAD structures of chromosomes that may contribute to this control. Furthermore, there is limited evidence that that the integrity of sub-TAD structures is important for normal expression of genes located in the vicinity of these structures.
To gain insights into the cohesin-associated chromosome structures that may contribute to the control of pluripotency in ESCs, we generated a large cohesin ChIA-PET dataset and integrated this with other genome-wide data to identify local structures across the genome. The results show that super-enhancer driven cell identity genes and repressed genes
encoding lineage-specifying developmental regulators occur within insulated neighborhoods formed by the looping of two CTCF interaction sites occupied by cohesin. Perturbation of these structures demonstrates that their integrity is important for normal expression of genes located in the vicinity of the neighborhoods.
RESULTS
Cohesin ChIA-PET in ESCs
The organization of mammalian chromosomes involves structural units with various sizes and properties, and cohesin, a Structural Maintenance of Chromosomes (SMC) complex, participates in DNA interactions that include enhancer-promoter loops and larger loop structures that occur within Topologically Associating Domains (TADs) (Figure 1A). ESC ChIP-seq data indicate that ~40% of cohesin-occupied sites involve active enhancers and promoters, ~3% involve genes with Polycomb modifications, and ~50% involve CTCF sites that are not associated with enhancers, promoters or Polycomb-occupied sites (Figure 1B, S1A, S1B). We employed cohesin ChIA-PET to further investigate the relationship between control of the ESC pluripotency program and control of local chromosome structure. We selected cohesin because it is a relatively well-studied SMC complex that is loaded at enhancer-promoter loops, and can thus identify those interactions, and can also migrate to CTCF sites and thus identify those interactions as well (Kagey et al., 2010; Parelho et al., 2008; Rubio et al., 2008; Schaaf et al., 2013; Wendt et al., 2008). The ChIA-PET technique was used because it yields high-resolution (~4kb) genome-wide interaction data, which is important because most loops involved in transcriptional regulation are between 1 and 100kb (Gibcus and Dekker, 2013). We hoped to extend previous findings that mapped interactions among regulatory elements across portions of the ESC genome (Denholtz et al., 2013; Phillips-Cremins et al., 2013; Seitan et al., 2013) and gain a detailed understanding of the relationship between transcriptional control of ESC identity genes and control of local chromosome structure.
To identify interactions between cohesin-occupied sites, we generated biological replicates of SMC1 ChIA-PET datasets in ESCs totaling ~400 million reads (Table S1A). The two biological replicates showed a high degree of correlation (Pearson's r > 0.91, Figure S1C, S1D), so we pooled the replicate data and processed it using an established protocol (Li et al., 2010), with modifications described in Extended Experimental Procedures (Figure S1, Table S1A). The dataset contained ~19 million unique paired-end tags (PETs) that were
NIH-PA Author Manuscript
NIH-PA Author Manuscript
used to identify PET peaks (Figure 1C). Interactions between PET peaks were identified and filtered for length and significance (Figure 1C, S1E, S1F, Table S1B, Extended
Experimental Procedures). The analysis method produced 1,234,006 cohesin-associated DNA interactions (Figure1C, Table S1B). The vast majority (92%) of these interacting cohesin-occupied sites occurred at enhancers, promoters and CTCF binding sites, consistent with the known roles of cohesin at these regulatory elements (Figure 1D). Genomic data of any type is noisy, and our confidence in the interpretation of DNA interaction data is improved by identifying PETs that represent independent events in the sample and pass statistical significance tests. For this reason, we generated a high-confidence interaction (FDR ≤ 0.01) dataset by requiring that at least three independent PETs support the identified interaction between two PET peaks. The high-confidence dataset consisted of 23,835 interactions that were almost entirely intrachromosomal (99%), and included 2,921
enhancer-promoter interactions, 2,700 enhancer-enhancer interactions and 7,841 interactions between nonenhancer, non-promoter CTCF sites (Figure 1C, 1D, S1G, S2, Table S1B). Unless stated otherwise, the high-confidence dataset was used for further quantitative analysis.
We used the interaction datasets to create a table of enhancer-promoter assignments for ESCs (Table S2A-C). We found that the interaction data supported 83% of super-enhancer assignments to the proximal active gene and 87% of typical enhancer assignments to the proximal active gene (Table S2B, C), with approximately half of the remainder were assigned to the second most proximal gene. The interaction data most frequently assigned super-enhancers and typical enhancers to a single gene, with 76% of super-enhancers and 84% of typical enhancers showing evidence of interaction with a single gene. Prior studies have suggested there can be more frequent interactions between enhancers and genes (Kieffer-Kwon et al., 2013; Sanyal et al., 2012; Shen et al., 2012); our high-confidence data is not saturating and does not address the upper limits of these interactions (Figure S1H, Extended Experimental Procedures). The catalogue of enhancer-promoter assignments provided by these interaction data should prove useful for future studies of the roles of ESC enhancers and their associated factors in control of specific target genes.
The majority of cohesin ChIA-PET interactions did not cross the boundaries of previously defined TADs (Dixon et al., 2012; Filippova et al., 2014; Meuleman et al., 2013; Wen et al., 2009)(Figure 2, Table S3A). Figure 2A shows a representative example of a TAD, where the majority (96%) of interactions occur within the domain. As expected from previous studies, the TAD boundaries are enriched for cohesin and CTCF and thus cohesin ChIA-PET peaks (Figure 2B). Genome-wide analysis shows that 88% of all interactions are contained within TADs (Figure 2C) and are somewhat enriched near the boundaries of TADs (Figure 2D). The majority of cohesin ChIA-PET interactions did not cross lamin-associated domains (LADs), which are associated with repression at the nuclear periphery, or LOCK domains, which are large regions of chromatin marked with histone H3K9 modifications (Table S3A) (Meuleman et al., 2013; Wen et al., 2009). These results are consistent with properties previously described for TAD, LAD and LOCK domain structures.
NIH-PA Author Manuscript
NIH-PA Author Manuscript
Super-enhancer Domain Structure
Super-enhancers drive expression of key cell identity genes and are densely occupied by the transcription apparatus and its cofactors, including cohesin (Dowen et al., 2013; Hnisz et al., 2013). Analysis of high-confidence cohesin ChIA-PET interaction data revealed a striking feature common to loci containing super-enhancers and their associated genes (Figure 3). This feature consisted of a super-enhancer and its associated gene located within a loop connected by two interacting CTCF sites co-occupied by cohesin (Figure 3A, 3B, Figure S3A-J). The vast majority of ESC super-enhancers (84%) are contained within these structures, which we call Super-enhancer Domains (SDs) (Figure 3B; Table S4A, B, Extended Experimental Procedures). In contrast, only 48% of typical enhancers were found to occur within comparable loops between two CTCF sites.
The 197 SDs average 106 kb and most frequently contain 1 or 2 genes (Table S4A, C). It was evident that there were cohesin-associated interactions between individual enhancer elements (constituents) of super-enhancers as well as interactions between super-enhancers and the promoters of their associated genes (Figure S3A-J). Indeed, the results suggest that super-enhancer constituents have cohesin-associated interactions with one another (345 interactions) even more frequently than they do with their associated genes (216 interactions).
The SDs contain high densities of pluripotency transcription factors, Mediator and cohesin, together with histone modifications associated with transcriptionally active enhancers and genes (Figure 3C). It was notable that the majority (82%) of interactions within SDs do not cross the CTCF sites at SD borders (Figure 3D) and that the majority of Mediator, Pol2 and H3K27ac signal associated with super-enhancers and their associated genes occurs inside of the CTCF sites at SD borders (Figure 3E). The cohesin ChIA-PET interaction data and the distribution of the transcription apparatus suggest that the interacting cohesin-occupied CTCF sites tend to restrict the interactions of super-enhancers to those genes within the SD.
Super-enhancer Domain Function
Because super-enhancers contain an exceptional amount of transcription apparatus and CTCF has been associated with insulator activity (Essafi et al., 2011; Handoko et al., 2011; Ong and Corces, 2014; Phillips and Corces, 2009; Phillips-Cremins and Corces, 2013), we postulated that SD structures might be necessary for proper regulation of genes in the vicinity of these structures. To test this model, we investigated the effect of deleting SD boundary CTCF sites on expression of genes inside and immediately outside of SDs (Figure 4). For this purpose, we studied five SDs whose super-enhancer associated genes play key roles in embryonic stem cell biology (miR-290-295, Nanog, Tdgf1, Pou5f1 (Oct4), and Prdm14). In all cases, we found that deletion of a CTCF site led to altered expression of nearby genes. In 4/5 cases, deletion of a CTCF site led to increased expression of genes immediately outside the SDs and in 3/5 cases, deletion of a CTCF site caused changes in expression of genes within the SDs.
The miR-290-295 locus, which specifies miRNAs with roles in ESC biology, is located within an SD (Figure 4A). The miR-290-295 SD contains no other annotated gene and the
NIH-PA Author Manuscript
NIH-PA Author Manuscript
closest gene that resides outside this SD is Nlrp12, located ~20kb downstream of
miR-290-295. CRISPR-mediated deletion of a boundary CTCF site (C1) at the miR-290-295
locus caused a ~50% reduction in the miR-290-295 pri-miRNA transcript and an 8-fold increase in transcript levels for Nlrp12 (Figure 4A). The CTCF deletion had no effect on expression of two genes located further away, AU018091 and Myadm (Figure 4A). These results indicate that normal expression of the miR-290-295 pri-miRNA transcript is dependent on the CTCF boundary site and furthermore, that genes located immediately outside of this SD can be activated when the SD CTCF boundary site is disrupted.
The Nanog gene, which encodes a key pluripotency transcription factor, is located within an SD shown in Figure 4B. The Nanog SD contains no other annotated gene and the closest upstream gene that resides outside this SD is Dppa3, which is located ~50kb upstream of
Nanog. CRISPR-mediated deletion of the boundary CTCF site C1 of the Nanog SD led to a
~40% drop in Nanog transcript levels (Figure 4B). In this case, there was no significant change in the level of the Dppa3 transcript (Figure 4B). These results indicate that normal expression of the Nanog transcript is dependent on the C1 CTCF site.
The Tdgf1 gene, which encodes an epidermal growth factor essential for embryonic development, is located within an SD (Figure 4C). In this SD, it is possible that the super-enhancer regulates both the Tdgf1 and Lrrc2 genes and this Tdgf1/Lrrc2 SD also contains the Rtp3 gene. The closest gene that resides outside this SD is Gm590, which is located ~30kb downstream of Tdgf1. CRISPR-mediated deletion of a boundary CTCF site (C1) of the Tdgf1/Lrrc2 SD had little effect on Tdgf1 and Rtp3 transcript levels, but had a modest effect on Lrrc2 transcript levels and caused a nearly 10-fold increase in the levels of Gm590 transcripts (Figure 4C).
The Pou5f1 gene, which encodes pluripotency transcription factor OCT4, is located within an SD (Figure 4D). The Pou5f1 SD contains no other annotated gene. We were not able to obtain a bi-allelic CRISPR-mediated deletion of a boundary CTCF site, despite multiple attempts, but did obtain a mono-allelic deletion of the boundary CTCF site C1 (Figure 4D). This mono-allelic deletion had little effect on the levels of Pou5f1 transcripts, but increased the levels of transcripts for H2-Q10, the gene closest to the deleted boundary, by ~2.5-fold (Figure 4D). Transcription of the gene closest to the uninterrupted boundary of the Pou5f1 SD, Tcf19, was unaffected by the C1 deletion.
The Prdm14 gene, which encodes a pluripotency transcription factor, is located within an SD (Figure 4E). The Prdm14 SD contains no other annotated gene and the closest downstream gene that resides outside this SD is Slco5a1, which is located ~100kb downstream of Prdm14. The Prdm14 SD has two neighboring cohesin-associated CTCF sites at one boundary; CRISPR-mediated deletion of a single boundary CTCF site (C1) had no effect on expression of Prdm14 or Slco5a1, but deletion of both CTCF sites (C1 and C2) at that boundary caused a 3.5-fold increase in expression of Slco5a1 (Figure 4E).
We tested whether the super-enhancers from disrupted SD structures show increased interaction frequencies with the newly activated genes outside the SD by using 3C. At two loci where loss of an SD boundary CTCF site led to significant activation of the gene
NIH-PA Author Manuscript
NIH-PA Author Manuscript
outside the SD (miR-290-295 and Pou5f1) we performed quantitative 3C experiments to measure the contact frequency between the super-enhancers and the genes immediately outside of SDs in wild type cells and in cells where the SD boundary CTCF site was deleted. In both cases, loss of the CTCF site led to an increase in the contact frequency between the super-enhancers and the genes immediately outside of SDs that were newly activated (Figure S4A, S4B).
We investigated whether altered SD boundaries that affect cell identity genes cause ESCs to express markers consistent with an altered cell state. Indeed, we found that ESCs lacking the
miR-290-295 boundary CTCF site C1 exhibit increased expression of the ectodermal marker Pax6 and decreased expression of the endodermal lineage markers Gata6 and Sox17,
suggesting that loss of the SD structure is sufficient to affect cell identity (Figure S4C). Previous studies have shown that miR-290-295 null ESCs show an increased propensity to differentiate into ectodermal lineages at the expense of endoderm (Kaspi et al., 2013). In summary, the loss of CTCF sites at the boundaries of SDs can cause a change in the level of transcripts for super-enhancer associated genes within the SD and frequently leads to activation of genes near these CTCF sites. These results indicate that the integrity of SDs is important for normal expression of genes located in the vicinity of the SD, which can include genes that are key to control of cell identity.
Polycomb Domains
Maintenance of the pluripotent ESC state requires that genes encoding lineage-specifying developmental regulators are repressed, and these repressed lineage-specifying genes are occupied by nucleosomal histones that carry the Polycomb-associated mark H3K27me3 (Margueron and Reinberg, 2011; Young, 2011). The mechanisms responsible for
maintaining the H3K27me3 mark across short spans of regulatory regions and promoters of repressed genes are not well understood, although CTCF sites have been implicated (Cuddapah et al., 2009; Schwartz et al., 2012; Van Bortle et al., 2012). Analysis of the H3K27me3-marked genes revealed that they, like the super-enhancer-associated genes, are typically located within a loop between two interacting CTCF sites co-occupied by cohesin (Figure 5A, 5B, Figure S5A-J, Table S5A). These Polycomb Domain (PD) structures share many features with the Super-enhancer Domains. The majority (70%) (380/546) of Polycomb-associated genes occur in PD structures. PDs average 112 kb and generally contain 1 or 2 genes (Table S5B). The PDs contain exceptionally high densities of the Polycomb proteins EZH2, SUZ12 and the associated histone modification H3K27me3 (Figure 5C). The majority (78%) of cohesin ChIA-PET interactions originating in PDs occur within the PD boundaries (Figure 5D). Furthermore, the Polycomb mark H3K27me3 tends to be retained within the PD (Figure 5E).
We postulated that the CTCF boundaries that form PD structures might be important for repression of the Polycomb-marked genes within the PD, and investigated the effect of deleting boundary CTCF sites on a PD containing Tcfap2e to test this idea (Figure 5F). CRISPR-mediated deletion of one of the boundary CTCF sites (C1) of the Tcfap2e PD caused a 1.7 fold increase in transcript levels for Tcfap2e (P-value < 0.05) and no significant change in transcript levels for nearby genes within or outside of the PD. CRISPR-mediated
NIH-PA Author Manuscript
NIH-PA Author Manuscript
deletion of the other boundary CTCF site (C2) caused a 4-fold increase in the expression of
Tcfap2e (P-value < 0.001) and little effect on adjacent genes. These results suggest that the
integrity of the CTCF boundaries of PDs is important for full repression of H3K27me3-occupied genes.
Insulated Neighborhoods in Multiple Cell Types
A previous study suggested that DNA loops mediated by cohesin and CTCF tend to be larger and more shared among multiple cell types than DNA loops associated with cohesin and Mediator, which represent enhancer-promoter interactions that may be cell-type specific (Phillips-Cremins et al., 2013). This led us to postulate that 1) the interacting CTCF
structures of SDs and PDs may be common to multiple cell types, and 2) the acquisition of super-enhancers and Polycomb binding within these common domain structures will vary based on the gene expression program of the cell type (Figure 6A).
To test this model, we compared the SDs identified in ESCs to comparable regions in neural precursor cells (NPCs) where 5C interaction data was available for specific loci (Phillips-Cremins et al., 2013). We found, for example, that the Nanog locus SD observed in ESCs with ChIA-PET data was also detected by 5C data in NPCs (Figure 6B). In NPCs, the
Nanog gene is not expressed and no super-enhancers are formed at this locus (Figure 6B).
Similarly, there is evidence for a common structure involving CTCF sites bounding the
Olig1/Olig2 locus in both ESCs and NPCs (Figure 6B). In this domain, the Olig1/Olig2
genes are not active and no super-enhancers are formed in ESCs, whereas there are three super-enhancers in NPCs, where these genes are highly expressed (Figure 6B, S6A). For regions where 5C interaction data in NPCs and ChIA-PET interaction data in ESCs could be compared, a total of 11 out of 32 interactions between CTCF sites identified in NPCs were supported by interaction data in ESCs (Table S3B), which is impressive given the sparsity of interaction data. This supports the view that the interacting CTCF structures of ESC SDs may be common to multiple cell types.
If the CTCF boundaries of ESC SDs and PDs are common to many cell types, we would expect that the binding of CTCF to the SD and PD boundary sites observed in ESCs will be conserved across multiple cell types. To test this notion, we examined CTCF ChIP-seq peaks from 18 mouse cell types and determined how frequently CTCF binding occurred across these cell types (Figure 6C). When all ESC CTCF ChIP-seq peaks were included in the analysis, we found that there was fairly even distribution of the data into bins
representing one or more cell types (Figure 6C). In contrast, CTCF peaks co-bound by cohesin, which included those at SD and PD borders were observed more frequently in bins representing a larger fraction of the cell types (Figure 6C; Figure S6B). These results indicate that the CTCF boundary sites of ESC SDs and PDs are frequently occupied by CTCF in multiple cell types, and together with the analysis of interaction data for NPCs described above, support the idea that CTCF-CTCF interaction structures may often be shared by ESCs and more differentiated cell types.
NIH-PA Author Manuscript
NIH-PA Author Manuscript
DISCUSSION
Understanding how the ESC pluripotency gene expression program is regulated of
considerable interest because it provides the foundation for understanding gene control in all cells. There is much evidence that cohesin and CTCF have roles in connecting gene
regulation and chromosome structure in ESCs (Cavalli and Misteli, 2013; Dixon et al., 2012; Gibcus and Dekker, 2013; Gorkin et al., 2014; Merkenschlager and Odom, 2013; Phillips-Cremins and Corces, 2013; Phillips-Phillips-Cremins et al., 2013; Sanyal et al., 2012; Sofueva et al., 2013) but limited knowledge of the these structures across the genome and scant functional evidence that specific structures actually contribute to the control of important ESC genes. We describe here organizing principles that explain how a key set of cohesin-associated chromosome structures contribute to the ESC gene expression program.
To gain insights into the relationship between transcriptional control of cell identity and control of chromosome structure, we carried out cohesin ChIA-PET and focused the analysis on loci containing super-enhancers, which drive expression of key cell identity genes. We found that the majority of super-enhancers and their associated genes occur within large loops that are connected through interacting CTCF sites co-occupied by cohesin. These super-enhancer domains, or SDs, typically contain one super-enhancer that loops to one gene within the SD. The SDs appear to restrict super-enhancer activity to genes within the SD, because the cohesin ChIA-PET interactions occur primarily within the SD and loss of a CTCF boundary tends to cause inappropriate activation of nearby genes located outside that boundary. The proper association of super-enhancers and their target genes in such
“insulated neighborhoods” is of considerable importance since the mis-targeting of a single super-enhancer is sufficient to cause leukemia (Groschel et al., 2014).
The cohesin ChIA-PET data and perturbation of CTCF sites suggest that genes that encode repressed, lineage-specifying, developmental regulators also occur within insulated neighborhoods in ESCs. Maintenance of the pluripotent ESC state requires that genes encoding lineage-specifying developmental regulators are repressed, and these repressed lineage-specifying genes are occupied by nucleosomal histones that carry the Polycomb mark H3K27me3 (Boyer et al., 2006; Bracken et al., 2006; Lee et al., 2006; Negre et al., 2006; Schwartz et al., 2006; Squazzo et al., 2006; Tolhuis et al., 2006). The majority of these genes were found to be located within a cohesion-associated CTCF-CTCF loop, which we call a Polycomb Domain, or PD. The perturbation of CTCF PD boundary sites caused de-repression of the Polycomb-bound gene within the PD, suggesting that these boundaries are important for maintenance of gene repression within the PD.
CTCF has previously been shown to be associated with boundary formation, insulator activity and transcriptional regulation (Bell et al., 1999; Denholtz et al., 2013; Felsenfeld et al., 2004; Handoko et al., 2011; Kim et al., 2007; Phillips and Corces, 2009; Schwartz et al., 2012; Sexton et al., 2012; Soshnikova et al., 2010; Valenzuela and Kamakaka, 2006). Previous reports have also demonstrated that cohesin and CTCF are associated with large loop substructures within TADs, whereas cohesin and Mediator are associated with smaller loop structures that sometimes form within the CTCF-bounded loops (de Wit et al., 2013; Phillips-Cremins et al., 2013; Sofueva et al., 2013). CTCF-bound domains have been
NIH-PA Author Manuscript
NIH-PA Author Manuscript
proposed to confine the activity of enhancers to specific target genes, thus yielding proper tissue-specific expression of genes (DeMare et al., 2013; Handoko et al., 2011; Hawkins et al., 2011). Our genome-wide study extends these observations by connecting such structures with the transcriptional control of specific super-enhancer-driven and Polycomb-repressed cell identity genes, and by showing that these structures can contribute to the control of genes inside and outside of the insulated neighborhoods that contain key pluripotency genes. The organization of key cell identity genes into insulated neighborhoods may be a property common to all mammalian cell types. Indeed, several recent studies have identified CTCF bounded regions whose function is consistent with ESC SDs (Guo et al., 2011; Wang et al., 2014). For example, in T cell acute lymphocytic leukemia, Notch1 activation leads to increased expression of a super-enhancer--driven gene found between two CTCF sites that are structurally connected, but does not affect genes located outside of the two CTCF sites (Wang et al., 2014). Future studies addressing the mechanisms that regulate loop formation should provide additional insights into the relationships between transcriptional control of cell identity genes and control of local chromosome structure.
EXPERIMENTAL PROCEDURES
Cell Culture
V6.5 murine ESCs were grown on irradiated murine embryonic fibroblasts (MEFs) under standard ESC conditions as described previously (Whyte et al., 2012).
Genome Editing
The CRISPR/Cas9 system was used to create ESC lines with CTCF site deletions. Target-specific oligonucleotides were cloned into a plasmid carrying a codon-optimized version of Cas9 (pX330, Addgene: 42230). The genomic sequences complementary to guide RNAs in the genome editing experiments are listed in the Extended Experimental Procedures. Cells were transfected with two plasmids expressing Cas9 and sgRNA targeting regions around 200 basepairs up- and down- stream of the CTCF binding site, respectively. A plasmid expressing PGK-puroR was also co-transfected, using X-fect reagent (Clontech) according to the manufacturer's instructions. One day after transfection, cells were re-plated on DR4 MEF feeder layers. One day after re-plating, puromycin (2ug/ml) was added for three days. Subsequently, puromycin was withdrawn for three to four days. Individual colonies were picked and genotyped by PCR.
ChIA-PET
SMC1 ChIA-PET was performed as previously described (Chepelev et al., 2012; Fullwood et al., 2009; Goh et al., 2012; Li et al., 2012). Briefly, murine ESCs (up to 1×10⁸ cells) were treated with 1% formaldehyde at room temperature for 10 min and then neutralized using 0.2M glycine. The crosslinked chromatin was fragmented by sonication to size lengths of 300-700 bp. The anti-SMC1 antibody (Bethyl, A300-055A) was used to enrich SMC1-bound chromatin fragments. A portion of ChIP DNA was eluted from antibody-coated beads for concentration quantification and for enrichment analysis using quantitative PCR. For ChIA-PET library construction ChIP DNA fragments were end-repaired using T4 DNA
NIH-PA Author Manuscript
NIH-PA Author Manuscript
polymerase (NEB) and ligated to either linker A or linker B. After linker ligation, the two samples were combined for proximity ligation in diluted conditions. Following proximity ligation, the Paired-End Tag (PET) constructs were extracted from the ligation products and the PET templates were subjected to 50x50 paired-end sequencing using Illumina HiSeq 2000.
Data analysis
ChIA-PET data analysis was performed as previously described (Li et al., 2010), with modifications described in the Extended Experimental Procedures. The high confidence interactions for the two biological replicate SMC1 ChIA-PET experiments and for the merged dataset are listed in Tables S1C, S1D and S1E, respectively. All datasets used in this study are listed in Table S6.
Supplementary Material
Refer to Web version on PubMed Central for supplementary material.
Acknowledgments
We thank Warren Whyte for generating the H3K27me3 ChIP-Seq dataset, Chikdu Shivalila for help with genome editing experiments, Alla Sigova for help with experiment design, Rudolf Jaenisch for sharing CRISPR reagents, and the Whitehead Institute Genome Technology Core and NHLBI DNA Sequencing Core for Illumina sequencing. We also thank members of the Young lab for helpful discussions. This work was supported by the National Institutes of Health grant HG002668 (R.A.Y.), Division of Intramural Research, NHLBI (K.Z.), a Ruth L. Kirschstein National Research Service Award (CA168263-01A1) (J.M.D.), by an Erwin Schrödinger Fellowship (J3490) from the Austrian Science Fund (FWF) (D.H.), and a Rubicon Fellowship for the Life Sciences, Netherlands Organization for Scientific Research (NWO)(J.S.). R.A.Y. is a founder of Syros Pharmaceuticals.
REFERENCES
Baranello L, Kouzine F, Levens D. CTCF and cohesin cooperate to organize the 3D structure of the mammalian genome. Proceedings of the National Academy of Sciences of the United States of America. 2014; 111:889–890. [PubMed: 24398527]
Bell AC, West AG, Felsenfeld G. The protein CTCF is required for the enhancer blocking activity of vertebrate insulators. Cell. 1999; 98:387–396. [PubMed: 10458613]
Boyer LA, Plath K, Zeitlinger J, Brambrink T, Medeiros LA, Lee TI, Levine SS, Wernig M, Tajonar A, Ray MK, et al. Polycomb complexes repress developmental regulators in murine embryonic stem cells. Nature. 2006; 441:349–353. [PubMed: 16625203]
Bracken AP, Dietrich N, Pasini D, Hansen KH, Helin K. Genome-wide mapping of Polycomb target genes unravels their roles in cell fate transitions. Genes & development. 2006; 20:1123–1136. [PubMed: 16618801]
Cavalli G, Misteli T. Functional implications of genome topology. Nature structural & molecular biology. 2013; 20:290–299.
Chepelev I, Wei G, Wangsa D, Tang Q, Zhao K. Characterization of genome-wide enhancer-promoter interactions reveals co-expression of interacting genes and modes of higher order chromatin organization. Cell research. 2012; 22:490–503. [PubMed: 22270183]
Cuddapah S, Jothi R, Schones DE, Roh TY, Cui K, Zhao K. Global analysis of the insulator binding protein CTCF in chromatin barrier regions reveals demarcation of active and repressive domains. Genome research. 2009; 19:24–32. [PubMed: 19056695]
de Wit E, Bouwman BA, Zhu Y, Klous P, Splinter E, Verstegen MJ, Krijger PH, Festuccia N, Nora EP, Welling M, et al. The pluripotent genome in three dimensions is shaped around pluripotency factors. Nature. 2013
NIH-PA Author Manuscript
NIH-PA Author Manuscript
DeMare LE, Leng J, Cotney J, Reilly SK, Yin J, Sarro R, Noonan JP. The genomic landscape of cohesin-associated chromatin interactions. Genome research. 2013; 23:1224–1234. [PubMed: 23704192]
Denholtz M, Bonora G, Chronis C, Splinter E, de Laat W, Ernst J, Pellegrini M, Plath K. Long-range chromatin contacts in embryonic stem cells reveal a role for pluripotency factors and polycomb proteins in genome organization. Cell stem cell. 2013; 13:602–616. [PubMed: 24035354] Dixon JR, Selvaraj S, Yue F, Kim A, Li Y, Shen Y, Hu M, Liu JS, Ren B. Topological domains in
mammalian genomes identified by analysis of chromatin interactions. Nature. 2012; 485:376–380. [PubMed: 22495300]
Dowen JM, Bilodeau S, Orlando DA, Hubner MR, Abraham BJ, Spector DL, Young RA. Multiple Structural Maintenance of Chromosome Complexes at Transcriptional Regulatory Elements. Stem Cell Reports. 2013 In Press.
Essafi A, Webb A, Berry RL, Slight J, Burn SF, Spraggon L, Velecela V, Martinez-Estrada OM, Wiltshire JH, Roberts SG, et al. A wt1-controlled chromatin switching mechanism underpins tissue-specific wnt4 activation and repression. Developmental cell. 2011; 21:559–574. [PubMed: 21871842]
Felsenfeld G, Burgess-Beusse B, Farrell C, Gaszner M, Ghirlando R, Huang S, Jin C, Litt M, Magdinier F, Mutskov V, et al. Chromatin boundaries and chromatin domains. Cold Spring Harbor symposia on quantitative biology. 2004; 69:245–250.
Filippova D, Patro R, Duggal G, Kingsford C. Identification of alternative topological domains in chromatin. Algorithms for molecular biology : AMB. 2014; 9:14. [PubMed: 24868242] Fullwood MJ, Liu MH, Pan YF, Liu J, Xu H, Mohamed YB, Orlov YL, Velkov S, Ho A, Mei PH, et
al. An oestrogen-receptor-alpha-bound human chromatin interactome. Nature. 2009; 462:58–64. [PubMed: 19890323]
Gibcus JH, Dekker J. The hierarchy of the 3D genome. Molecular cell. 2013; 49:773–782. [PubMed: 23473598]
Goh Y, Fullwood MJ, Poh HM, Peh SQ, Ong CT, Zhang J, Ruan X, Ruan Y. Chromatin Interaction Analysis with Paired-End Tag Sequencing (ChIA-PET) for mapping chromatin interactions and understanding transcription regulation. Journal of visualized experiments : JoVE. 2012
Gorkin DU, Leung D, Ren B. The 3D genome in transcriptional regulation and pluripotency. Cell stem cell. 2014; 14:762–775. [PubMed: 24905166]
Groschel S, Sanders MA, Hoogenboezem R, de Wit E, Bouwman BA, Erpelinck C, van der Velden VH, Havermans M, Avellino R, van Lom K, et al. A single oncogenic enhancer rearrangement causes concomitant EVI1 and GATA2 deregulation in leukemia. Cell. 2014; 157:369–381. [PubMed: 24703711]
Guo C, Yoon HS, Franklin A, Jain S, Ebert A, Cheng HL, Hansen E, Despo O, Bossen C, Vettermann C, et al. CTCF-binding elements mediate control of V(D)J recombination. Nature. 2011; 477:424– 430. [PubMed: 21909113]
Handoko L, Xu H, Li G, Ngan CY, Chew E, Schnapp M, Lee CW, Ye C, Ping JL, Mulawadi F, et al. CTCF-mediated functional chromatin interactome in pluripotent cells. Nature genetics. 2011; 43:630–638. [PubMed: 21685913]
Hawkins RD, Hon GC, Yang C, Antosiewicz-Bourget JE, Lee LK, Ngo QM, Klugman S, Ching KA, Edsall LE, Ye Z, et al. Dynamic chromatin states in human ES cells reveal potential regulatory sequences and genes involved in pluripotency. Cell research. 2011; 21:1393–1409. [PubMed: 21876557]
Hnisz D, Abraham BJ, Lee TI, Lau A, Saint-Andre V, Sigova AA, Hoke HA, Young RA. Super-enhancers in the control of cell identity and disease. Cell. 2013; 155:934–947. [PubMed: 24119843]
Kagey MH, Newman JJ, Bilodeau S, Zhan Y, Orlando DA, van Berkum NL, Ebmeier CC, Goossens J, Rahl PB, Levine SS, et al. Mediator and cohesin connect gene expression and chromatin
architecture. Nature. 2010; 467:430–435. [PubMed: 20720539]
Kaspi H, Chapnik E, Levy M, Beck G, Hornstein E, Soen Y. Brief report: miR-290-295 regulate embryonic stem cell differentiation propensities by repressing Pax6. Stem cells. 2013; 31:2266– 2272. [PubMed: 23843298]
NIH-PA Author Manuscript
NIH-PA Author Manuscript
Kieffer-Kwon KR, Tang Z, Mathe E, Qian J, Sung MH, Li G, Resch W, Baek S, Pruett N, Grontved L, et al. Interactome maps of mouse gene regulatory domains reveal basic principles of
transcriptional regulation. Cell. 2013; 155:1507–1520. [PubMed: 24360274]
Kim TH, Abdullaev ZK, Smith AD, Ching KA, Loukinov DI, Green RD, Zhang MQ, Lobanenkov VV, Ren B. Analysis of the vertebrate insulator protein CTCF-binding sites in the human genome. Cell. 2007; 128:1231–1245. [PubMed: 17382889]
Lee TI, Jenner RG, Boyer LA, Guenther MG, Levine SS, Kumar RM, Chevalier B, Johnstone SE, Cole MF, Isono K, et al. Control of developmental regulators by Polycomb in human embryonic stem cells. Cell. 2006; 125:301–313. [PubMed: 16630818]
Lee TI, Young RA. Transcriptional regulation and its misregulation in disease. Cell. 2013; 152:1237– 1251. [PubMed: 23498934]
Lelli KM, Slattery M, Mann RS. Disentangling the many layers of eukaryotic transcriptional regulation. Annual review of genetics. 2012; 46:43–68.
Li G, Fullwood MJ, Xu H, Mulawadi FH, Velkov S, Vega V, Ariyaratne PN, Mohamed YB, Ooi HS, Tennakoon C, et al. ChIA-PET tool for comprehensive chromatin interaction analysis with paired-end tag sequencing. Genome biology. 2010; 11:R22. [PubMed: 20181287]
Li G, Ruan X, Auerbach RK, Sandhu KS, Zheng M, Wang P, Poh HM, Goh Y, Lim J, Zhang J, et al. Extensive promoter-centered chromatin interactions provide a topological basis for transcription regulation. Cell. 2012; 148:84–98. [PubMed: 22265404]
Margueron R, Reinberg D. The Polycomb complex PRC2 and its mark in life. Nature. 2011; 469:343– 349. [PubMed: 21248841]
Merkenschlager M, Odom DT. CTCF and cohesin: linking gene regulatory elements with their targets. Cell. 2013; 152:1285–1297. [PubMed: 23498937]
Meuleman W, Peric-Hupkes D, Kind J, Beaudry JB, Pagie L, Kellis M, Reinders M, Wessels L, van Steensel B. Constitutive nuclear lamina-genome interactions are highly conserved and associated with A/T-rich sequence. Genome research. 2013; 23:270–280. [PubMed: 23124521]
Naumova N, Imakaev M, Fudenberg G, Zhan Y, Lajoie BR, Mirny LA, Dekker J. Organization of the mitotic chromosome. Science. 2013; 342:948–953. [PubMed: 24200812]
Negre N, Hennetin J, Sun LV, Lavrov S, Bellis M, White KP, Cavalli G. Chromosomal distribution of PcG proteins during Drosophila development. PLoS biology. 2006; 4:e170. [PubMed: 16613483] Ng HH, Surani MA. The transcriptional and signalling networks of pluripotency. Nature cell biology.
2011; 13:490–496.
Nora EP, Lajoie BR, Schulz EG, Giorgetti L, Okamoto I, Servant N, Piolot T, van Berkum NL, Meisig J, Sedat J, et al. Spatial partitioning of the regulatory landscape of the X-inactivation centre. Nature. 2012; 485:381–385. [PubMed: 22495304]
Ong CT, Corces VG. CTCF: an architectural protein bridging genome topology and function. Nat Rev Genet. 2014; 15:234–246. [PubMed: 24614316]
Orkin SH, Hochedlinger K. Chromatin connections to pluripotency and cellular reprogramming. Cell. 2011; 145:835–850. [PubMed: 21663790]
Parelho V, Hadjur S, Spivakov M, Leleu M, Sauer S, Gregson HC, Jarmuz A, Canzonetta C, Webster Z, Nesterova T, et al. Cohesins functionally associate with CTCF on mammalian chromosome arms. Cell. 2008; 132:422–433. [PubMed: 18237772]
Phillips JE, Corces VG. CTCF: master weaver of the genome. Cell. 2009; 137:1194–1211. [PubMed: 19563753]
Phillips-Cremins JE, Corces VG. Chromatin insulators: linking genome organization to cellular function. Molecular cell. 2013; 50:461–474. [PubMed: 23706817]
Phillips-Cremins JE, Sauria ME, Sanyal A, Gerasimova TI, Lajoie BR, Bell JS, Ong CT, Hookway TA, Guo C, Sun Y, et al. Architectural protein subclasses shape 3D organization of genomes during lineage commitment. Cell. 2013; 153:1281–1295. [PubMed: 23706625]
Roeder RG. Transcriptional regulation and the role of diverse coactivators in animal cells. FEBS Lett. 2005; 579:909–915. [PubMed: 15680973]
Rubio ED, Reiss DJ, Welcsh PL, Disteche CM, Filippova GN, Baliga NS, Aebersold R, Ranish JA, Krumm A. CTCF physically links cohesin to chromatin. Proceedings of the National Academy of Sciences of the United States of America. 2008; 105:8309–8314. [PubMed: 18550811]
NIH-PA Author Manuscript
NIH-PA Author Manuscript
Sanyal A, Lajoie BR, Jain G, Dekker J. The long-range interaction landscape of gene promoters. Nature. 2012; 489:109–113. [PubMed: 22955621]
Schaaf CA, Misulovin Z, Gause M, Koenig A, Gohara DW, Watson A, Dorsett D. Cohesin and polycomb proteins functionally interact to control transcription at silenced and active genes. PLoS Genet. 2013; 9:e1003560. [PubMed: 23818863]
Schwartz YB, Kahn TG, Nix DA, Li XY, Bourgon R, Biggin M, Pirrotta V. Genome-wide analysis of Polycomb targets in Drosophila melanogaster. Nature genetics. 2006; 38:700–705. [PubMed: 16732288]
Schwartz YB, Linder-Basso D, Kharchenko PV, Tolstorukov MY, Kim M, Li HB, Gorchakov AA, Minoda A, Shanower G, Alekseyenko AA, et al. Nature and function of insulator protein binding sites in the Drosophila genome. Genome research. 2012; 22:2188–2198. [PubMed: 22767387] Seitan VC, Faure AJ, Zhan Y, McCord RP, Lajoie BR, Ing-Simmons E, Lenhard B, Giorgetti L, Heard
E, Fisher AG, et al. Cohesin-based chromatin interactions enable regulated gene expression within preexisting architectural compartments. Genome research. 2013; 23:2066–2077. [PubMed: 24002784]
Sexton T, Yaffe E, Kenigsberg E, Bantignies F, Leblanc B, Hoichman M, Parrinello H, Tanay A, Cavalli G. Three-dimensional folding and functional organization principles of the Drosophila genome. Cell. 2012; 148:458–472. [PubMed: 22265598]
Shen Y, Yue F, McCleary DF, Ye Z, Edsall L, Kuan S, Wagner U, Dixon J, Lee L, Lobanenkov VV, et al. A map of the cis-regulatory sequences in the mouse genome. Nature. 2012; 488:116–120. [PubMed: 22763441]
Smallwood A, Ren B. Genome organization and long-range regulation of gene expression by enhancers. Curr Opin Cell Biol. 2013; 25:387–394. [PubMed: 23465541]
Sofueva S, Yaffe E, Chan WC, Georgopoulou D, Vietri Rudan M, Mira-Bontenbal H, Pollard SM, Schroth GP, Tanay A, Hadjur S. Cohesin-mediated interactions organize chromosomal domain architecture. The EMBO journal. 2013; 32:3119–3129. [PubMed: 24185899]
Soshnikova N, Montavon T, Leleu M, Galjart N, Duboule D. Functional analysis of CTCF during mammalian limb development. Developmental cell. 2010; 19:819–830. [PubMed: 21145498] Spitz F, Furlong EE. Transcription factors: from enhancer binding to developmental control. Nat Rev
Genet. 2012; 13:613–626. [PubMed: 22868264]
Squazzo SL, O'Geen H, Komashko VM, Krig SR, Jin VX, Jang SW, Margueron R, Reinberg D, Green R, Farnham PJ. Suz12 binds to silenced regions of the genome in a cell-type-specific manner. Genome research. 2006; 16:890–900. [PubMed: 16751344]
Tolhuis B, de Wit E, Muijrers I, Teunissen H, Talhout W, van Steensel B, van Lohuizen M. Genome-wide profiling of PRC1 and PRC2 Polycomb chromatin binding in Drosophila melanogaster. Nature genetics. 2006; 38:694–699. [PubMed: 16628213]
Valenzuela L, Kamakaka RT. Chromatin insulators. Annual review of genetics. 2006; 40:107–138. Van Bortle K, Ramos E, Takenaka N, Yang J, Wahi JE, Corces VG. Drosophila CTCF tandemly
aligns with other insulator proteins at the borders of H3K27me3 domains. Genome research. 2012; 22:2176–2187. [PubMed: 22722341]
Wang H, Zang C, Taing L, Arnett KL, Wong YJ, Pear WS, Blacklow SC, Liu XS, Aster JC. NOTCH1-RBPJ complexes drive target gene expression through dynamic interactions with superenhancers. Proceedings of the National Academy of Sciences of the United States of America. 2014; 111:705–710. [PubMed: 24374627]
Wen B, Wu H, Shinkai Y, Irizarry RA, Feinberg AP. Large histone H3 lysine 9 dimethylated chromatin blocks distinguish differentiated from embryonic stem cells. Nature genetics. 2009; 41:246–250. [PubMed: 19151716]
Wendt KS, Yoshida K, Itoh T, Bando M, Koch B, Schirghuber E, Tsutsumi S, Nagae G, Ishihara K, Mishiro T, et al. Cohesin mediates transcriptional insulation by CCCTC-binding factor. Nature. 2008; 451:796–801. [PubMed: 18235444]
Whyte WA, Bilodeau S, Orlando DA, Hoke HA, Frampton GM, Foster CT, Cowley SM, Young RA. Enhancer decommissioning by LSD1 during embryonic stem cell differentiation. Nature. 2012; 482:221–225. [PubMed: 22297846]
NIH-PA Author Manuscript
NIH-PA Author Manuscript
Whyte WA, Orlando DA, Hnisz D, Abraham BJ, Lin CY, Kagey MH, Rahl PB, Lee TI, Young RA. Master transcription factors and mediator establish super-enhancers at key cell identity genes. Cell. 2013; 153:307–319. [PubMed: 23582322]
Young RA. Control of the embryonic stem cell state. Cell. 2011; 144:940–954. [PubMed: 21414485] Zuin J, Dixon JR, van der Reijden MI, Ye Z, Kolovos P, Brouwer RW, van de Corput MP, van de
Werken HJ, Knoch TA, van Ijcken WF, et al. Cohesin and CTCF differentially affect chromatin architecture and gene expression in human cells. Proceedings of the National Academy of Sciences of the United States of America. 2014; 111:996–1001. [PubMed: 24335803]
NIH-PA Author Manuscript
NIH-PA Author Manuscript
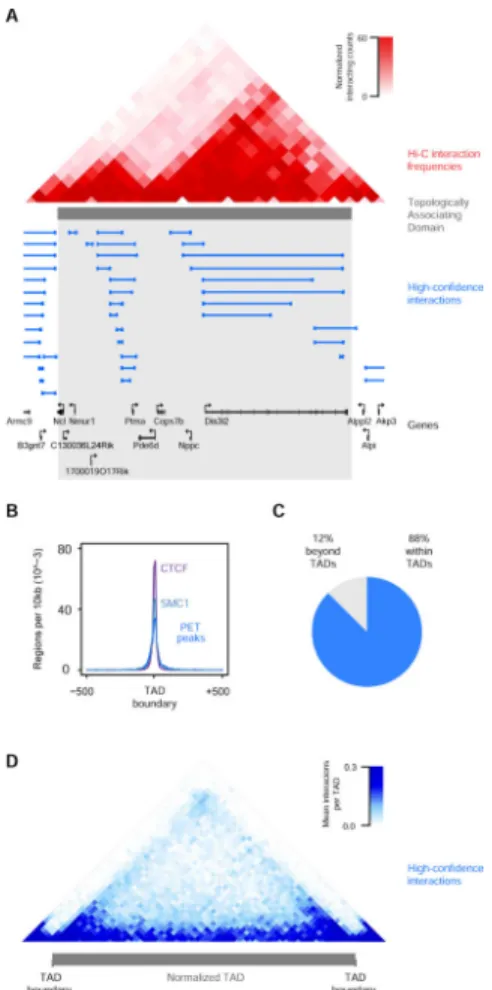
Figure 1. DNA interactions involving cohesin
A) Units of chromosome organization. Chromosomes consist of multiple Topologically Associating Domains (TADs). TADs (image adapted from (Dixon et al., 2012)) contain multiple genes with DNA loops involving interactions between enhancers, promoters and other regulatory elements, which are mediated by cohesin (blue ring) and CTCF (purple balls). Nucleosomes represent the smallest unit of chromosome organization.
B) Heatmap representation of ESC ChIP-seq data for SMC1, a merged dataset for the transcription factors OCT4, SOX2 and NANOG (OSN), MED12, RNA polymerase II (Pol2), H3K27me3, and CTCF at SMC1-occupied regions. Read density is displayed within a 10kb window and color scale intensities are shown in rpm/bp. Cohesin occupies three classes of sites: enhancer-promoter sites, Polycomb-occupied sites, and CTCF-occupied sites.
C) ESC cohesin (SMC1) ChIA-PET data analysis at the Mycn locus. The algorithm used to identify paired-end tags (PETs) is described in detail in Extended Experimental Procedures. PETs and interactions involving enhancers and promoters within the window are displayed at each step in the analysis pipeline: unique PETs, PET peaks, interactions between PET peaks, and high-confidence interactions supported by at least 3 independent PETs and with a FDR of 0.01.
D) Summary of the major classes of interactions and high-confidence interactions identified in the cohesin ChIA-PET data. Enhancers, promoters, and CTCF sites where interactions occur are displayed as blue circles, and the size of the circle is proportional to the number
NIH-PA Author Manuscript
NIH-PA Author Manuscript
regions. The interactions between two sites are displayed as grey lines, and the thickness of the grey line is proportional to the number of interactions. The diagram on the left was generated using the interactions, and the diagram on the right was generated using the high confidence interactions.
See also Figure S1, S2, Table S1, S2.
NIH-PA Author Manuscript
NIH-PA Author Manuscript
Figure 2. DNA interactions frequently occur within Topologically Associating Domains
A) An example Topologically Associating Domain (TAD) shown with normalized Hi-C interaction frequencies displayed as a two-dimensional heat map (Dixon et al., 2012) and the TAD is indicated as a grey bar. High-confidence SMC1 ChIAPET interactions are depicted as blue lines.
B) Enrichment of CTCF, cohesin (SMC1), and PET peaks at TAD boundary regions. The metagene representation shows the number of regions per 10 kb window centered on the TAD boundary and +/− 500kb is displayed.
C) Pie chart of high-confidence interactions that either fall within TADs (88%) or cross TAD boundaries (12%). D) High-confidence interactions are displayed as a two-dimensional heat map across a normalized TAD length for the ~2,200 TADs (Dixon et al., 2012). The display is centered on the normalized TAD and extends beyond each boundary to 10% of the size of the domain.
See also Table S3A.
NIH-PA Author Manuscript
NIH-PA Author Manuscript
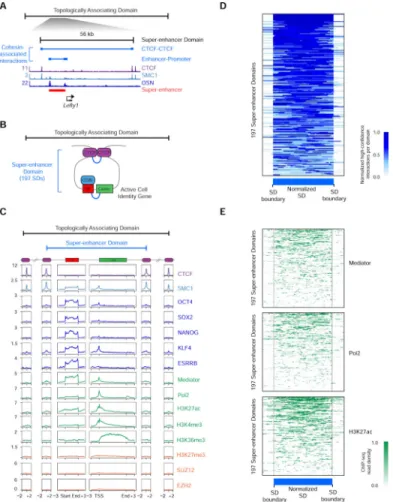
Figure 3. Super-enhancer Domain Structure
A) An example super-enhancer domain (SD) within a TAD. High-confidence SMC1 ChIA-PET interactions are depicted as blue lines. ChIP-Seq binding profiles (reads per million per base pair) for CTCF, cohesin (SMC1), and the master transcription factors OCT4, SOX2, and NANOG (OSN) are shown at the Lefty1 locus in ESCs. The super-enhancer is indicated by a red bar.
B) Model of SD structure. The 197 SDs have interactions (blue) between cohesin-occupied CTCF sites that may serve as outer boundaries of the domain structure. SDs also contain interactions between super-enhancers and the promoters of their associated genes. C) Metagene analysis showing the occupancy of various factors at the key elements of TADs and SDs, including CTCF sites, super-enhancers and super-enhancer associated genes. ChIP-seq profiles are shown in reads per million per base pair. Boundary site metagenes are centered on the CTCF peak, and +/−2kb is displayed. Super-enhancer metadata is centered on the 195 super-enhancers in SDs and +/−3 kb is displayed. The data for associated genes are centered on the 219 super-enhancer -associated genes in SDs and +/ −3kb is displayed.
D) Heat map showing that cohesin ChIA-PET high-confidence interactions occur
predominantly within the SDs. The density of high-confidence interactions is shown across a normalized SD length for the 197 SDs.
NIH-PA Author Manuscript
NIH-PA Author Manuscript
E) Heat map showing that transcriptional proteins are contained within boundary sites of SDs. The occupancy of Mediator (MED12), H3K27ac and RNA polymerase II (Pol2) at super-enhancers and associated genes is shown across a normalized SD length for the 197 SDs.
See also Figure S3, Table S4.
NIH-PA Author Manuscript
NIH-PA Author Manuscript
Figure 4. Super-enhancer Domains are functionally linked to gene expression
CRISPR-mediated genome editing of CTCF sites at five loci. The top of each panel shows high-confidence interactions depicted as blue lines, and ChIP-Seq binding profiles (reads per million per base pair) for CTCF, cohesin (SMC1), and OCT4, SOX2, and NANOG (OSN) in ESCs at the respective loci. The super-enhancer is indicated as a red bar. The bottom of each panel shows gene expression level of the indicated genes in wild type and CTCF site-deleted cells measured by qRT-PCR. Transcript levels were normalized to GAPDH. Gene expression was assayed in triplicate in at least two biological replicate samples, and is displayed as mean+SD. All P-values were determined using the Student's t-test.
A) CRISPR-mediated genome editing of a CTCF site at the miR-290-295 locus. (P-value < 0.001, Pri-miR-290-295 and Nlrp12 in wild-type vs. CTCF site-deleted).
B) CRISPR-mediated genome editing of a CTCF site at the Nanog locus. (P-value < 0.05,
Nanog in wild-type vs. CTCF site-deleted).
C) CRISPR-mediated genome editing of a CTCF site at the Tdgf1 locus. (P-value < 0.001,
Gm590; P-value < 0.01, Lrrc2) in wild-type vs. CTCF site-deleted).
D) CRISPR-mediated genome editing of a CTCF site at the Pou5f1 locus. (P-value < 0.012,
H2Q-10 in wild-type vs. CTCF site-deleted).
E) CRISPR-mediated genome editing of CTCF sites at the Prdm14 locus. (P-value < 0.001,
Slco5a1 in wild-type vs. CTCF site-deleted).
NIH-PA Author Manuscript
NIH-PA Author Manuscript
The CTCF-deletion lines at the Pou5f1 and Prdm14 (C1-2) loci are heterozygous, while the CTCF-deletion lines at the Nanog, Tdgf1 and miR-290-295 loci are homozygous for the mutation.
See also Figure S4.
NIH-PA Author Manuscript
NIH-PA Author Manuscript
Figure 5. Polycomb Domain Structure
A) An example Polycomb Domain (PD) within a TAD. A high-confidence interaction is depicted as the blue line. ChIP-Seq binding profiles (reads per million per base pair) for CTCF, cohesin (SMC1), and H3K27me3 at the Gata2 locus in ESCs.
B) Model of PD structure. The 349 PDs have interactions (blue) between CTCF sites that serve as putative boundaries of the domain structure.
C) Metagene analysis reveals the occupancy of various factors at the key elements of TADs and PDs: CTCF sites and target genes. ChIP-seq profiles are shown in reads per million per base pair. Boundary site metagenes are centered on the CTCF peak and +/−2 kb is
displayed. The metagenes depicting genes are centered on the 380 Polycomb target genes in PDs and +/−3 kb is displayed.
D) Heat map showing that high-confidence interactions are largely constrained within PDs. The density of high-confidence interactions is shown across a normalized PD length for the 349 PDs.
E) Heat map showing that Polycomb proteins are contained within boundary sites of PDs. The occupancy of CTCF, H3K27me3, SUZ12 and EZH2 is indicated within a 10 kb window centered on the left and right CTCF-occupied boundary regions is shown for the 120 PDs with this transition pattern.
F) CRISPR-mediated genome editing of a CTCF site at the Tcfa2e locus. Top, high-confidence interactions are depicted by blue lines and ChIP-Seq binding profiles (reads per
NIH-PA Author Manuscript
NIH-PA Author Manuscript
million per base pair) for CTCF, cohesin (SMC1), and H3K27me3 are shown in ESCs.
Bottom, Expression level of the indicated genes in wild type and CTCF site-deleted cells
measured by qRT-PCR. Transcript levels were normalized to GAPDH. Gene expression was assayed in triplicate in at least two biological replicate samples and is displayed as mean +SD (P-value < 0.05, Tcfap2e in C1 deletion cells; P-value < 0.001, Tcfap2e in C2 deletion cells) in wild-type vs. CTCF site-deleted). P-values were determined using the Student's t-test.
See also Figure S5, Table S5.
NIH-PA Author Manuscript
NIH-PA Author Manuscript
Figure 6. Insulated Neighborhoods are preserved in multiple cell types
A) Model depicting constitutive domain organization, mediated by interaction of two CTCF sites co-occupied by cohesin, in two cell types.
B) An example SD in ESCs and a domain in NPCs. High-confidence interactions from the SMC1 ChIA-PET dataset are depicted by blue lines and 5C interactions from (Phillips-Cremins et al., 2013) are depicted by black lines. Super-enhancers are indicated by red bars. ChIP-Seq binding profiles (reads per million per base pair) for CTCF, cohesin (SMC1), and OCT4, SOX2, and NANOG (OSN), SOX2 and BRN2 are shown at the Nanog locus and the
Olig1/Olig2 locus in ESCs and NPCs.
C) Occupancy of CTCF peaks across 18 cell types. The CTCF peaks used for the analysis are the CTCF peaks found in ESCs. The percentage of these peaks that are observed in the indicated number of cell types is shown for four groups of CTCF sites: all CTCF peaks identified in ESCs, CTCF peaks at SD boundaries in ESCs, CTCF peaks at PD boundaries in ESCs, and CTCF peaks at PET peaks (identified by SMC1 ChIA-PET in ESCs).
See also Figure S6, Table S3B.