Disruptive MHD Activity during Plasma Current Rise in Alcator A Tokamak
R.S. Granetz, I.H. Hutchinson and D.O. Overskei
PFC/RR-79-1 January 1979
Francis Bitter National Magnet Laboratory and
Plasma Fusion Center
Massachusetts Institute of Technology Cambridge, Massachusetts, U.S.A.
-2-Disruptive MHD Activity during Plasma Current Rise in Alcator A Tokamak
ABSTRACT
During the current rise phase of the Alcator A discharge a series of disruptions occurs, related to MHD activity of poloidal periodicity m, at limiter q values approximately 1.6 m (m integral). The electron temperature profile is peaked at the center throughout. It is shown, however, that current diffusion with the experimental T profiles
e
typically leads to hollow current profiles and that the disruptions appear to be related to the local ininimum of q inside the plasma attaining near-integral values. Disruptions may be avoided by decreasing the rate of current rise. This leads to improved plasma conditions throughout the discharge.
1. Introduction
The current-rise phase of tokamak discharges, subsequent to ionization of the plasma but prior to the attainment of maximum current, involves significant nonclassical current diffusion
processes. These processes are generally necessary to explain the abseuce of a dramatic skin effect in the spatial current profile.
Experimental evidence strongly supports the hypothesis that resistive MHD instabilities are responsible for the rapid current diffusion. On T-3 [1] and T-4 [2] a sequence of HD oscillations with decreasing poloidal periodicity, m, was identified, associated with rising plasma current. Corresponding to the peak of each mode, a positive perturbation of the loop voltage occurred and the plasma
internal inductance increased,indicating a narrowing of the current profile. Such sequences of positive voltage spikes have been observed on a number of tokamaks [1-4]. The relaxation of a hollow current profile was studied directly in LT-3 [53 and shown to be due to the growth, in this case, of an m=4 MND mode in the presence of a local minimum of the safety factor, q, slightly below 4. This led to rapid
current diffusion in the plasma and subsequent flattening of the current profile.
Thus a persuasive picture emerges as follows: as the current rises, a hollow current profile develops,- which is known theoretically
[6] to be unstable to tearing modes with m greater than the minimum q within the plasma. The fastest growing mode is that with the minimum
possible m and so as q falls the dominant mode number m decreases in sequence. As each mode grows to a sufficient amplitude. magnetic
-4-braiding occurs, causing rapid diffusion and flattening the current profile [7].
The present work reports a study of these phenomena on the Alcator A tokamak. We find that throughout most of the current rise phase the electron temperature profile remains peaked on axis. The characteristic series of relaxations is observed. However, the voltage spikes do not occur when the limiter safety factor, qt, is approximately integral, as has been reported elsewhere [2]. Instead, we find that relaxations occur, for typical parameters, when q s(1.6 4 .l)m with m the integral value of the related helical MH-D mode.
An analytic criterion is derived in Section 3 for the formation of a hollow current profile and used to deduce the temperature evolution, assuming the plasma diffusion rises so as to maintain the profile only marginally hollow. The results are in good agreement with experimental observations.
A numerical integration of the current diffusion equation with prescribed temperature profiles is described in Section 4. It shows that the current profiles may be expected to be hollow, due to the skin effect, and that the typical ratio of limiter q to the minimum q
value in the plasma is approximately 1.6. The MRD mode number, m, corresponds to this local minimum value of q, and thus the mode is
2. Experimental Observations
Our investigations of the MHD disturbances in Lhe current rise phase have utilized a variety of diagnostics. Azimuthal and toroidal mode structure is deduced from the signals of two sets of magnetic
pick-up coils. The first set consists of 12 discrete loops at a single toroidal location and spaced at 30* intervals in the poloidal direction. The second set is displaced 90* toroidally from the first
and is comprised of 8 discrete coils at 45* intervals in the poloidal direction. Both sets are located at a radius of 13.5 cm, between the vacuum vessel (0.5 mm stainless steel bellows) and the copper shell
(ag= 10 cm, rcopper shell _ 14 cm).
In addition to the standard loop diagnostics (e.g., voltage, plasma current, etc.), we have observed the electron cyclotion emission at the second harmonic using a tunable Fabry-Perot interferometer [81 to determine the temporal and spatial evolution of the electron temperature. Calibrating the electrcn cyclotron signal against Thomson scattering measurements gives us the absolute value of the temperature as well. Finally, the coupling of the MHD modes into the center of the plasma and the appearance of sawtooth oscillations is monitored from the
soft x-ray emission (E ;? 1 keV) along the central chord using a collimated surface barrier detector.
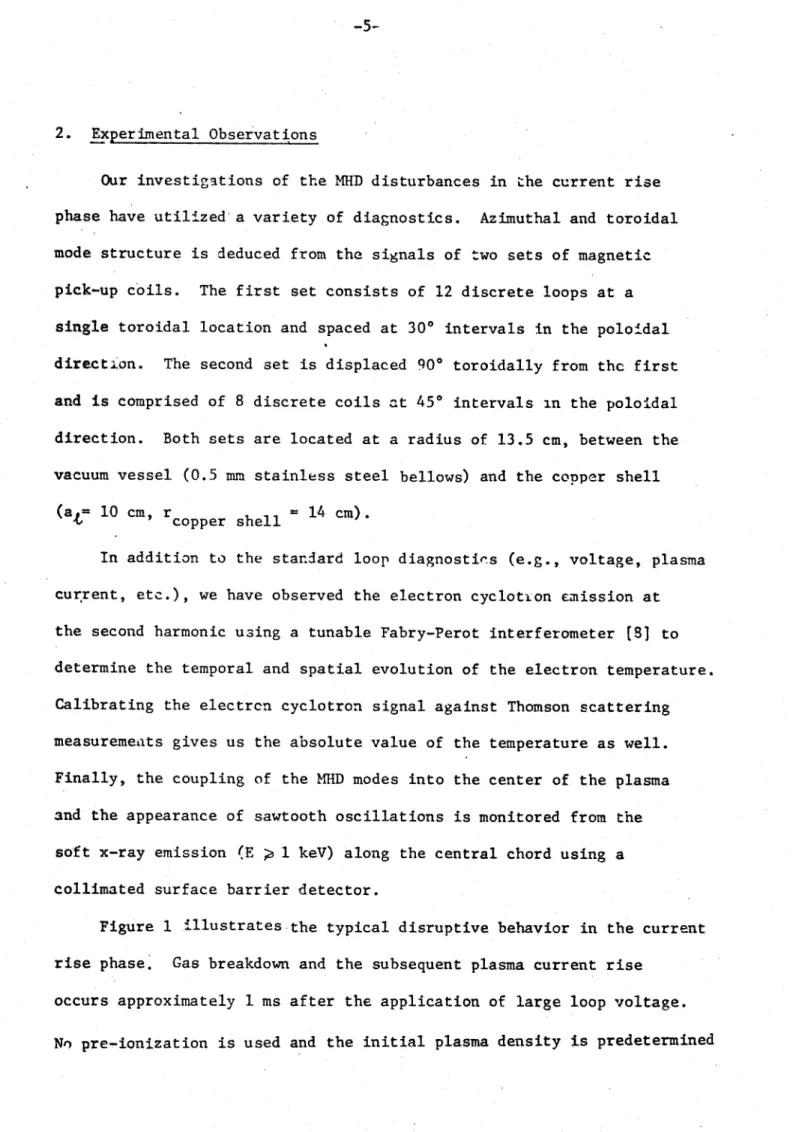
Figure 1 illustrates the typical disruptive behavior in the current rise phase. Gas breakdown and the subsequent plasma current rise
occurs approximately 1 ms after the application of large loop voltage. No pre-ionization is used and the initial plasma density is predetermined
-6-13 -3
to be n e! 3 x 10 cm by adjustment of the static gas fill pressure
in thc torus. During the first 7-10 ms the plasma density remains
relatively constant owing to recycling from the cold walls; then it
begins to increase as cold neutral gas is pulsed into the torus at about 7 ms. As the plasma current rises, a series of voltage spikes appears on the loop voltage. Associated with each of these individual disruptions is a sharp decrease in the rate of rise of plasma current,
dI /dt, and a sudden shift of the plasma inwards as indicated by the
position loop.
In addition there is an abrupt decrease in th- central electron temperature, as illustrated by the sharp breaks in the trace fourth from the top in Fig. 1. Electron cyclotron emission indicates that the sudden reductions in the electron temperature occur at all radii.
Of importance also is the fact that the temperature profile is always
peaked on axis during the current rise phase, increasing with time as shown in Fig. 2.- Peaked temperature profiles such as these would thus tend to supporc skin currents only in the hottest portion of the plasma, well inside the limiter edge.
For large rates of current rise, disruptions begin shortly after breakdown and plasma formation. As shown in Fig. 3 the statistics for a large number of discharges studied indicate that the disruptions generally are not associated with an integral q surface at the limiter but tend to group around integral multiples of 1.6.
In'view of the discrete number of coils available, we have restricted our analysis tn the slightly la:er stages when q(a) ! 12 and MUD
As the plasma current increases to the point where qt approaches 1.6 m, where m is an integer, a sudden increase in the MHD activity is observed on the magnetic loops. Simultaneous with the growth in MHD, a
small amplitude oscillation at the MD I frequency is superimposed on a 1-3 volt increase in the loop voltage. When q 1.6 m the loop voltage abruptly increases by up to 10 volts, often preceded by a negative voltage spike. A short burst of hard x rays at the limiter and the sudden drop in the electron temperature is correlated with this
large positive voltage spike. As the plasma current continues to increase, the voltage and MED Lativity decrease, the electron tempera-ture recovers and continues to increase with the rising plasma current. As the plasma current approaches a value such that qt r1.6(m-l) the sequence of events is repeated.
Although the modes tend to be quite distorted, a characteristic m value can be ascertained. In Fig. 4 we indicate the typical measured perturbations associated with each of the observed disruptions.
During the early phase of the discharge there appears to be a general distortion of the perturbations toward the inside, which appears to be due to the significant inward displacement of the plasma column during the first 15 ms of the discharge. Later on as the plasma density and increase, the column moves toward the outside slightly and the MHD modes are distorted toward the outside. In all cases the toroidal mode
number is n=l.
The m of the final disruption ie determined by the peak plasma current (minimum integral q value in the plasma) attained during the initial rise phase. In general, for Alcator A discharges with q, : 3.5
-8-at the end of the rise phase, the last MHD disruption is an m=2. n=1 mode. With this m=2 disruption the central electron temperature does not fully recover to its previous level and sawteeth instantly appear in the central temperature trace in Fig. 1. This implies that the m=2 disruption allows the current channel to peak rapidly on axis, forcing q(o) ; 1. Thereafter the sawtooth disruption regulates the current and temperature profile evolution.
Experimentally we have found two ways of eliminating or at least rcducing the severity of the disruptions during the current rise phase. The first method is to increase the static gas fill pressure and/or the immediate pulsing of cold neutral gas into the torus. A higher plasma density in the breakdown and subsequent current rise phase is then obtained. The available ohmic input power is approximately uncharged. Ignoring transport and radiation losses, we see from the power balance equation that the rate of increase in the central electron temperature will be reduced for the higher density cases:
.2
3 d~n
2 dt'' r= y
r=O 0
This allows faster current diffusion, reducing the tendency to disrupt.
The second method is to change the rate of rise of the plasma current by reducing the voltage of the ohmic heating primary circuit. Using this
technique we have been able to study these MIHD disruptions for a broad range of current rise rates. In Fig. 5 we have plotted the value of dl /dt
p
and I for which a disruption has been observed. !Iote the clustering of the disruptions around non-integral values of che limiter q. For large
values of I and a given I the plasma exhibits MD disruptive behavior.
p p
However, when the rate of current rise is lower, corresponding to parameters below the diagonal line in Fig. 5, the discharge evolves
free of disruptions. We have found that thus changing the current rise rate
has little influence on the rate of central temperature increase, at least until T attains values near those of the steady state.
3. Anal-tical Discussion of Follow Current Formation
The o-servation of disruptions associated with modes which are internal to the plasma and the expectation that in the presence of a hollow current profile such modes will develop, leads us to consider the conditions of the formation of such a hollow current.
Determination of the complete current profile, even given a known temperature profile, T (r,t), requires, in general, a full integration in time and space of the current diffusion equation. Such an integration, performed numerically, is described in Section 4. However, significant insight may be obtained analytically by restricting our discussion to the plasma center. This is possible since for all but very pathological temperature profiles the formation of a hollow current profile begins on
axis (r=O).
We assume Ohm's law in the form
j(r) = a(r)-E(r)
(?)
so that at r = 0, where aa/Zr =bE/6r 0, we have
-10-Maxwell's equations immediately give
E. = o
6? 2 7 dt (4)
3
and taking G(r) *T (r) a we also have
b2 3 a 00 aT e
-ra
? I o 2 T~
eo ar7'0 (5)Then the current is hollow if
3 jo
a2T
e
10
CI
j0
0 < 3j - -- e + (6
a o 2T r 0 2 dt . (6)
This condition may be rewritten so as to display its physical meaning by defining a temperacure profile scale length
aT =r (7)
and then a skin time T a aT a o . In these terms the condition for a hollow current profile becomes
- - ) 1 T (8)
0
3TT<
In words: the profile becomes hollow if the scale time for the current increase is shorter than 1/3 the resistive skin time in the plasma center.
Now we suppose that the MRD instabilities have a regulating effect on the plasma temperature such that it can never evolve far from the marginally hollow state. We then dcduce the temperature evolution from the current evolution as follows: Write T 3 CT
I
(so that C is a function only of a T), then the marginal condition is
2
00
If we further assume that the current profile shape changes only slowly compared to the rise time, i.e.,
jo.d 1< dij(0
IS.
(L)V<
(10)
where I is the total current, then we may write
dj
0 Tdl
dt ' (11)
and the marginal condition gives T in terms of I: 01 di 2
T [ I/( )1 2 5 (12)
As an example closely approximating the experimental situation on Alcator A, we take I(t) =pk [l-exp(-t/T 1)], (where Ik is the peak plasma
current attained in the rise phase and T is the characteristic current rise time), in which case we obtain
St/T
T [1 . (13)
In Figure 6 we plot the temperature evolution predicted from this equation taking the appropriate values: aT 6 cm, Z = 1, Lin A - 15
T eff
and TI = 10 ms. Also shown are experimental values of central temperature deduced from electron cyclotron emission for a discharge exhibiting M!HD disruptions during the current rise phase. The agreement 13 remarkable,
-A
-12-considering all of the uncertainties, up to 16 ms when the temperature begins to saturaLe. This saturation is indicative of transport effects taking over the dominant role in determining T and the plasma moving away from the marginally hollow state.
The criterion, Eq. (8), is rather insensitive to the current rise rate as such. For example, for linear current rise, Eq. (8) is independent of the value of cij 0/dt. $owever, the temperature is indirectly affected by the current via the energy balance in the plasma. It is easy to under-stand that if the current at any time is small enough there will be in-sufficient ohmic heating power to sustain the plasma temperature at the marginally hollow state. In this case no disruptions may be expected to occur.
4. Numerical Integration of the Current Diffusion Equation
A computer code was used to integrate numerically the 1-D current diffusion equation
- rr
r--
( ) (14)SPO r TF TTr
in cylindrical coordinates, ignoring toroidal effects, using an explicit finite difference scheme. Classical Spitzer resistivity was assumed and the experimentally observed temperature was modeled by prescribing
T (r, t) e
r
0te (15)total current as
t/'r
pk(16)
Figures 7a and 7b show computed current and q-profiles respectively for typical disruptive current-rise conditions on Alcator A. A hollow current does indeed develop with an unstable local minimum of q well
inside the plasma. it should be noted that the ratio of q at the limiter
to the minimum q is between 1.5 and 1.8 during most of the rise phasz.
This corroborates the observation on Alcator A that the c.isruptions are internal, In addition we have attempted to simulate MHD disruptions. This was
done by anomalously increasing the resistivity by a factor of 10 end
en-forcing a large negative rate of change of electron temperature (-1or 0
whenever the current profile was hollow and the local minimum in q was near
integral: 0 < (m - q.) < 0.1. The code was then allowed to continue on after each "disruption" with the normal resistivity and pre.cribed
temperature rise rate. Figure 8 shows typical results. When the minimum q is integral the current profile flattens and the process repeats itself with the minimum in q decreasing with each successive disruption. Again note that
the disruptions are still internal, with the ratio of q /qn 1.6, and!
that the current profile evolves in a marginally hollow manner, consistent with experimental observations. Moreover, we calculate the voltage at the
vacuum bellows from the voltage at the plasma edge plus the inductive voltage due to the flux between the plasma and the
liner. In Fig. 8c we compare the calculated loop voltage for
-14-loop voltage. The agreement is very good, demonstrating that no sustained large resistance anomaly is required to allow current penetration.
We have also verified with the code that for typical Alcator A profiles, aT < 7 cm if the rate of temperature rise is
4
60 eV/ms, thegrowth of the current can occur without the formation of a hollow profile. This simulation does not address the various transport and radiation losses which influence the temperature profile during the rise phase. However, the electron temperature profiles and other prescribed parameters are consistent with the Alcator A data, and the current diffusion equation is independent of loss mechanism. Thus we have shown that with the given parameters hollow current profiles will form even when T is peaked on axis. Moreover the ratio of q at the limiter to the minimum q is con-sistent with.the observed qvalues during disruptions'on the assumption
that the disruptions are associated with near-integer values of the minimum q and are thus internal.
5. Discussion
We have presented evidence to show that the MRD stability properties of the current rise phase of Alcator are dominated by the current profile
shape well inside the plasma column. In particular a series of disruptions is observed arising from the formation of. hollow current profiles. The electron temperature evolves, always peaked on axis, at a rate which appears to be governed by the hollow current profile formation, in such a way
that a very strong current skin effect does not form.
.
The power balance within the plasma, as determined by current rise rate and electron density does not strongly influence the temperature rise rate as such. However, the severity of the disruptions necessary to dispose of any excess ohmic power and maintain the plasma near the
marginally hollow state is determined by these power balance considerations. We have found this effect to be of vital importance for thi operation of consistent well confined plasmas. The presence of strong disruptions in the current rise phase has been observed to degrade the plasma performance throughout the rest of the discharge. This degradation appears to be
related to impurity content which probably arises from strong plasma inter-action with the limiter or wall during severe disruptions.
The correct prescription for moderating the disruptions and thus achieving inipro'ved plasma conditions is to lower the current rise rate and increase the initial density, thus decreasing the ratio of ohmic power to rate of increase of plasma energy.
The processes determining the temperaturc profile shape remain unclear, though it seems probable that a certain minimum level of MHD activity may be necessary to maintain the peaked temperature profile. We note however that definitely hollow temperature profiles have been observed in the early stages of other machines [91 and so it may be that processes other than MHD are responsible for the Alcator profile shape. For example, our quite high initial density ( 3-5 x 10 13cm ) and associated recycling may be sufficient to keep the edge cool.
In attempting to apply our model to other machines a key relation is Eq. (12) predictin, the temperature for marginally hollow profiles as a function of current and temperature profile scale length. Given this
-16-temperature as a function of time, strong disruptions may be expected if the ohmic power much exceeds that necessary to increase the plasma energy accordingly. As is expected for a diffusive process, the result is that to
avoid severe disruptions the characteristic time of current rise should scale as linear dimensions squared.
[21 Mirnov, S.V. and Semenov, I.D., Fiz. Plasmi 4 (1978) 50.
[3] Fussmann, G. and Sesnic, S., "Investigations of Runaways in the Pulsator Tokamak", Max-Plank-Institut fur Plasmaphysik, Report III/ 37, Garching 1977.
[4] Renaud, C., TFR, private communication, Aug. 1978.
[5] Hutchinson, I.H. and Morton, A.H., Nucl. Fusion 16 (1976) 447. [6] Furth, H.P., Rutherford, P.H., and Selberg, H., Phys. Fluids 16
(1973) 1054.
[7] Stix, T.H., Phys. Rev. Lett. 36 (1976) 521.
[8] Hutchinson, I.H. aad Komm, D.S., Nucl. Fusion 17 (1977) 1077. [9] e.g., Dimock, D.L., Eubank, R.P., Hinnov, E., Johnson, L.C., and
FIGRE CAPTIONS Figure 1. Figure 2. Figure 3. Figure 4. Figure
3.
Figure 6. Figure 7. Figure 8.Oscillograms of plasma parameters during current rise phase, showing (top to bottom) loop voltage, V ; plasma position; plasma current, I ; central electron temperature, T
(from cyclotron emission); m = 3 pickup coil, m = 2 pickup coil. BT = 6 T.
Electron temperature profiles measured during current rise deduced from 20 radiation.
ce
Frequency of occurrence of disruptions versus limiter q value for a sample of 123 disruptions. IT = 6 T.
Loop voltage and measured poloidal field perturbations during current rise.
Location of disruptions with respect to plasma current, I,
p
and its time derivative, . For discharges significantly below the diagonal line , non-disruptive evolution is observed. Experimental observations (points) of central electron
temperature evolution and the theoretical evolution (line) for marginally hollow profile.
Results of computer simulation of current rise showing: (a) current profile evolution, plotted at 1 msec spacings;
(b) corresponding q profiles: BT = 6, I = 200 kA, T, = 10 msec, 0 = 80 eV/ms, aT = 6.16 cm. Disruptions were not modelled. Results of computer simulation for the case where B T 6 T,
I = 200 kA, T = 15 msec, r = 80 eV/vms, a T= 7.00 cm.
Disruptions were modelled. (a) Current profile (b) q profile (c) Voltage (dashed line) compared with experimental reaults (solid line).
POSITION
OUT
t
IN
j
Ip (
4
5
kA/d)
0-Teo (500 eV/d)
0-m=3
(19 T s~'/d)
___ WT y -- ~ rw~ k ~. ~--m = 2
(20 T s~'/d)
-+
t (5
ms/d)
A
20ms
16
1.0
keV
-+
12
8
4
I
I I10
0
Radial Position (cm)
F3
z
Te
A
+
+
0
-10
N S
c-YR.-0
V
(volts)
0
C-0
C-"0
N)
N)0
c-n
I I I I0
0
0)
D0 It P 0p
N) 0ooI (DwI
0
CD O 0 N) (40)
II IIU,
N II I,(4
If N)i0
0**
*** 00 610
S000
2
7
qso
0~0
\
0
0--00100
200
Ip kA)
20
9876 5
4
3
25
q (a)
Te
keV
1-5
1.0
0-5-0
5
10
15
20
25
Time
(ms)
... ... ... ... ... ... ... ...
Ln
... ...
C-)
C3 z Lr)c3 ... ... ... ... .... .... .... ... ... .. ... .. .. ... IC) 1-4 -n ... ... .... ... ... ... .... ... . ........ ... ...O-PROFILE
...
...
...
...
...
...
...
...
...
:
...
...
...
... ... ... . ... ... ... ... . ... ... ... ... ... ... . I ... ... ... . ... ... ... ... ... . ... ... . ... . ... ... ... .. ... ... ... .... .. ... ... ... ... ... , ... C3 q." C=-cr) C3 co C3r4
10
ri 7(b)
1-3
i ILl
6
BROWS (CM)
Ul. ... ... ... ... ... ... ... ... .. .. .. ... ... . . . .... ... C3 . ... ... ... ... .... ... ... ... .... ... ... . . ... ... . ... .. .. .. .. .. .. ... ... C3 c.n ... ... ... ... ... ... ... ... ... .. .. .. .. ... . ... ... C3 C3
Ln
C-)
C)
n
0
O-PROF i LE
0.0
Ll:0
rl :0
RRDIUS (CM)
cm
co .0 C3 LO cn CD ... ... : ... ... .../
... . ......
...
.... ......
....
...
...
...
...
...
...
... ... ... ... ... ... ... ... . ... ... .... . ... ... ... . ... ... ... ... ... ... ... .... ... ... : ... ... ... ... ... ... 1: ... ... ... ...2. 1 0
8:0
10.0
FZ3 9 W
tj ~ Ij