E-Commerce Drop shipping: Building a CPG Supply Chain
byChristopher Alan Creyts
Bachelor of Arts, Economics, University of Michigan, 2012 and
Nora Weisskopf
Master of Arts with Honours, International Business, University of Edinburgh, 2010
SUBMITTED TO THE PROGRAM IN SUPPLY CHAIN MANAGEMENT IN PARTIAL FULFILLMENT OF THE REQUIREMENTS FOR THE DEGREE OF
MASTER OF ENGINEERING IN LOGISTICS AT THE
MASSACHUSETTS INSTITUTE OF TECHNOLOGY JUNE 2016
0 2016 Christopher Alan Creyts and Nora Weisskopf. All rights reserved.
The authors hereby grant to MIT permission to reproduce and to distribute publicly paper and electronic copies of this thesis document in whole or in part in any medium now known or hereafter created.
Signature redacted
Signature of A uthor... . . . .
otef E eering in L istics Program
A May 11, 2016
Signature redacted
Signature of A uthor...
...
of Engineering in Logistics ProgramMay 11, 2016
Certified by...S
ignature redacted
Dr. Jarrod Goentzel Director, MIT Humanitarian Response Lab Thesis SupervisorSignature redacted
Accepted by... ... ... Dr. Yossi Sheffi Director, Center for Transportation and Logistics Elisha Gray II Professor of Engineering Systems MASSACHUSETTS INSTITUTE Professor, Civil and Environmental Engineering
JUN 3
0
2016
E-Commerce Drop shipping: Building a CPG Supply Chain by
Christopher Alan Creyts and
Nora Weisskopf
Submitted to the Program in Supply Chain Management on May 8, 2016 in Partial Fulfillment of the
Requirements for the Degree of Master of Engineering in Logistics
Abstract
Manufacturers and retailers are increasingly interested in exploring different ways to optimize their fulfillment of e-Commerce orders. An approach that is often considered is drop-shipping, where the manufacturer takes on the responsibility of shipping directly to the consumer. Retailers are interested in this model as it shifts their inventory responsibility upstream and frees up working capital. Manufacturers
are intrigued by drop shipping as a means of capturing lost sales on high-value, seasonal products that retailers might be under-stocking. These manufacturers currently lack the retailer-side inventory availability information to assess the extent of this opportunity. We propose a framework to show manufacturers and retailers how to examine the key issues of drop shipping such as capacity constraints, per unit distribution cost, changes in working capital, cost allocations in the supply chain and delivery time to customers. We also explore how to bridge information gaps to gauge inventory availability and lost sales using Web Extraction System data. We demonstrate our framework by partnering with a CPG manufacturer interested in implementing drop-shipping. Using their data from an existing facility and a selected retailer, we simulate drop shipping orders for a specific set of products during the holiday season that are normally fulfilled by the retailer. Firstly we show that in this scenario, the manufacturer will not exceed their current facility's capacity and will require minimal changes to their existing operations. Using Activity-Based Costing
(ABC), we then find that the overall channel costs are only slightly more expensive than those in the
traditional model. However, the manufacturer takes on a much larger portion of those costs than they would in the existing model. The transfer of the distribution labor and inventory holding costs from the retailer to the manufacturer drives these cost shifts. As expected, we found significant working capital benefits for the retailer when shifting to drop-shipping. To understand the potential gains that could be achieved from capturing lost sales, we paired data from a Web Extraction System with Point-of-Sale data to obtain previously unavailable retailer inventory information. Contrary to initial expectations for this scenario, the retailer displays very high inventory availability, making lost sales a weak justification for adopting this model. Lastly, using publicly available time-in-transit tables, we model the changes in delivery time that customers experience. The results show that the average delivery time increases by one day for most locations in the US. Our framework and analyses contribute to developing an understanding of the opportunities and implications of drop shipping. In addition, we introduce new techniques manufacturers can use to deal with asymmetric inventory information.
Thesis Supervisor: Dr. Jarrod Goentzel
Acknowledgements
We owe gratitude to Jarrod Goentzel for his guidance and insights throughout the writing of this thesis. In addition, thanks is owed to that one lady (Laura ... allegedly) who always unlocks the door for us every time we came to his office and forgot the passcode (1-2-3-5!)
We like to thank our thesis partner company for their support and incredible responsiveness throughout the thesis. We would also like to thank our friends and family for their love and support.
Table of Contents
Abstract ... 2
A cknow ledgem ents ... 3
Table of Contents...4
List of Figures ... 6
List of Tables.. ... 7
1. Introduction .... ... .8
2. Literature Review ... ... 10
2.1 The developm ent of e-Com m erce ... 10
2.2 The new e-Com m erce distribution m odel... 10
2.3 Stockouts and the new distribution m odel... 11
2.4 Drop shipping m odel...11
2.4.1 Drop shipping benefits to retailers ... 12
2.4.2 Drop shipping benefits to m anufacturer... 13
2.5 Estim ating lost sales...14
2.6 Im pact of delivery tim e on custom er purchasing behavior ... 15
3 M ethodology... 16
3.1 Project scope ... 16
3.1.1 Product and tim e period selection ... 16
3.1.2 Fulfillm ent center selection... 16
3.1.3 Retailer selection ... 17
3.2 D ata sources and m anipulation... 17
3.2.1 Data sources ... 17
3.3 Activity-Based Costing (ABC) ... 18
3.3.1 Process M ap ... 19
3.3.2 Activities ... 19
3.3.3 Productivity m easures ... 20
3.3.4 Base m odel assum ptions ... 20
3.3.5 Base m odel sensitivity analysis... 21
3.4 Total channel cost and cost allocation... 23
3.4.1 Base m odel...23
3.4.2 W orking capital...25
3.4.3 Calculations and assumptions m ade in base m odel... 26
3.4.4 Channel cost sensitivity analysis... 29
3.5 Lost sales estim ations...30
3.6 Custom er delivery tim e ... 31
4 Data analysis and results ... 32
4.1 ABC analysis...32
4.1.1 Base model ... 32
4.1.2 Sensitivity analysis - m odel simulations... 33
4.1.3 Cost comparison with existing cost... 34
4.2 Lost sales ... 35
4.2.1 Category A stockouts ... 35
4.2.2 Category B products...36
4.2.3 Analysis of SKUs experiencing stockouts or long period of "Not sold online" ... 38
4.2.4 Lim itations of Category B Data ... 40
4.3 Channel cost and cost allocation ... 42
4.3.1 Base m odel...42
4.3.2 Sensitivity analysis channel cost allocation ... 44
4.3.3 W orking capital shifts ... 45
4.3 Lead tim e...45
5 Discussion ... 48
6 Conclusion...52
List of Figures
Figure 2-1: Comparison of existing and drop shipping distribution model ... 12
Figure 3-1: Process M ap ... 19
Figure 3-2: Existing fulfillment process... 22
Figure 3-3: Cost items and cost allocation in current fulfillment model...24
Figure 3-4: Cost items and cost allocation in drop ship model... 24
Figure 4-1: Cost break-down per unit ... 32
Figure 4-2: Lines per order sensitivity analysis -unit cost comparison... 33
Figure 4-3: Cost comparison drop-ship and existing model ... 35
Figure 4-4: Breakdown of availability for Category A for daily samples taken in October, November and D ecem b er ... 36
Figure 4-5: Breakdown of availability for Category B for daily samples taken in November and December ... 3 7 Figure 4-6: POS Data and Website Availability for SKU A2 October - December 2016...38
Figure 4-7: POS Data and Website Availability for SKU B3 November - December 2016...39
Figure 4-8: POS Data and Website Availability for SKU A3 October - December 2016...40
Figure 4-9: Sales data for SKU B1-B3... 41
Figure 4-10: Sales data for SKU B4-B5, B7... 41
Figure 4-11: Sales data for SKU B6...42
List of Tables
Table 3-1: Productivity measures per activity in drop shipping... 20 Table 3-2: Productivity measures per activity in existing fulfillment ... 23 Table 4-1: Detailed per unit cost breakdown for existing and drop ship model ... 43
1. Introduction
This thesis assesses the viability of a large CPG manufacturer to distribute goods directly from its distribution centers to the customer on behalf of an online retailer (e-tailer), a practice which has been coined "drop shipping" or "direct-to-consumer". The work was initially motivated when a large retailer with both a physical (nationwide chain of stores) and online presence requested that one of their large manufacturers assume responsibility for order fulfillment (drop shipping) of high value products. We propose a framework that manufacturers can use when considering offering drop shipping to a retailer. The framework can help to guide their approach in evaluating the request.
In this thesis, we consider how integrating drop ship operations into a manufacturer's current distribution network would impact each facility's capacity. It is imperative that this new volume is considered in its own context- there are great differences between shipping pallets to warehouses and shipping consumer's individual packages. We also explore the incremental distribution costs a manufacturer incurs with the drop ship process. Fulfilling these individual orders will require additional labor cost and packaging materials. For example, the manufacturer will now be packing each order into cardboard boxes, a task which was previously paid for by the retailer. In addition, the manufacturer will now need to carry incremental inventory to fulfill consumer orders, which requires more working capital.
We build a model to better understand the overall supply chain costs and show how costs shift among the parties involved (retailer and manufacturer) under the drop shipping model. As these costs shift between parties and as the costs of the supply chain as a whole change, it is crucial that the manufacturer accurately accounts for its increased burden. It will need to consider modifying its agreement with the retailer to recover these costs or even charging a premium for the drop shipping service.
Complementing the cost discussion, we consider potential revenue benefits of drop shipping. In some instances, the manufacturer may choose to hold more inventory than the retailer did. This could reduce the number of stockouts and capture sales that may have been previously lost during periods of intense demand
at retailers. We propose a method to enable manufacturers to quantify this lost sales opportunity using web extraction tools to gather previously unavailable retailer inventory information. Another benefit, which is not quantified, is the potential for a more direct relationship with the consumer. As part of this relationship, the manufacturer must consider how lead times that consumers experience might be impacted.
In order to protect the CPG partner's identity and competitive strategy we have masked any identifying information including SKU name, location data and retailer information.
2. Literature Review
This literature review will highlight some of the recent developments in e-Commerce practices and the advantages and disadvantages of drop shipping through both a retailer's and a manufacturer's lens. The research will also explore the drop shipping model's potential to benefit from additional sales that would be otherwise lost due to retailer stockouts and the potential service impact on consumers.
2.1 The development of e-Commerce
The internet and information technology have significantly shaped today's consumer purchasing behavior and propelled the rise of e-Commerce. In 2013 alone, 191.1 million people were classified as online shoppers1 in the US, with an increase to around 215.1 million expected by 2018 (eMarketer, 2014). A survey of 39 retail executives developed by the consultancy Deloitte in 2011 projects that revenues from traditional sales channels would represent only around 63% by 2016, down from around 91% in 2011
(Gomez & Fritsch, 2012).
In the face of this change many large retailers such as Wal-Mart and Target have moved from the traditional brick-and-mortar stores to pursue omni-channel retailing models. In these omni-channel models, retailers retain their existing physical store networks and complement them with online channels.
2.2 The new e-Commerce distribution model
These new retailing models have necessitated a number of changes to retailers' supply chains, particularly in the area of order fulfillment. Typically, retailer distribution networks were designed and optimized to ship crates and pallets to physical retail stores. However, the orders coming through the e-Commerce channel require supply chains to accommodate picking of 'eaches' for the consumer (Jones, Lang and LaSalle, 2012). In addition, retailer networks were often not intended to cater to large numbers of geographically dispersed customers and lacked the distribution infrastructure to reach consumers within
I
Defined as having browsed products, compared prices or having bought an item online at least once (Statista, 2015)one to two days (Chaturvedi, Martich, Ruwadi, & Ulker, n.d.). This is further complicated by the consumer's expectation of having the ability to shop from a huge assortment of SKUs.
To address the large differences in supply chain requirements, many large retailers have adjusted their model by adding separate distribution networks to fulfill e-Commerce demand. Wal-Mart uses this technique today, servicing all of their e-Commerce orders through separate management and fulfillment facilities. In this new model, the product first travels from the manufacturer to a retailer's Distribution Center (DC). It is then forwarded to the retailer's e-Commerce DC network, from where it can be shipped directly to consumers via a parcel carrier. While this strategy allows retailers to address specific challenges that result from the unique profile of online orders, it also generates new issues we will discuss below.
2.3 Stockouts and the new distribution model
One of the key areas that can be impacted with this model is inventory stockouts. The separated e-Commerce distribution model can "lead to poor cross-channel coordination across channel-specific inventory pools and fulfillment processes, causing higher out-of-stocks and markdowns in any given channel, especially during peak seasons" (Chaturvedi et al., n.d.). Besides a lack of coordination, the above-mentioned stockouts in certain specific categories can also result from longer lead times. Now, manufacturers ship the product to a retailer DC, where it is unloaded, broken down, and then shipped to the retailer's e-Commerce DC- where it can then be used to fulfill orders. This extra step produces longer lead times and mean that the retailer has to hold increased levels of inventory, resulting in significantly higher holding costs than before. Due to these associated costs, retailers often choose lower stocking levels, which can result in lost sales. This is assumed to be a particular issue during peak holiday seasons and for high-value SKUs that incur higher holding cost (CPG Partner Company, Personal Communication, 2015).
2.4
Drop shipping model
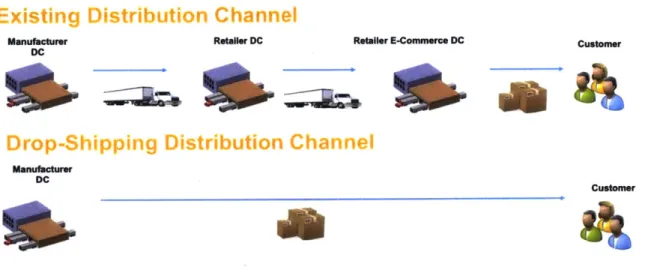
To address this potential challenge of lost sales, some retailers are exploring using drop shipping for certain product categories. In this model, a customer places an order on the e-tailer's website and the manufacturer ships the product directly to the customer's door. In a pure drop-ship model, the retailer carries no inventory
and only transmits a purchase order to the manufacturer who fulfills it, creating what researchers Randall, Netessine and Rudi call a "virtual supply chain" (Randall, Netessine, & Rudi, 2002) (see Figure 2-1) .CD retailer Spun.com was able to achieve savings of around $8 million by shifting its inventory to its distributor Alliance Entertainment (Gordon, 2000).
Manufacturer Retailer DC Retailer E-Commerce DC Customer
DC
Manufacturer DC
Customer
Figure 2-1: Comparison of existing and drop shipping distribution model
According to a study by Bailey and Rabinovich (2005), over 55% of CPG manufacturers claim that online retailers have inquired about drop ship capabilities. Manufacturers are wondering if drop shipping can be an effective alternative to other contract solutions aimed at solving inventory-holding issues (e.g. lower wholesale prices during holiday seasons, buyback contracts).
2.4.1 Drop shipping benefits to retailers
Much of the current research in the drop shipping area relates to the benefits to the retailer. According to Li, Tu and Guo (2011), retailers that rely on manufacturer drop shipping to fulfill their orders experience significantly lower holding and handling costs. This is because they once had to receive all of the product from the manufacturer into their own distribution center, store it, pick, pack and ship to customers. In the new model, they can pass all of those responsibilities to the manufacturer, allowing the retailer to focus on
marketing and advertising. It also allows retailers to offer a broader product variety with little risk (Randall, Netessine and Rudi, 2006) and increase profits from capturing potential lost sales.
2.4.2 Drop shipping benefits to manufacturer
Most of the literature frames drop shipping as a retailer focused tool and doesn't explore all of the potential benefits of drop shipping from a manufacturer's perspective. Some research shows that drop shipping can achieve significant gains for the manufacturer with regards to revenues, inventory holding and handling cost and negotiation power. Yu and Deng, for example, confirm that the usage of a drop-ship model can help manufacturers increase revenues by capturing lost sales and reduced advertising expenditures for suppliers (2013).
Chopra and Meindl (2007) suggest that the consolidation of inventories from multiple retailers at the supplier or manufacturer - known as risk pooling -results in better visibility in forecasting and the ability to provide high availability at lower inventory levels (Chopra & Meindl, 2007). The aggregation of inventory at the manufacturer can also often reduce inventory handling cost, although consideration needs to be given to the additional cost resulting from the re-packaging of full cases to individually packaged items (Chopra & Meindl, 2007).
Another interesting benefit to the manufacturer is the shift in negotiating power that occurs. Rabinovich, Rungtusanatham and Laseter (2008) note that because the customer delivery experience is so crucial to an online retailer's success, drop shippers have stronger bargaining power than retailers. It's easy to see how this advantage in negotiations can be exploited. With the new drop shipping model, the manufacturer is now paying for the distribution cost to the customer, and as such, it will be able to re-negotiate the per-unit wholesale cost that they charge the retailer to account for this new expense and potentially an additional margin leading to increased profits. Empirical evidence for this phenomenon has been shown by Scheel (1990).
2.5
Estimating lost sales
One of the key advantages from drop shipping from a manufacturer's perspective is the potential to capture lost sales. However, it's very difficult to estimate the impact lost sales have on a business. Even for retailers, who have both Point-of-Sale (POS) and inventory availability data, estimating lost sales can be complex because unmet demand goes essentially unobserved (Agrawal & Smith, 2015). There have been a number of techniques that have been used in research to account for this unmet demand. In the case where demand distribution is known, lost sales can be estimated using classic inventory theory as seen in Zipkin (2000). When demand distribution is unknown, Conrad (1976), Anupindi et al (1998) and Nahmias (1994) have
used Maximum Likelihood Estimation (MLE) for their lost sales estimations. MLE uses an existing data set to choose the values of a given number of parameters in a model that maximize the likelihood of these being accurate (Agrawal & Smith, 2015).
The challenge with many of these techniques is their reliance on data availability. Manufacturers are at a disadvantage from a data perspective. They have both limited POS data from their retailers and virtually no visibility to retailers' inventory availability. This lack of data makes it difficult to estimate the impact of lost sales.
It's possible that information technology can help manufacturers solve this lack of retailer-side inventory information. Almost all e-Commerce stores display some sort of product availability information (in stock, out of stock etc.) on each product's webpage or somewhere in their online store. For firms with a broad product line and multiple retail partners, collecting this data by hand from each product's page daily would be a monumental task.
It is possible that a group of tools that are currently being widely used in other business intelligence applications could be adapted to enable the data collection. These tools are known as Web Extraction Systems. They are designed to automatically scour the internet, accessing pages with dynamic content. The tools can target specific data types, extracting them from each individual page and creating a database with the desired information (Baumgartner, Gatterbauer, Gottlob, 2009). They've emerged as a growing part of
most firms' competitive intelligence arsenals in the modem business environment and can be customized to focus on specific tasks (Ferrera, De Meo, Fiumara, Baumgartner, 2014).
This type of information extraction from the internet has been applied in the retail context before to look at inventory levels. Dewan, Freimer, & Jiang (2007) explore how retailers can use these techniques to monitor competitors' inventory positions, dynamically raising prices during supply shortages to maximize profits. Their research demonstrates that this retailer inventory data is extractable and can be used as an approximation to better understand trends in stockouts.
Lastly, one needs to take into consideration that the effect of stockouts goes beyond lost sales. According to a report by Procter & Gamble (P&G) from 2007, "a variety of strategic and operational costs apply to both retailers and suppliers including decreases in store and brand equity and attenuated impact of promotions and trade promotion funds. Out-of-stocks create a ripple effect by distorting demand and leading to inaccurate forecasts " (Gruen, Corsten, & Grocery Manufacturers of America, 2007). The complexity surrounding a consumer's experience with stockouts necessitates careful considerations by both manufacturers and retailers alike.
2.6 Impact of delivery time on customer purchasing behavior
The above discusses drop shipping's impact on the manufacturer and the retailer. However, any potential effect on the customer's experience must also be considered. In most aspects of the e-Commerce transaction there will be no difference to the customer, although delivery times may vary based on the facilities where the manufacturer would establish drop shipping capabilities. In their study on online customer satisfaction Schaupp & Belanger (2005) and Anand (2007) show that the minimization of delivery times plays an important role in purchasing behavior and customer satisfaction. Furthermore, online customers are increasingly demanding shorter lead times since they see themselves as "time starved" (Collier & Bienstock, 2006) -the ability to fulfill these time frames plays a critical role when deciding whether an item
3 Methodology
This section elaborates on the methods and estimations used to develop the framework applied for this thesis.
3.1 Project scope
3.1.1 Product and time period selection
As highlighted in the literature review, drop shipping is a particularly attractive option for high-value SKUs with high holding costs that experience significant spikes in demand. These products show the most promise of capturing previously lost sales. The thesis focuses on two specific high-value personal appliance product categories. From these two categories, we selected the 12 fastest moving SKUs, which experience almost 80% of their annual volume during the holiday season. We also limited the selection to SKUs with high retail prices2 as these would have significant impact in terms of holding cost, hence a greater risk for experiencing stockouts and a greater potential in terms of capturing lost sales. In order to maintain anonymity, SKUs were named using a combination of their product category (A or B) and a numerical value (1, 2, 3...). We only considered the primary holiday season from September through December to reflect the CPG manufacturer's focus.
3.1.2 Fulfillment center selection
The CPG manufacturer already has an existing facility that is currently running a small consumer shipping operation and has consumer parcel shipment capabilities. We focused the analysis on utilizing this current operation to handle all of the projected drop shipment volume. Therefore, we did not explore the capital costs of building a new facility.
3.1.3 Retailer selection
Similarly, to limit scope, we focused on one retailer where the CPG manufacturer's products are sold. The retailer is one of the CPG manufacturer's largest sales partners and has physical stores as well as a large online customer base. We simulated transitioning 100% of e-Commerce orders on the selected SKUs at the retailer to fulfillment with manufacturer drop shipping.
3.2 Data sources and manipulation
The research used data gathered from the CPG manufacturer's internal databases and data from a Web Extraction System externally acquired by the CPG manufacturer. The information provided was complemented by interviews with the existing distribution facility's leadership team as well as leaders from the e-Commerce supply chain team at the manufacturer.
3.2.1 Data sources
The following data sources were used in the analysis:
* Detailed data for the CPG Manufacturer's existing drop shipping operation including: o Customer volumes (orders and lines) being processed by the existing facility
o Labor cost (fully-loaded cost for current Full-Time Employees (FTE))
o Labor productivity measures (units per hour and effectiveness) for processing activities such as picking, replenishment, audit and manifest, packing, receiving and put-away
o Materials cost for packaging and labeling
o Transportation cost data from existing parcel operations to estimate average cost per package and total transportation cost
* Cost data for current distribution model: The dataset provided information for the chosen product categories for:
o Inbound and outbound processing costs
" Outbound shipment data: Historical outbound shipment information for the selected product categories to the chosen retailer during the selected time period (provided by manufacturer).
* Daily POS data: Approximately 11,000 records of unit sales data for the chosen SKU sample sold through the retailer's e-Commerce platforms. The data covered the time period from January 2015 -December 2015. Each record represents the unit sales quantity of a single SKU on a given day. " Web Extraction System data: Output from an online web extraction system including approximately
10,800 records. Records only include data for the two chosen product categories sold on the chosen retailer's website recorded on a daily basis. Each record contained information on the name of the product, its Universal Product Code (UPC) and its availability on the retailer's website on a given day between May - December 2015.
3.3 Activity-Based Costing (ABC)
In order to assess the cost associated with drop shipping, we utilized Activity-Based Costing (ABC). ABC is a common method used to allocate indirect costs based on distinct cost drivers for individual processes or activities. This is in contrast to financial accounting, which allocates indirect costs with a simpler approach that does not effectively capture operational differences that are critical for this analysis.
Using data from existing drop shipping operations and historic POS data, we built a model that calculated the costs for drop shipping all orders of the two personal appliance categories from the retailer's website between mid-September to December. The model only considered the variable cost per order incurred rather than any fixed cost associated with the operation. This cost was then compared with the existing variable cost for fulfilling orders in the current system. Below we outline the process and activities that were considered in the model.
3.3.1 Pr'ocess Map
The process to drop ship a SKU is mapped out in Figure 3.1 below.
Shipment From DC Receive &Putaway Replenish Each Pick Audit &Manifest Pack Shipment to
Customer
F igiuret .;-- : Prlocess Map11
3.3.2 Activ it ies
The incremental cost of adding volume to the current facility was calculated per line item shipped.
Using ABC, the incremental indirect costs3 were assigned to the following activities:
1. Receiving/Put-away: The receiving and (if required) breaking of shipments into cases arriving from
within the co-located mixing center or other manufacturer-owned mixing centers. The cases are put away in a separate co-located inventory storage area specifically designated to drop shipping operations.
2. Replenishment: Process of replenishing cases from the co-located inventory storage area to a picking
area with racks.
3. Each Pick: The process of picking a line item from the racks in the picking area.
4. Audit and Manifest: The process of verifying whether orders included all line items and the printing
of a manifest stating the contents of the order.
5. Pack: The process of packing the order into a corrugated box.
In addition to the processes outlined above, material costs (box and tape) were included in the model.
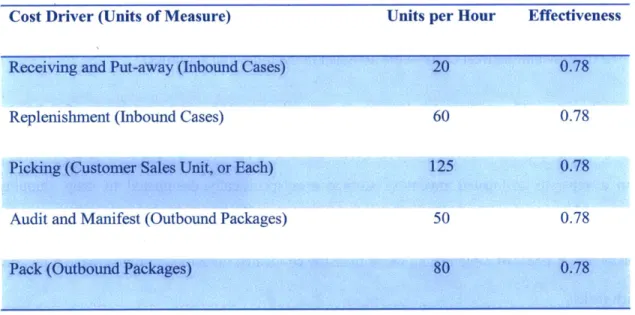
3.3.3 Productivity measures
The activities above can be divided into two primary categories: packaging material cost and labor cost. Labor costs are determined primarily by labor productivity (units processed per hour) and effectiveness (how effective employees are at their tasks).
Measures for labor productivity and effectiveness for different activities were based on observations and data obtained from the CPG manufacturing company.
Table 3-1: Productivity inea sures per activity in drop shipping
Cost Driver (Units of Measure) Units per Hour Effectiveness
Receiving and Put-away (Inbound Cases) 20 0.78
Replenishment (Inbound Cases) 60 0.78
Picking (Customer Sales Unit, or Each) 125 0.78
Audit and Manifest (Outbound Packages) 50 0.78
Pack (Outbound Packages) 80 0.78
3.3.4 Base model assumptions
The model was developed under a number of restrictions/assumptions. These include:
* Lines per order: It was assumed that the average number of line items was 1. Given the high value
of the SKUs it was likely that consumers would only order one unit at a time. The CPG manufacturer validated this assumption.
* Inbound case size: To calculate the average number of units per inbound case we used the weighted
average (by order volume) across all SKUs considered. This resulted in an average of 2.57 units per case.
" Drop shipping process: We assumed that each inbound case coming into the warehouse follows
the process outlined in Figure 3-1. In reality, a small portion of the cases would be placed directly on the racks in the picking area without first going to the co-located inventory storage area.
* Labor flexibility: It was assumed that labor hours were flexible and new labor could be added
instantaneously to exactly match needs. For example, if the model indicated a need for additional 0.3 FTE this could be added without consideration of full-time or part-time hiring capability.
* Labor Week: We assumed a standard 40-hour workweek for each FTE.
* Labor Rate: A fully-loaded labor rate of $22.00 per hour was given by the CPG partner company. * Material Cost: Materials used in the process included standard 11 x 6 x 4 inch corrugated box,
estimated at a cost of $0.73 and tape at a cost of $0.06 per package. If the lines per order exceed 1, then the model can account for the larger box size as necessary, substituting an appropriate proportion of 18x12x1 1 boxes which cost $1.16 each with a tape cost of $0.08.
* Transportation: It was assumed that all SKUs could be sourced from within the co-located DC
and would not require transportation from another manufacturer DC in the network. It was assumed that the retailer would be responsible for shipping cost to customers and this was therefore not included in the model.
" Sales: The base model did not include the capturing of lost sales and only simulated transitioning
100% of e-Commerce orders currently fulfilled by the retailer.
3.3.5 Base model sensitivity analysis
In order to understand the impact of the assumptions, we conducted a sensitivity analysis modifying a number of the parameters.
Lines per order
The sensitivity analysis tested how varying the lines per order would change cost. This may be particularly interesting when looking at promotions (e.g. "buy one, get one half price"). Box sizes are adjusted depending on the number of line items processed.
Increased volume and Capacity Constraints
The facility in our study has ample space to be able to process up to 6000 lines a day, which is almost three times as the facility processes today. This is a fairly unusual case as most facilities would not have such underutilized space and would need to incur additional cost to add more volume to their operation. One of the drivers of drop shipping would be the capturing of lost sales, which would increase the total volume transferred in the base model. We therefore added different levels of incremental sales expected from capturing lost sales ('Holiday Factor') to test the capacity constraint.
Different levels of laborflexibility
The model assumed that labor could be hired instantaneously in any amount. We tested two different scenarios where labor could only be hired'in increments of either 20 or 30 hours per week. This could be expected to be the case in companies where high levels of unionization prevail.
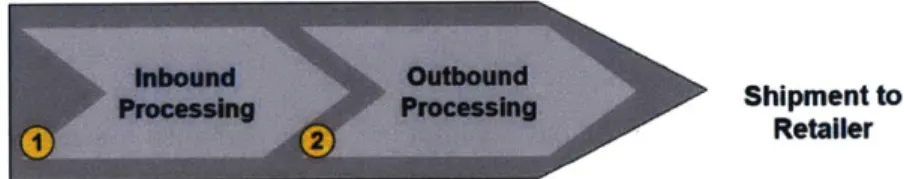
3.3.6 Existing cost
In order to understand the cost implications of drop shipping, we compared its projected cost with the existing fulfillment cost. Currently, the only activities conducted by the manufacturer in fulfilling e-Commerce orders are shown in Figure 3 -2.
Inbound Outbound
Shipment from Factory Processing Processing Shipment to Retailer
The activities shown in Figure 3-2 contain the following activities:
1. Inbound Processing: All administrative functions related to processing a full pallet received from the manufacturing plant including receiving and put-away.
2. Outbound Processing: All administrative functions related to preparing a full pallet for shipment including shrink-wrapping and truck loading.
The following productivity measures were obtained from the CPG manufacturer for the above process.
Ta)Ie 3-2: Productivity icasures per activity in existing fulfillment
Activity Pallets per Hour
Inbound Processing 38
Outbound Processing 28
As in the drop shipping model, the retailer is absorbing transportation costs.
3.4 Total channel cost and cost allocation 3.4.1 Base model
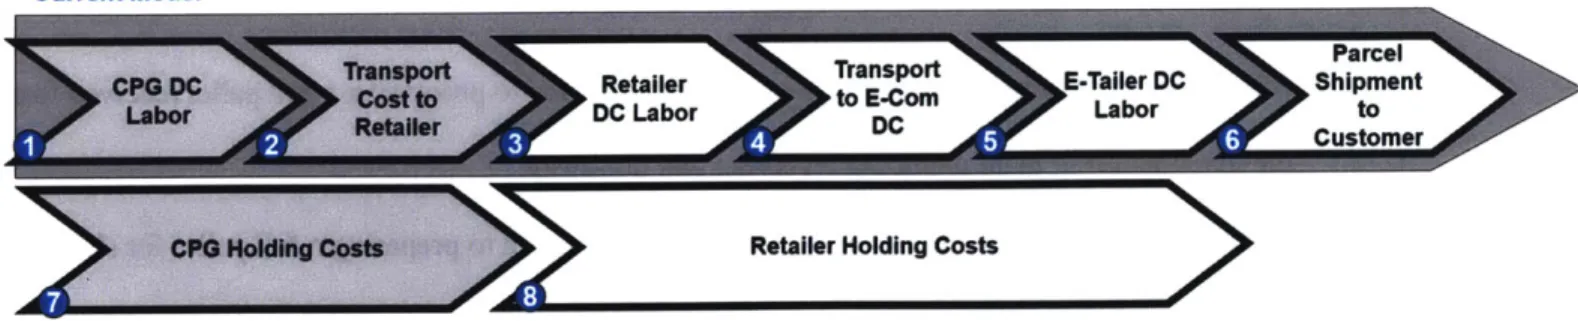
To understand changes in overall channel cost and how these would be allocated, we compared the costs per unit in the current and the drop ship model. This demonstrated how the total channel distribution costs changed, and how each channel partner's costs changed in relation to each other. The latter is illustrated in Figure 3-2 and 3-3.
Parcel
CPGDC Transport Retailer Transport E-Tailer DC Shipment
Labor RetierDC Labor to E-ComLabor to
Retailer DC . Customer
CPG Holding Costs Retailer Holding Costs
Figure 3-3: Cost items and cost allocation in current fulfillment model rot
( pic, Shadi ( t ! t . I I.Mdet
Drop Ship Model
New CPG DC Labor Parcel Shipment tocustomer
CPG Holding Costs
Fi(JIre 3-4: Cost items and cost allocation in drop ship mlodel
Because we were only able to obtain data from the manufacturer, we had to estimate some of the retailer's costs.
In keeping with the cost factors outlined in figure 3-2 and 3-3, the following categories were included in the analysis:
1. CPG DC labor -This includes all the processing and labor involved in processing a unit at the CPG manufacturing company. This is equivalent to the existing costs described in 3.3.6. 2. Transport cost to retailer DC - This includes the transport of the unit from the manufacturer
DC to the retailer DC.
3. Retailer DC labor -At the retailer, the pallet gets broken up and is separated into cases that remain in the Retailer DC and some that are moved to the e-Commerce DC.
W,
F,
If4. Transport from retailer DC to retailer e-Commerce DC -Once broken down, the retailer ships the cases designated for e-Commerce to a nearby e-Commerce DC.
5. Retailer e-Commerce DC labor and material - At the e-Commerce DC, the cases are broken down into units, processed and shipped to the customer. The processing activities are similar to those analyzed in the drop-ship model (see 3.3).
6. Parcel shipment to customerfrom e-Commerce DC -This includes the shipment of the unit to the customer by a parcel delivery from one of the retailer's e-Commerce facility (paid for by the retailer).
7. Retailer holding cost -In order to provide a complete picture in terms of cost we also
included retailer inventory holding charges for the time in which the units were stored within the retailers DC network (both the retailer DC and the e-Commerce facility)
8. CPG holding cost - Cost of holding inventory to fulfill retailer orders.
To draw a comparison between the two models the following costs were considered for the drop ship model:
1. CPG DC labor and material in drop shipping - This includes all the activities involved in processing units for drop shipping (see 3.3.6).
2. Parcel shipment to customer from manufacturer DC in drop shipping - This includes the shipment of the unit to the customer by a parcel delivery from the manufacturer's DC.
3. CPG holding cost in drop shipping -Cost of holding inventory to fulfill customer orders.
3.4.2 Working capital
In addition to comparing the distribution cost for the different models, we also looked at how these changes would affect the manufacturer's and retailer's balance sheets in terms of working capital. Working capital was estimated based on the average daily inventory that would be held by each party in the system.
Calculations and assumptions made in base model
The channel cost and cost allocation model was developed with the following calculations and under a number of restrictions/assumptions. These are detailed below:
* Transport cost to retailer: To calculate the transport cost to the retailer we used historical data from
the manufacturer's transportation team. We estimated an average cost per shipment for the product categories to the retailer's distribution network to be $0.20 per unit.
* Retailer DC labor: As we did not have retailer DC costs, we used an estimate based on the
manufacturer's distribution costs. These costs are comparable given that the manufacturer and the retailer perform extremely similar functions on full pallet level loads.
" Transport from retailer DC to retailer e-Commerce: To estimate the cost of transportation from
the retailer's DC to its e-Commerce DC, the CPG partner company provided us with an estimated cost for full truck load shipments for a distance of 100 miles using their proprietary estimation formula. This represents the average distance between the retailer's DC and its e-Commerce DC. The cost is approximately $0.11 per unit.
* Retailer e-Commerce DC labor and packaging materials: To calculate the retailer's labor cost for
preparing an individual unit for shipping we used an estimate based on the manufacturer's DC labor and packaging material costs and inflated the costs to $1 to account for the extra step of individual unit break packs to ship out the product.
* Parcel shipment to customer from e-Commerce DC: For parcel shipments, we used an estimate
provided in the data from the CPG manufacturer and lowered it by 10% to account for the fact that the retailer receives lower rates due to their higher volume and they are shipping shorter distances out of multiple facilities. The cost for shipping a parcel was estimated at $5.0 per package.
* Retailer holding cost in existing model:
o Holding Cost: We used the retailer's cost of capital to calculate the total holding cost. We only looked at the cost of capital because the products have long shelf lives and experiences low 3.4.3
obsolescence. This assumption was maintained when calculating the holding cost of the manufacturer. Cost of capital for the retailer was obtained from publicly available financial data regarding value of debt and equity and was estimated at 5.43% [Stock-analysis-on.net, 2016]. The total holding cost for the period was divided by total number of shipped units to get per unit holding cost.
o Inventory Days: Inventory days (the number of days a SKU spent in inventory) were calculated based on e-Commerce designated inbound shipments to the retailer and POS data. Using daily information for how much inventory entered and exited the system, we were able to estimate average inventory levels. For SKUs where no shipment data was available, inventory patterns for SKUs with similar sales patterns were applied.
o Formula: 12 119 H = i [lik - Oik +
N
i=1 k=1 12 119 S = Oik i=1 k=1 H- = Holding cost per unit shipped S
i= SKU V= Capital cost %
k- day (119 days total from 9/1/15 12/31/15) 1ik = inventory receipts for SKU i on day k (inbound shipment qty in units)
C=wholesale cost ($)
Oi=inventory
outflow for SKU i on day k (Qty Sold in units) N=day's starting inventory in units S=Total Units ShippedH= Total Holding Cost
* CPG holding cost in existing model: To calculate the CPG manufacturer's holding costs we used the following data/assumptions:
o Holding cost: We used the CPG manufacturer's cost of capital as obtained via the CPG partner (6%). For each SKU this was multiplied with its Cost of Goods Sold (COGS).
o COGS: Since only wholesale price to the retailer was available, we had to make an estimate what the actual COGS were. Based on a study conducted by consultancy PriceWaterhouseCooper (PriceWaterhouseCoopers, 2015), the median profit margin for CPG manufacturers is around 36%. We used a conservative estimate of 30% profit margin to approximate the COGS in this case. o Inventory Days: Based on interviews with the CPG company's leadership, we used an average
inventory turnover of 20 days. This means we assumed each SKU spent 20 days in inventory. We multiplied this with the total number of outbound shipments to the retailer.
o Formula: 12 119
H
-*
Iik
*
T
365
i=1 k=1 12 119 S = YYlik i=1 k=1 H- = Holding cost per unit shipped
S
*Where T=20
i=SKU Number V=annual capital cost (%/year) k- day (Date from 9/1/15 lik= inventory receipts for SKU i on to 12/31/15) day k (inbound shipment qty in units)
Ci=COGS ($) for SKU i T= avg. inventory turnover period (days)
* CPG DC labor and packaging materials in drop shipping: We used the analysis from the ABC exercise described in section 3.4 to build a labor cost per unit for the CPG Manufacturer.
* Parcel Shipment to Customer from manufacturer DC in drop shipping model: We used existing data from the current drop shipping operations at the CPG manufacturer to estimate the base costs per package. This was then adjusted to account for the fact that the CPG company would use the retailer's
customer code, which would attain more favorable rates. Cost per parcel was estimated at $6.30 per package.
* CPG holding cost in drop shipping: To calculate the CPG manufacturer's holding costs we used the following data/assumptions:
o Cost of capital and COGS: The same assumptions as made in the existing model were made to calculate the cost of capital and the COGS for the CPG manufacturer.
o Inventory Days: In order to calculate CPG manufacturer's total inventory days we assumed an average inventory turnover of 51 days which was obtained through the manufacturer and validated by the company's most recent financial statements.
o Formula: 12 119 H = 1
36
*
lik * T i=1 k=1 T=51 12 119 S = lik i=1 k=1 H-= Holding cost per unit shipped
S
i=SKU Number V=annual capital cost ($/year)
k=day (Date from 9/1/15 to 12/31/15) lik =inventory receipts of SKU i on day k (inbound shipment qty in units)
Ci =COGS ($)for SKU
i
T=Avg. inventory turnover period (days)3.4.4 Channel cost sensitivity analysis
number of the parameters. We also designed the analysis to show where the cost equilibrium was between the two models to answer the question: when does drop shipping becomes a better option than the current model?
Drop Shipping Parcel Transportation Costs
Because we only had data from the current manufacturer shipping operations, we recognize that there is uncertainty for this variable, which represents a large portion of the distribution costs. We expect the retailer to receive better rates- we will vary this cost to see how these changes impact the model.
Retailer DC Labor Costs
The retailer e-Commerce DC labor costs were estimated based on the CPG DC labor. In reality it could be significantly higher or lower, depending on the efficiency of the specialized each-picking operation that the retailer runs.
3.5 Lost sales estimations
As mentioned in the Literature Review, capturing lost sales has the potential to be a considerable revenue driver for a manufacturer and could provide a strong justification to move towards drop shipping. To attempt to measure lost sales we used an external Web Extraction System that was purchased by the CPG manufacturer. This gave us some visibility to critical inventory availability data that we would not have otherwise. The system uses an algorithm to extract data from the target retailer's web store. It is able to log the availability of the product on a particular website, and save this data to a database. There are 5 possible result categories:
* In Stock: The product is available for purchase on the website
* Out of Stock: The product is displayed on the website but not in stock
* Marketplace: The product is sold through a third-party provider
* Not sold online: The product is not displayed on the website
On occasion, no data were recorded on a particular day. We labeled these days as "No Data". In the majority of these cases, the Web Extraction System had not begun tracking the information for this product or experienced technical problems. The objective in using these data was to identify the magnitude of the impact of lost sales, and if we needed to account for extra unit volume in the drop shipping projections. For this purpose, we paired daily POS information with daily website availability information for each product across the peak holiday period.
3.6 Customer delivery time
To estimate approximate customer delivery times with the new drop ship service, we used a time-in-transit table calculator from UPS. We coupled this information with population density data to understand where the majority of orders would come from and to obtain a weighted average delivery time for the whole network. This gave us an indication of how quickly the CPG manufacturer could fulfill orders out of its only facility.
U'
4 Data analysis and results
This section presents the results of the analyses outlined in the Methodology section. It serves to identify the cost associated with drop shipping and its impact on total channel cost as well as its distribution across channel actors. We also assess the presence of lost sales and the effect that drop shipping out of the existing facility would have on delivery time.
4.1 ABC analysis
4.1.1 Base model
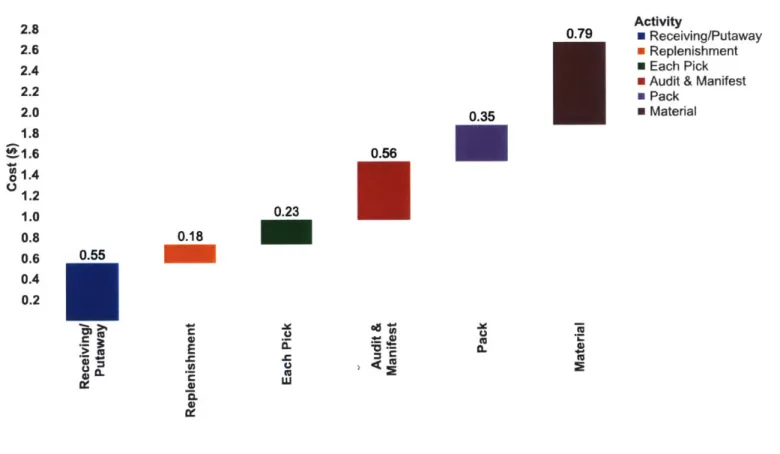
The analysis from the base model showed that shipping a unit out of the existing facility within the given parameters resulted in a variable cost of $2.66 per unit. Figure 4-1 shows the cost breakdown per unit shipped. n 70 0.35 Activity m Receiving/Putaway Replenishment " Each Pick
" Audit & Manifest * Pack " Material 0 SR 0.23 0.18 0.55 E CL a) U 0~ a. U
Figure 4-1: Cost break-down per
unit
2.8 2.6 2.4 2.2 2.0 1.8 1.6 01.4 1.2 1.0 0.8 0.6 0.4 0.2
As Figure 4-1 shows this cost is largely driven by the high packaging materials cost (almost $.80 per unit). This is followed by put-away/receiving cost and audit and manifesting activities, which are $0.55 and $0.56 respectively.
4.1.2 Sensitivity analysis - model simulations
As elaborated in the methodology section, a number of assumptions were made in the base model. To understand the impact of changing these assumptions, sensitivity analyses were conducted based on varying the following three inputs in the model: (i) Lines per order (ii) increased volumes during holiday seasons (holiday factor) (iii) more restrictive hiring policies.
Lines per order
Changes in lines per order considerably change the cost of drop shipping a unit. As Figure 4-2 shows, this is driven largely by changes in audit & manifest, pack and material cost. The variable unit cost is 30% lower (packaging and material efficiencies) when doubling the lines per order.
Activity
m Audit & Manifest i Each Pick * Material " Pack * Receiving/Putaway " Replenishment Waa) 0~4
L ies per ordecr sensiliN itIN '1mmmaN Ss
(n 0
00
LO C4
init cost comipai-isonl
2.5 2.0
1.5
1.0 0.5 CL 0 B, 0 M.0.0
Iiguire 4-2:Increased volume during holidays ('Holiday Factor')
In the base model it was assumed that 100% of the volume being sold online would now be processed through the existing facility. However, the increased availability of the products could lead to fewer stockouts and the potential capturing of lost sales. The model therefore included a 'holiday factor' where total volumes for each of the months in the holiday season - October, November and December - could be adjusted. The reason for adjustment was less focused on the cost aspects of the model as it only calculates variable costs, which increase linearly, but to understand capacity constraints that may occur at the facility.
The current facility is able to handle up to 6,000 lines per day. Once this daily level is reached, the facility will not be able to handle any additional volume. The model showed that even with an increase of 10% of their current volume (during the peak months) capacity would not be reached. Only with an increase in sales volume by 38% of current volume in December (the highest volume month), the facility would experience capacity constraints.
Labor Flexibility
The base model assumed that labor could be adjusted instantaneously. In order to understand the sensitivity of the model to any restrictions in labor hiring policies we considered two scenarios. In the first scenario, new workers could only be hired in increments of 20h a week (50% of FTE work time). In the second scenario, workers could only be hired in increments of 30h a week (75% of FTE work time). The analysis shows that the total labor cost increases by 4% and the variable cost per unit increases from $2.66 to $2.73 when restricting labor flexibility to hiring at a minimum of 20h per week. A 10% increase in total labor
cost and a variable cost increase from $2.66 to $2.85 can be seen when restricting hiring to 75% FTE.
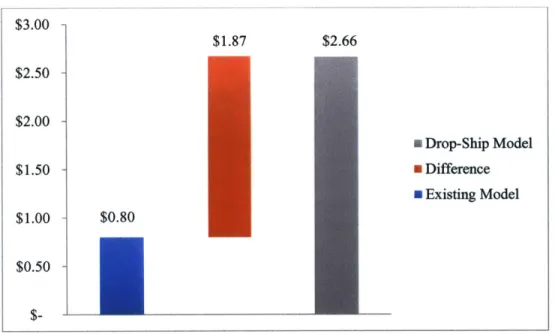
4.1.3 Cost comparison with existing cost
To understand the cost implications of using drop shipping a comparison had to be made with existing fulfillment cost (see Figure 4-3).
$3.00 $1.87 $2.66 $2.50 $2.00 Drop-Ship Model $1.50 Difference m Existing Model $1.00 $0.80 $0.50
Figure 4-3: Cost comparison drop-ship and existing model
As Figure 4-3 shows, the cost difference between the current and the existing model is around $1.87 per unit shipped.
4.2
Lost sales
In order to understand the potential opportunities to capture lost sales using drop shipping, data from a Web Extraction System was analyzed and paired with POS data. Below we summarize some of the key insights derived from the analysis.
4.2.1 Category A stockouts
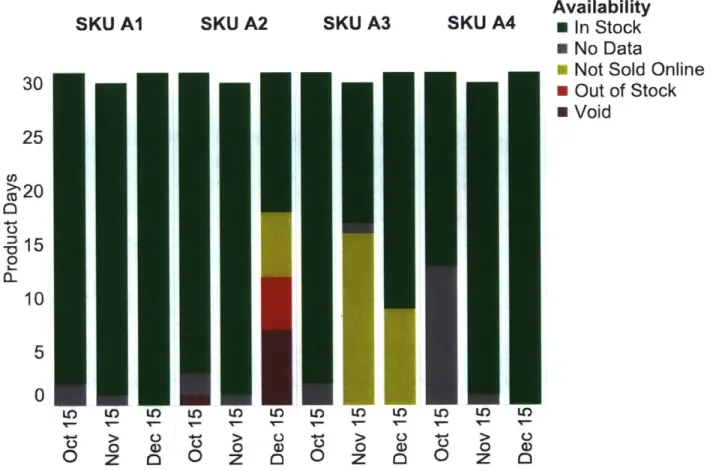
Online availability for four different category A SKUs was analyzed. For most SKUs, data availability was robust with the exception of SKU A4, which had no information for early October.
As Figure 4-4 shows, SKUs appear to be in stock for most of the high-demand season. This is particularly impressive for SKU Al, which is the fastest selling SKU in category A with over 12,000 items sold during the holiday season.
35
Availability
SKU Al
SKU A2
SKU A3
SKU A4
* In Stock
* No Data
Not Sold Online
30
m
Out of Stock
* Void
25
>20
-015
0
5
0
LO ~~~ Mo LO U' LO L nO n o LO U) V 0 for> L)> UL ) ) 0 C a 0 Z 00 Z 0 Z0 0Zo z o
ze
oz
CFigure 4-4: Breakdown of availability for Category A for daily samples taken in October, November
and Deceiber
SKU A2 appears to have been stocked-out during a five-day period from December 10-15. On December 12, the SKU appears to be in stock before going out of stock again on the following day. SKU A2 became available on 'Marketplace,' which is the term for third party sales on the website, on December 16; this is possibly as a result of the prolonged stockout. SKU A3 experienced another incident in which it was flagged as 'Not Sold Online' for a number of days. This may signal an availability issue. SKU A2 and A3 will be further analyzed in Section 4.2.3.
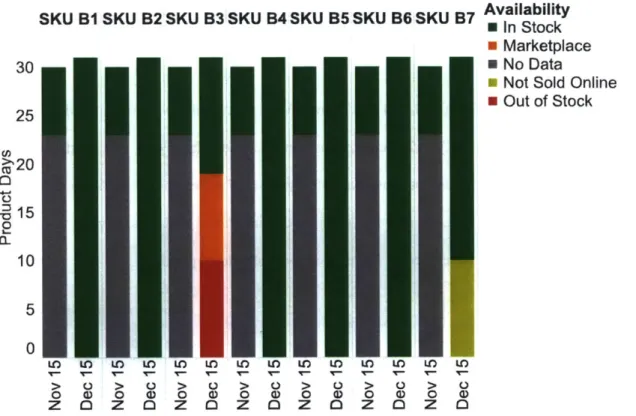
4.2.2 Category B products
Online availability for seven category B SKUs was analyzed. Data availability was more limited for category B products - for all SKUs analyzed, data was only available from November 2 4" until the
November. However, we believe that this is not a major issue. We verified with POS data that the sales peaks occurred after late November and are included in the Web Extraction Data set. A more detailed analysis can be found in Section 4.2.4.
SKU BI SKU B2 SKU B3 SKU B4 SKU B5 SKU B6 SKU B7
zO 0
z
L0 C) 10) 0 z 1C zO 0 zI
10 0 a, C z0 1C 10 0 z 10 zO 0 z L0 0 10 0 z Availability mIn
Stock Marketplace * No DataNot Sold Online
v Out of Stock
I
100
a,
ci
Figure 4-5: Breakdown of availability for Category B for daily samples taken in November and D)ecenher
As Figure 4-5 shows similar findings were made for category B products. General availability was high for most category B SKUs. Particularly noteworthy is that SKU B2, the fastest moving SKU, shows complete availability throughout the period. An exception is SKU B3, which experienced a stockout between December 2-8, from December 11-12, and again on December 15. This points towards a potential opportunity to capture lost sales.
p
30 25 M20 0 10 5 0-J
4.2.3 Analysis of SKIJs experiencing stockouts or long period of "Not sold online"
In order to gain a better understanding of the potential impact of the stockouts that occurred in SKU A2 and the SKU B3, availability data was matched with daily POS data for online sales from the retailer. We also analyzed SKU A3, which is indicated as "Not sold online" for a prolonged period.
Analysis of SKUA2
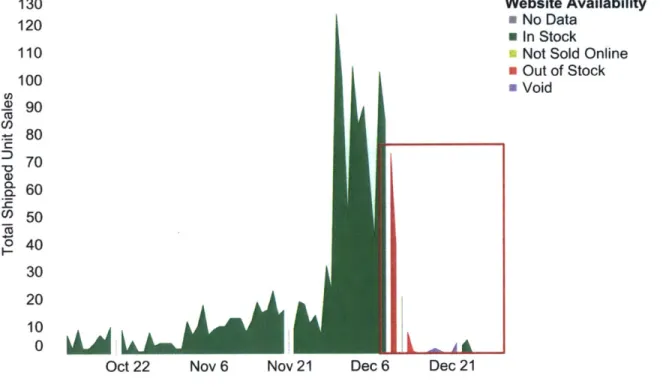
The pairing of POS data ('Total Shipped Units Sold') and 'Website Availability' shows that during peak sales during the end of November, SKU A2 is continuously in stock (see Figure 4-6). During the stockout that occurs in early December, sales do not disappear entirely as small replenishments still occur. Overall it seems that there is a potential for capturing lost sales on this individual SKU. Sales volume falls flat during the period of the stockout, which occurs when sales levels should be peaking.
130 Website Availability
120 No Data
* In Stock
110 Not Sold Online
100 Out of StockVoid
90 Co 80 70 -~ 0 S60 50 0 40 30 20 10
Oct 22 Nov 6 Nov21 Dec 6 Dec 21
Figure 4-6: POS I)ata and Website Availabilitv for SKU A2 October - December 2016
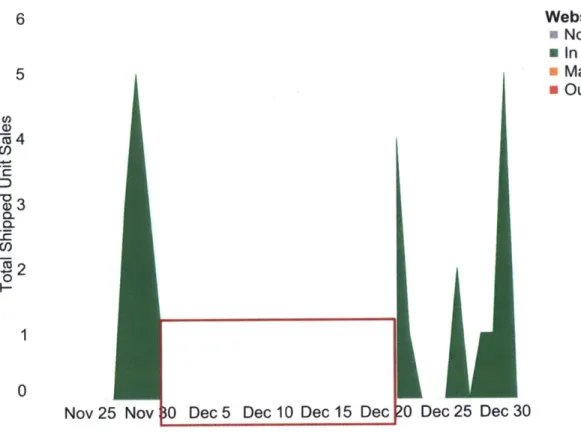
Analysis of SKUB3
SKU B3, displayed a prolonged period of out-of-stock followed by a switch to marketplace, perhaps due to a continued inability by the manufacturer to supply the SKU. The pairing with POS data confirms the assumption of a stockout. We see a complete loss of sales between December 2" and December I91h (see
Figure 4-7). The manufacturer indicated that it was general practice for retailers to move marketplace offerings to the top of the search results when the CPG manufacturer was out of stock for a prolonged period of time. Sales and availability appear to pick up again by the 20 of December, with good availability during that time. Although there is definitely potential to capture lost sales for this SKU, the low sales volumes of this SKU compared with other SKUs would not have a great impact on profitability.
I
Nov 25 Nov
P0
Dec 5 Dec 10 Dec 15 DecWebsite Availability No Data I In Stock Marketplace Out of Stock
L D
20 Dec 25 Dec 30
Figure 4-7: POS Data and Website Availability for SKU B3 November - December 2016
Analysis of SKUA3
As identified earlier, SKU A3 experienced a prolonged period of being designated as "Not Sold Online", which may indicate that the retailer had taken the product off the website due to lack of supply. When
39 6 5 :D
a3
02 0~ 0WI
matching POS data with Website Availability, a considerable decline in units sold can be observed in the time period where the item was listed as "Not Sold Online". Interestingly however, the product is also
shown as not available online on November 4th, when over 30 units were ordered online.
Oct 5 Oct 20 No
V
S
4 NovI
19Website Availability
No Data a In Stock
Not Sold Online
A1idA
iec 4 Dec 19 Jan 3 4-8: POS Data and Website Av'ailability for SKU A3
Limitations of Category B Data
October - December 2016
As mentioned above, data for category B products was only available from the end of November to December. This potentially limits the validity of the analysis, as we cannot capture any data on availability earlier in the season where sales may also be high. To get a better understanding of the extent of this limitation we assessed POS data for the category B SKUs.
As Figure 4-8 and 4-9 shows, sales peaks for all category B SKUs only occurred in the period from late November to the end of December. This would indicate that the retailer is making significant efforts to ensure sufficient inventory during the peak season between late November and December. It also shows that the lost sales from a stockout prior to late November may have less of an impact.
35 30 u) 25 020 Q-C- 15 0 10
5
0 Figure 4.2.4Item Name 30 *SKU B1 SKU B2 SKU B3 25 u20
-0l
15t'I
10 0 ISep 1 Oct 1 Nov 1 Dec 1 Jan 1
Figure 4-9: Sales data for SKU 11-B3
150 Item Name 140 E SKU B4 1 SKU B5 m SKU B7 120 cn 110 -F 100 90 80 70 !60 C/) 50 S40 30 20 10 0
Sep 28 Oct 13 Oct 28 Nov 12 Nov 27 Dec 12 Dec 27 Figure 4-10: Sales data for SKU B4-135, B7