HAL Id: hal-00318204
https://hal.archives-ouvertes.fr/hal-00318204
Submitted on 21 Nov 2006
HAL is a multi-disciplinary open access
archive for the deposit and dissemination of
sci-entific research documents, whether they are
pub-lished or not. The documents may come from
teaching and research institutions in France or
abroad, or from public or private research centers.
L’archive ouverte pluridisciplinaire HAL, est
destinée au dépôt et à la diffusion de documents
scientifiques de niveau recherche, publiés ou non,
émanant des établissements d’enseignement et de
recherche français ou étrangers, des laboratoires
publics ou privés.
Structured waves near the plasma frequency observed in
three auroral rocket flights
M. Samara, J. Labelle
To cite this version:
M. Samara, J. Labelle. Structured waves near the plasma frequency observed in three auroral rocket
flights.
Annales Geophysicae, European Geosciences Union, 2006, 24 (11), pp.2911-2919.
�hal-00318204�
© European Geosciences Union 2006
Geophysicae
Structured waves near the plasma frequency observed in three
auroral rocket flights
M. Samara1,2and J. LaBelle1
1Dartmouth College, Department of Physics and Astronomy, Hanover, NH, USA 2now at: Southwest Research Institute, San Antonio, TX, USA
Received: 2 September 2005 – Revised: 19 April 2006 – Accepted: 29 August 2006 – Published: 21 November 2006
Abstract. We present observations of waves at and just above the plasma frequency (fpe) from three high frequency electric field experiments on three recent rockets launched to altitudes of 300–900 km in active aurora. The predominant observed HF waves just above fpe are narrowband, short-lived emissions with amplitudes ranging from <1 mV/m to 20 mV/m, often associated with structured electron den-sity. The nature of these HF waves, as determined from frequency-time spectrograms, is highly variable: in some cases, the frequency decreases monotonically with time as in the “HF-chirps” previously reported (McAdams and La-Belle, 1999), but in other cases rising frequencies are ob-served, or features which alternately rise and fall in fre-quency. They exhibit two timescales of amplitude variation: a short timescale, typically 50–100 ms, associated with in-dividual discrete features, and a longer timescale associated with the general decrease in the amplitudes of the emissions as the rocket moves away from where the condition f ∼fpe holds. The latter timescale ranges from 0.6 to 6.0 s, corre-sponding to distances of 2–7 km, assuming the phenomenon to be stationary and using the rocket velocity to convert time to distance.
Keywords. Ionosphere (Auroral ionosphere; Plasma waves
and instabilities) – Space plasma physics (Waves and insta-bilities)
1 Introduction
Many previous space plasma experiments have included con-tinuous resolution full waveform measurements of Langmuir waves. For example, (Gurnett et al., 1981) presented ob-servations of the parametric decay and spatial collapse of Langmuir waves in the solar wind setting. However,
be-Correspondence to: M. Samara
cause of the higher frequency, MHz instead of kHz, Lang-muir wave waveform observations in the ionosphere were limited for a long time to envelope measurements (for exam-ple, Boehm, 1987; Ergun et al., 1991a,b) or to the waveform-capture technique (Kintner et al., 1995). Recently McAdams and LaBelle (1999) flew a continuous waveform receiver on a sounding rocket taking measurements in the auroral iono-sphere. They observed the fine structure of auroral Lang-muir waves near the plasma frequency, finding distinctive frequency structure in two different regions. “HF-Chirps”, extremely narrowband and short lived emissions, were ob-served at lower altitudes when fpe>fce. “Bands”, also nar-rowband but lasting longer, were observed at higher altitudes when fpe<fce. Samara (2005) reports a statistical analysis of the bursty Langmuir waves associated with the bands.
McAdams and LaBelle (1999) labeled as “HF-Chirps” the emissions they observed just above the plasma frequency, about 2 MHz in their experiment, in the overdense plasma where fpe>fce. The chirps were associated with electron density irregularities with scales sizes meters to a kilometer or so. Their bandwidth is 300–600 Hz, their amplitudes are
∼0.7 mV/m, and they last about 100 ms. They often appear in pairs or multiplets. A distinctive characteristic is that their frequency decreases with time, at a typical rate of 50 kHz/s. This tendency of their frequency to decrease inspired the name “chirps.” In a later paper, McAdams et al. (2000) put forth a model of the HF “chirp” emissions as quasitrapped eigenmodes in a field aligned density depletion, where the escaping waves retain the frequency structure of the eigen-modes. This was quantitatively consistent with the observed frequency spacings of HF “chirp” emissions (0.1–4 kHz), the fact that they are equally spaced, as well as the number of modes predicted for a given density cavity. More recently, Yoon and LaBelle (2005) developed a theoretical treatment of Langmuir wave eigenmodes based on a Lorentzian pro-file of density irregularity and using nonlocal kinetic theory wave equations.
2912 M. Samara and J. LaBelle: Langmuir chirps
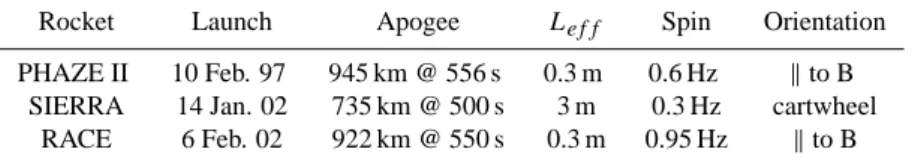
Table 1. Launch details for each rocket. Leff is the effective antenna length.
Rocket Launch Apogee Leff Spin Orientation
PHAZE II 10 Feb. 97 945 km @ 556 s 0.3 m 0.6 Hz kto B SIERRA 14 Jan. 02 735 km @ 500 s 3 m 0.3 Hz cartwheel
RACE 6 Feb. 02 922 km @ 550 s 0.3 m 0.95 Hz kto B
Table 2. Capacitances and correction factors for each rocket for the regions analyzed in this paper. The input capacitance was di-rectly measured for the RACE and PHAZE II experiments, but in the SIERRA experiment, it was estimated from a theoretical model.
Rocket Cin(pF) Csheath(pF) factor
PHAZE II 12.5 4.32–5.14 3.89-3.43
RACE 30.8 10.755–11.85 3.86–3.6
SIERRA 40.28 311.486–371.3 1.13–1.108
In 2002, two sounding rockets including HF waveform re-ceivers were launched from Poker Flat, Alaska, to altitudes of 700–950 km in active aurora, providing additional oppor-tunities to detect and study structure of auroral Langmuir waves. Both experiments detected narrowband, short-lived emissions just above fpe that are similar to the HF-chirps in some ways but exhibit significant differences. In this pa-per, we document the Langmuir wave signatures observed in the 2002 experiments and parametrize the spatial decay of the “chirp” signals outside of their source regions. Section 2 presents instrument details, and Sect. 3 presents data of the observations made with the three rockets and compares them quantitatively.
2 Instrumentation
The dataset we are considering here consists of three HF electric field experiments on three recent rockets. All three used either double-probe or wire-type antennas to detect the electric field of the waves. Table 1 gives information such as apogee and antenna length for each rocket, since these are important for interpreting and comparing the observations.
Physics of Auroral Zone Electrons (PHAZE II) was launched from Poker Flat on 10 February 1997, at 05:17 UT reaching an apogee of 945.3 km at about 556 s. The spin axis was parallel to the background magnetic field, and the electric field double-probe antenna consisted of ∼4.5 cm-diameter cylindrical probes separated by 0.3 m along an ax-ial boom mounted forward of the payload; i.e., the sensor detected the component of electric field parallel to the mag-netic field.
Sounding the Ion Energization Region–Resolving Ambi-guities (SIERRA) was launched from Poker Flat on 14 Jan-uary 2002 at 08:23 UT reaching an apogee of 735 km at about 500 s. In this experiment, the spin axis was perpendicular to the magnetic field (cartwheel mode). The electric field sen-sor was in effect a wire dipole, consisting of the conduct-ing Weitzmann boom stacer elements, each havconduct-ing physical length of approximately 3 m and average diameter of 2 cm.
The Rocket Auroral Correlator Experiment (RACE) was launched from Poker Flat on 6 February 2002 at 09:38 UT reaching an apogee of 922 km at about 550 s. The rocket spin axis was aligned with the background magnetic field. The electric field sensor was a double-probe with separation 0.3 m and orientation parallel to the magnetic field, identi-cal to the sensor on PHAZE II described above, except that the probes in the case of RACE were spherical and approxi-mately 6 cm diameter.
All three payloads included similar HF receivers. The HF receiver on these rockets measured continuously the full electric field waveform below 5 MHz, which was transmitted to the ground station on an analog telemetry channel. Due to the limited dynamic range of the analog telemetry, it was nec-essary to use automatic gain control (AGC) to ensure that the transmitter was always fully modulated. To prevent LF sig-nals such as auroral hiss from controlling the receiver gain, the received signals were passed through a high pass-filter, set at 400 kHz on PHAZE II and 100 kHz on SIERRA and RACE. At the ground station, the signals were recorded on DTR-6/8/16 tape drives and digitized on replay, at a 5 Msam-ples/s rate for PHAZE II and 10 MsamMsam-ples/s for SIERRA and RACE.
In all three cases, folding in the AGC yields the detected probe-to-probe voltage at the receiver input. Conversion to electric field requires dividing by an effective antenna length, assumed to be the probe separation in the case of the double-probe sensors and half of the physical length in the case of the wire-type antenna. It is also essential to account for the reduction in signal due to the finite input capacitance of the pre-amplifier and the sheath capacitance of the probes. The desired voltage is Vplasma, but Vmeasuredis actually measured
at the probe. The input capacitance of the preamp and the probe sheath capacitance are in effect a capacitor-divider cir-cuit, and the measured voltage must be corrected upward by a factor of (Cin+Csheath)/Csheathto obtain the desired voltage Vplasma.
136 138 140 142 144 146 1800 1900 2000 2100 2200 280 285 290 294 altitude (km) 299 304 309 314 319 665 670 675 680 685 690 1600 1700 1800 1900 2000 Frequency (kHz) 622 617 612 607 altitude (km) 602 597 592 588 583 755 760 765 770 775
Time after Launch (s) 1500 1600 1700 1800 1900 762 757 753 748 altitude (km) 743 738 734 729 724 ✁✄✂ ☎✝✆✞☎✠✟ ✁
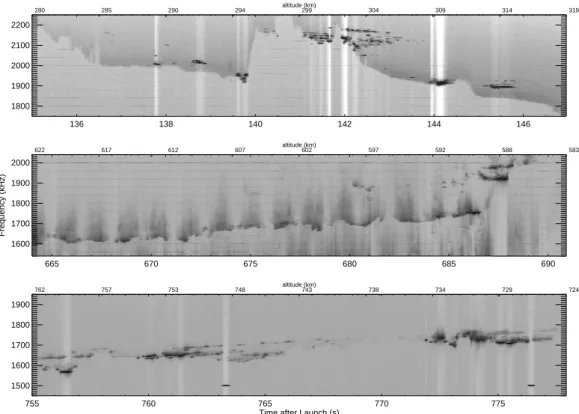
Fig. 1. Electric field spectrograms of selected intervals on three rocket flights: PHAZE II (top panel), SIERRA (middle panel), and RACE (bottom panel). The grayscale dynamic range is 40 dB for PHAZE II, 50 dB for SIERRA, and 70 dB for RACE. The time interval shown is 11 s for PHAZE II and 27–28 s for the other two flights, but the range of altitudes is about the same, ∼ 38 km, in all three panels. PHAZE II was at a much lower absolute altitude than were the other two flights. AGC was not folded in, so vertical light bands correspond to times when intense wave activity caused the AGC to reduce the gain; intense bands at 1500 kHz at 763 and 776 s in the bottom panel are artificial calibration signals. In all three panels, a lower cutoff of the waves corresponds to the plasma frequency (ranging from 2200 kHz to 1800 kHz in the top panel, from 1800 to 2000 kHz in the middle panel, and from 1550 to 1700 kHz in the bottom panel). Structured Langmuir waves occur at f ≥fpeand often coincide with regions of electron density structures and gradients.
The input capacitances, measured in the field for PHAZE II and RACE, were 12.5 pF (PHAZE II) and 30.8 pF (RACE), as given in Table 2. For SIERRA, it was impossi-ble to directly measure Cinbecause the antenna was never in flight configuration before the actual flight. We therefore es-timated Cinusing a parallel plate model of the boom mount-ing hardware (approximately 7.1 cm by 18.8 cm with 0.32 cm separation) in parallel with the measured pre-amplifier in-put, implying Cin=40.28 pF as shown in Table 2. Assum-ing Teof order 0.1 eV and using the measured electron den-sities for the periods analyzed below (42 000–6500 cm−3in the case of PHAZE II, 31 000–40 000 cm−3 in the case of RACE, and 32 000–50 000 cm−3 in the case of SIERRA), the appropriate Debye lengths are 1.15–0.92 cm (PHAZE II), 1.34–1.17 cm (RACE) and 1.32–1.1 cm (SIERRA). Assum-ing a sheath approximately one Debye length thick implies a sheath capacitance of 4.32–5.14 pF for the PHAZE II cylin-drical probes, 10.76–11.85 pF for the RACE spherical probes and 311.49–371.34 pF for the SIERRA cylindrical dipole el-ement. Thus, the resulting voltage-correction factors are
3.89–3.43 for PHAZE II, 3.86–3.6 for RACE and 1.13–1.11 for SIERRA. Table 2 summarizes these results.
3 Data presentation
Figure 1 shows an overview of selected interesting regions encountered by the three flights. All three panels consist of grayscale displays of sequences of Fast Fourier Trans-form (FFT) spectra of the measured HF electric field. The FFT length is 4096 samples (PHAZE II data), 8192 samples (SIERRA data) and 8192 samples (RACE data), implying a time interval per FFT of about 0.8 s and a frequency reso-lution of 1.2 kHz in all three cases. (The sample rate in the PHAZE II experiment was half than in the other two exper-iments.) The FFTs have been averaged by a factor of 49 (PHAZE II data), 110 (RACE data) and 94 (SIERRA data) in order to arrange that the total altitude range represented in each panel is approximately the same in each case, ≈38 km: the PHAZE II observations correspond to the upleg at 280– 318.5 km, and those of SIERRA and RACE correspond to the
2914 M. Samara and J. LaBelle: Langmuir chirps
☎✒✟ ✁
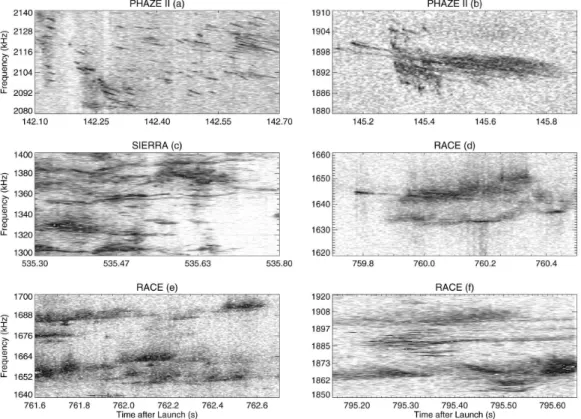
Fig. 2. Detailed electric field spectrograms showing the structure of the “HF-chirp” emissions observed just above fpe on three flights:
(a) and (b) are from PHAZE II, (c) from SIERRA and (d), (e) and (f) from RACE. There is a 40 db (panels b, c, e, f), 50 db (a) and 60 dB (d) difference between white and black on the grayscales. The AGC has not been accounted for in these displays. While the fine structures observed with PHAZE II all tend to decrease in frequency with time, inspiring the name “HF-chirps,” those observed on the other two rocket flights exhibit both decreasing and increasing frequencies.
downleg at altitudes 621.5 to 582.75 km and 762 to 724 km, respectively. Hence, the AGC and filter are not folded in for these panels. The light vertical regions (for example, around 144 s on PHAZE II, 686 s on SIERRA and 755 s on RACE) result from the correction of the AGC when large signals are encountered and the gain is reduced. In the third panel, the two horizontal lines at about 1500 kHz, shortly after 763 and 776 s, are artificially injected calibration signals.
The cutoff at fpeprovides a means of determining plasma density. In all three panels the fpe cutoff is clear; it ranges from 1840 to 2300 kHz for PHAZEII, 1600 to 2000 kHz for SIERRA and 1570 to 1800 kHz for RACE. The local fce is about 1357 kHz (PHAZE II), 1224 kHz (SIERRA) and 1152 kHz (RACE). Hence, all three observations correspond to overdense plasma conditions, where fpe>fce. In all three flights intense waves occur at and just above fpeand exhibit fine frequency structure with bandwidths of a few kHz or less. The structured waves are associated with regions of en-hanced electron density and associated density irregularities with spatial scales of meters to kilometers and amplitudes of order 10 percent. Because of the limited number of high fre-quency antennas and receivers deployed on these flights, only one antenna in the case of SIERRA and PHAZE II, the wave
mode cannot be identified with certainty. Two modes which occur in this frequency range just above fpefor fpe>fceare the LO-mode, which has a cutoff at fpe, and the Langmuir-upper hybrid modes, which have a resonance at fpefor paral-lel propagation (k-vector along the magnetic field). The con-centration of the wave power at fpe suggests that these are Langmuir waves, although it is possible that LO waves, upon reflection at f =fpe, can have enhanced wave energy density at the reflection point where the group velocity gets slow. At other times on the PHAZE II flight, much weaker signals ap-pear near fpewhich McAdams and LaBelle (1999) interpret as LO mode. However, the greater maximum amplitude of the waves in Fig. 1 argues for the Langmuir mode interpre-tation. The spin dependence observed in the SIERRA data, whereby the signal intensity drops out when the antenna is nearly perpendicular to the magnetic field, also supports the interpretation of these signals as parallel-propagating Lang-muir modes, which would have their electric field along the background magnetic field. Despite some uncertainty in the mode identification, these structured, time-variable waves observed at and just above fpe are hereinafter referred to as Langmuir waves.
☎ ✟ ✁
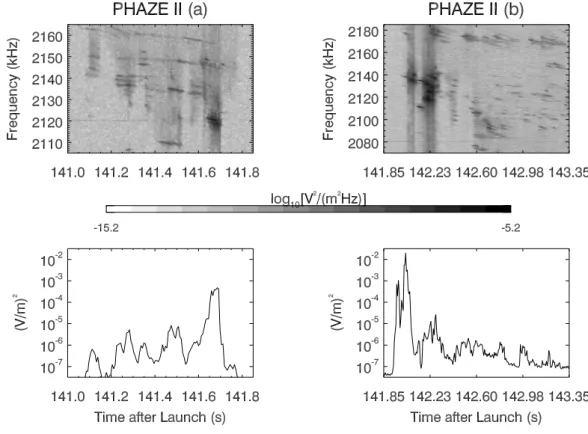
Fig. 3. Top panels show electric field spectrograms of selected short intervals of Langmuir wave fine structures for (a) 141.00–141.85 s and (b) 141.85–143.35 s during the PHAZE II rocket flight, corresponding to 300 km and 304 km, respectively. The bottom panels show wave power integrated over the entire frequency range displayed in the top panels. The wave power is largest when the rocket is nearest to the presumed source region, where the wave frequency is closest to local fpe, and away from that condition, the wave power decreases.
The wave intensities determined from examination of in-dividual spectra imply amplitudes in the range of 0.76 to 22 mV/m for PHAZE II, 0.02 to 0.06 mV/m for SIERRA and 0.12 to 1.2 mV/m for RACE. These Langmuir waves are much weaker than in some of the cases in the litera-ture, such as, for example, 50 mV/m Langmuir waves re-ported by Ergun et al. (1991a). The far smaller amplitudes inferred for the SIERRA experiment warrant further discus-sion. The physical antenna length on SIERRA was 6 m ver-sus 30 cm on the other two flights. Langmuir waves generally have short wavelengths, on the order of λ∼1 m, in order to be resonant with the relatively low energy auroral electrons. For wavelengths less than the antenna length (L), the an-tenna response falls off significantly, theoretically something like sin(L/λ) for double-probe antennas, as discussed e.g. by Temerin (1978). In the cases of RACE and PHAZE II, the antenna is almost certainly smaller than the wavelength, so there is littler or no correction, but in the case of SIERRA, the wave amplitude may be considerably underestimated. For example, for a plausible value L/λ∼6, the correction fac-tor is of order 10–20, which would make the amplitudes served in the SIERRA experiment comparable to those ob-served in the RACE experiment and in the range of those
observed in the PHAZE II experiment. (Because the correc-tion of the amplitudes based on the wavelength of Langmuir waves brings the SIERRA data into agreement with those on the other two flights could be taken as evidence supporting the identification of the waves as Langmuir mode.) The low amplitudes inferred above in the SIERRA case should there-fore not be interpreted as the wave electric field strength.
Figure 2 shows an “atlas” of wave fine structure observa-tions giving an impression of the variety of wave fine struc-tures observed during each flight. Each panel is an elec-tric field spectrogram similar to Fig. 1, except with higher time resolution. As in Fig. 1, in order to better show the wave structure within the limited grayscale dynamic range, the AGC and high-pass filter are not folded in for these dis-plays.
The PHAZE II examples shown in Figs. 2a, b were ob-served on the upleg in the altitude range 290 to 315 km. They are dominated by descending tones, called “chirps” by McAdams and LaBelle (1999), which have average down-ward slopes of 50 kHz/s, ranging from 0 to 80 kHz/s. Typical duration is 50 ms, ranging from 10 to 300 ms (see Fig. 2c of McAdams and LaBelle, 1999). McAdams and LaBelle (1999) report no correlation with the measured local electron
2916 M. Samara and J. LaBelle: Langmuir chirps
☞☛✍✌✏✎ ☞☛✒✑
✂
Fig. 4. Top panels show electric field spectrograms of selected short intervals of Langmuir wave fine structures for (a) 754.6–758.0 s and (b) 759.0–768.5 s during the RACE rocket flight, corresponding to ∼761 km and ∼748 km, respectively. The bottom panels show wave power integrated over portions of the frequency ranges displayed in the top panels.
distribution function. However, such correlations can be sub-tle and notoriously difficult to detect, since the observed particle distribution function, reflecting the presence of the waves, is usually plateaued out and rarely exhibits the un-stable feature giving rise to the waves, especially if the dis-tribution function measurement is taken over a time inter-val longer than a few tens of ms. Previous studies, even those which have been successful in identifying features of the electron distribution function associated with Langmuir waves, show the difficulty in recognizing these (e.g., McFad-den et al., 1986). Hence, the absence of such features does not comprise proof that the waves are not Langmuir mode.
The examples of HF wave structure observed in the SIERRA and RACE experiments sometimes included down-ward slopes, but they are not the dominant feature. Instead, these observations show both upward and downward slopes, with more upward than downward, in the case of SIERRA (Fig. 2c), and mostly upward slopes in the case of RACE (Fig. 2d, e, f). Figure 2e shows examples of the mostly up-ward slopes observed during the RACE experiment. In the SIERRA observations (Fig. 2c) “bird-like” sturctures occur, which exhibit both upward and downward slopes, such as that at 1350 kHz from 535.45 to 535.55 s, as well as struc-tures which decrease monotonically with time, such as the
one between 1315 and 1325 kHz from 535.4 to 535.5 s. In the case of SIERRA the observed features had an average upward slope of 20 kHz/s, ranging from 0 to 30 kHz/s. Typ-ical duration is 70 ms, ranging from 10 to 100 ms. In the case of the RACE observations the average upward slope is 20 kHz/s, ranging from 0 to 50 kHz/s. Typical duration is 100 ms, ranging from 10 to 200 ms.
As noted above and by McAdams and LaBelle (1999) based on PHAZE II data, these structured Langmuir wave emissions occur in regions characterized by electron density irregularities, with the tendency to get the most intense emis-sions when the emission frequency (f ) is near the local fpe. There are two timescales associated with that decay of the Langmuir wave fine structures: the average 50–100 ms life-time of the individual “HF-chirp” features, noted above; and the longer lifetime associated with groups of them. For the former timescale, McAdams and LaBelle (1999) (see Fig. 2.) reported typical durations of individual “HF-chirps” to be 100 ms in the PHAZE II case, and from SIERRA and RACE observations, we measure similar average lifetimes of about 70 ms and 100 ms respectively.
We now turn to measurements of decay times of groups of “HF-chirp” features. The top left-hand panel of Fig. 3 shows a spectrogram display of an example of structured Langmuir
waves observed in the PHAZE II experiment at 141.00– 141.85 s, corresponding to 300 km altitude. The AGC has been folded into this spectrogram to provide an accurate de-piction of wave amplitudes; dark vertical lines result from the action of the AGC, whereby the intense signals received force the AGC into a low gain state and thereby lower the instument signal-to-noise ratio. The bottom left-hand panel shows the wave power in units of (V/m)2, integrated over the entire 60-kHz frequency range (2105–2165 kHz) shown in the top panel. These plots clearly show a decrease in wave power between the presumed source of the waves, near about 141.65–141.70 s, where f ≈fpe and the wave power maxi-mizes, and earlier times where the emissions lie at frequen-cies above fpe and have wave powers a factor of 30–300 lower. In this case, the waves lie at offsets from 0–60 kHz (about 3%) above local fpe. The decay time (τ ) may be es-timated by fitting an exponential decay to these plots, and extracting the time that corresponds to a change in the inte-grated power spectral density of 1/e. From the example of Fig. 3a we obtain from this method a decay time (τ ) of about 0.6 s. If the wave decay is viewed as spatial rather than tem-poral, and the rocket velocity is used to convert the decay time to a distance, then 0.6 s corresponds to a decay distance of 2.3 km.
The right hand panels of Fig. 3 show data from another group of “HF-chirp” emissions observed a few seconds later on the same PHAZE II flight, at 141.85–143.35 s, corre-sponding to 304 km altitude; the bottom right-hand panel again shows wave power integrated over the entire frequency band displayed in the spectrogram (Fig. 3), in this case 2075– 2182 kHz. This second example appears similar to the first: the most intense waves occur at 142.00 s, and the wave power decreases as the rocket moves away from that region. In this case, the waves become offset from local fpe by more than 100 kHz (about 5%). For this example, we infer a decay time of τ ∼1.15 s. If, as above, the decay is interpreted as spatial rather than temporal, the decay distance would be 3.8 km.
Figure 4 shows similar observations from the RACE ex-periment. The left-hand panels (Fig. 4a) correspond to 754.6–758.0 s, or an altitude of 761 km. As explained above, dark vertical features result from the AGC action. The bot-tom left-hand panel shows the wave power integrated over the entire 35-kHz frequency range displayed in the spectro-gram (1625–1660 kHz). The most intense waves occur at about 756.5 s, and the wave power decreases at earlier times. In this case the signals remain within about 30 kHz (about 2%) of local fpe. Using the method described above, we infer a wave decay time of τ ∼ 1.6 s for the interval 754.7– 756.5 s, which corresponds to 1.3 km if the decay is spatial rather than temporal. The right-hand panels (Fig. 4b) cor-respond to 759.0–768.5 s, corcor-responding to 745–752 km in altitude. The vertical dark lines at, for example, 761.5 s, re-sult from action of the AGC, but the vertical line at 763.6 s and the corresponding peak in wave power in the lower right panel are due to an artificially injected calibration signal.
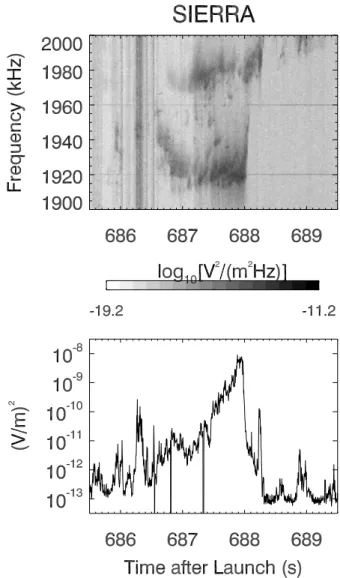
Fig. 5. (a) Electric field spectrogram recorded for 685.5–689.5 s during the SIERRA rocket flight, corresponding to 585–591 km; (b) Wave power integrated over the entire 100-kHz displayed frequency band.
The bottom right panel again shows wave power in units of (V/m)2, but in this case the power is integrated not over
the entire 1620–1740 kHz frequency range but over a quency band which tracks the emission, increasing in fre-quency with time, starting at 1620–1740 kHz and ending at 1704–1740 kHz. In this case the waves are offset from local
fpe by up to ∼90 kHz (5.6%). The characteristic decrease in wave power away from the presumed source region where
f ≈fpe is clear in this plot; the wave decay time inferred from fitting an exponential decay to the data is τ ∼6.5 s. If in-terpreted as spatial rather than temporal, and using the rocket velocity to convert from time to distance, this decay time cor-responds to a decay distance of 7 km.
Finally, Fig. 5 shows a structured Langmuir wave event detected with the HF wave receiver on the SIERRA rocket
2918 M. Samara and J. LaBelle: Langmuir chirps
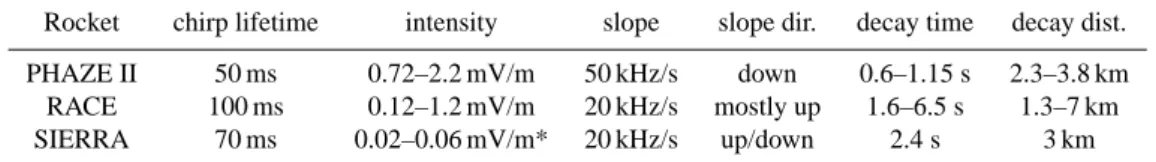
Table 3. Summary of relevant characteristics of the waves. The decay distance is calculated assuming that the decaying waves are spatial structures.
Rocket chirp lifetime intensity slope slope dir. decay time decay dist.
PHAZE II 50 ms 0.72–2.2 mV/m 50 kHz/s down 0.6–1.15 s 2.3–3.8 km
RACE 100 ms 0.12–1.2 mV/m 20 kHz/s mostly up 1.6–6.5 s 1.3–7 km
SIERRA 70 ms 0.02–0.06 mV/m* 20 kHz/s up/down 2.4 s 3 km
The intensities in the SIERRA experiment are underestimated by up to a factor of 20 due to boom length considerations; see text.
flight; the selected event on the downleg lasts from 685.5 to 689.5 s corresponding to 585–591 km altitude. The lower panel shows wave power integrated over the entire 100-kHz displayed frequency range (1900–2000 kHz). The emissions occur on a density gradient, with the strongest waves occur-ring at 688 s where f ≈fpe. At earlier times, the wave power drops off with time/distance from the matching condition, and the wave frequency is offset from fpe by 0–70 kHz (0– 3.5%). In this example, fitting an exponential to the decay yields a decay time of ∼2.4 s, corresponding to a decay dis-tance of 3 km.
Table 3 summarizes, by rocket, the relevant characteristics of the waves discussed so far.
These examples demonstrate typical features of the struc-tured Langmuir waves, called “HF-chirps” by McAdams and LaBelle (1999). The waves are not continuous but are com-posed of many short-lived narrow-band structures with life-times of order 50–100 ms. They tend to occur in regions of electron density structure and gradients. The wave power maximizes where f ≈fpe. As the rocket moves away from that near-matching condition, into lower-density regions, the waves lie at frequencies further above the local fpeand their amplitude diminishes. The timescale for the decrease in wave power is 0.6–1.1 s in the two PHAZE II examples an-alyzed, corresponding to 300–304 km, 1.6–6.5 s in the two RACE examples, corresponding to 745–761 km, and 2.4 s in the single SIERRA example, corresponding to 585–591 km. Since these experiments included measurements only at a single point in the plasma at each time, it is impossible to de-termine whether the wave decay time corresponds to a tem-poral effect or a spatial effect. The slightly shorter timescale in the PHAZE II examples, corresponding to the lowest alti-tudes, suggests that possibly collisions with neutral particles, which occur at a significantly higher rate at 300 km versus 580–760 km, may enhance the extinction rate of the waves. However, if the decay times are converted to distances using the rocket velocities, then the two PHAZE II examples cor-respond to 1h≈2.3–3.8 km, the two RACE examples spond to 1h≈1.3–7.0 km, and the SIERRA example corre-sponds to 1h≈3.0 km, so there is in this case no significant difference between the sampled altitude ranges and certainly no systematic increase of 1h with altitude. There is also no systematic relation between the decay time and the amount
by which the frequency of the waves becomes offset from local fpe, which ranges from 2–5.6% in these experiments.
4 Conclusions
In summary, the range of time variations of the structured Langmuir waves observed in these three experiments implies that the term “HF-chirps” is really a misnomer. Only oc-casionally do the Langmuir wave structures exhibit mono-tonically decreasing frequency as observed in the PHAZE II experiment by McAdams and LaBelle (1999). More often, other time variations occur, such as monotonically decreas-ing frequencies, monotonically increasdecreas-ing frequencies, and alternately increasing and decreasing frequencies. However, the 50–100 ms lifetime of individual fine structure features reported by McAdams and LaBelle (1999) is confirmed by the larger number of observations reported herein. The range of frequency-time slopes of the fine structure features ob-served during three rocket flights, 0–50 kHz/s, also agrees in magnitude with the range of downward slopes reported by McAdams and LaBelle (1999) based on one flight.
The fine structure emissions follow a characteristic pat-tern, in which the strongest emissions occur at that point on the electron density gradient where the wave frequency is closest to, but just a little above, the local plasma frequency. As the rocket samples places further away from that condi-tion, the observed wave power decreases. In this paper, we analyzed five examples on three different rocket flights and found that the decay time of the wave power, defined as the e-folding time obtained by fitting the wave decay to an ex-ponential, is in the range 0.6–6.5 s, with the shortest decay times (0.6–1.1 s) corresponding to the lowest altitudes (300– 304 km) and longer decay times (1.3–6.5 s) corresponding to higher altitudes (585–761 km). However, if the times are converted to distances using the rocket velocities, as would happen if the decaying waves are spatial structures sampled by the rockets, the decay distances average 3 km, and there is no altitude dependence. An altitude dependence might be expected if, for example, the neutral collision frequency plays a major role in determining the extinction rate of the waves. On the other hand it is possible that details such as the amount by which the waves exceed the local plasma fre-quency matter more than the collision frefre-quency. Detailed
modelling, beyond the scope of this paper, may be required to interpret these decay time observations. Because the decay times or distances appear fairly consistent across three inde-pendent experiments such detailed modelling is warranted.
This paper explores the time variation of the Langmuir wave fine structures, including the frequency variation of in-dividual fine structures, the lifetime of inin-dividual fine struc-tures, and the longer decay time or distance associated with the groups of fine structures. Relevant theoretical work, such as work reviewed by Yoon et al. (2006), treats the time sta-tionary case; for example, the eigenmode theory developed by McAdams et al. (2000) and further detailed by Yoon and LaBelle (2005) makes predictions about the number of fine structure features and their frequency spacings, but addresses neither the growth time nor the decay time of these waves. To explain the wave decay requires calculating convective damping rates as the waves propagate in the plasma, experi-encing cyclotron and Landau damping. To explain the varia-tions in the frequencies of the fine structures also requires a time dependent model of their generation. The fine structures reported herein bear a superficial resemblance to VLF cho-rus emissions, for which theoretical explanation has made re-cent leaps inspired by multi-point measurements made with the Cluster satellites (Inan et al., 2004; Parrot et al., 2003; Santolik et al., 2005). Although these whistler-mode cho-rus emissions are an entirely different plasma mode, per-haps their generation mechanism provides hints about that of the structured Langmuir waves. In any case, the measure-ments of fairly consistent fine structure lifetimes and decay distances for the groups of fine structures, observed in three independent auroral rocket experiments, suggest that detailed modelling is warranted.
Acknowledgements. The authors acknowledge teams at NASA Wallops Flight Facility for essential work leading to the success of the three rocket flights used in this study. Co-investigators at Cornell University, University of New Hampshire, University of Alaska-Fairbanks, and University of Iowa were also critical to the success of these experiments. Dartmouth staff engineers M. Trimpi and H. Harjes designed and constructed the HF electric field ex-periments used in this study. The work at Dartmouth College was supported by NASA grant NNG04WC27G.
Topical Editor M. Pinnock thanks O. Santolik and another ref-eree for their help in evaluating this paper.
References
Boehm, M.: Waves and static electric fields in the auroral accel-eration region, Ph.D. thesis, University of California, Berkeley, 1987.
Ergun, R. E., Carlson, C. W., MacFadden, J. P., Clemmons, J. H., and Boehm, M. H.: Langnuir Wave Growth and Electron Bunch-ing: Results From a Wave-Particle Correlator, J. Geophys. Res., 96, 225–238, 1991a.
Ergun, R. E., Carlson, C. W., MacFadden, J. P., Clemmons, J. H., and Boehm, M. H.: Evidence of Transverse Langmuir Modu-lational Instability in a Space Plasma, Geophys. Res. Lett., 18, 1177–1180, 1991b.
Gurnett, D. A., Maggs, J. E., Gallagher, D. L., Kurth, W. S., and Scarf, F. L.: Parametric Interaction and Spatial Collapse of beam-driven Langmuir waves in the solar wind, J. Geophys. Res., 86, 8833–8841, 1981.
Inan, U. S., Platino, M., Bell, T. F., Gurnett, D. A., and Pick-ett, J. S.: Cluster measurements of rapidly moving sources of ELF/VLF chorus, Geophys. Res. Lett., 109, A05214, doi:10.1029/2003JA010289, 2004.
Kintner, P. M., Bonnell, J., Powell, S., Wahlund, J., and Bengt, H.: First results from the Freja HF Snapshot Receiver, Geophys. Res. Lett., 22, 287–290, 1995.
McAdams, K. L. and LaBelle, J.: Narrowband structrure in HF waves above the electron plasma frequency in the auroral iono-sphere, Geophys. Res. Lett., 26, 1825–1828, 1999.
McAdams, K. L., Ergun, R. E., and LaBelle, J.: HF chirps: Eigen-mode trapping in density depletions, Geophys. Res. Lett., 27, 321–324, 2000.
McFadden, J. P., Carlson, C. W., and Boehm, M. H.: Field-aligned electron precipitation at the edge of an arc, J. Geophys. Res., 91, 1723–1730, 1986.
Parrot, M., Santolik, O., Cornilleau-Wehrlin, N., Maksimovic, M., and Harvey, C. C.: Source location of chorus emissions observed by Cluster, Ann. Geophys., 21, 473–480, 2003,
http://www.ann-geophys.net/21/473/2003/.
Samara, M.: Sounding Rocket Investigations of Whistler, Upper Hybrid and Langmuir Waves in the Auroral Ionosphere, Ph.D. thesis, Dartmouth College, Hanover, NH, 2005.
Santolik, O., Gurnett, D. A., Pickett, J. S., Parrot, M., and Cornilleau- Wehrlin, N.: Central position of the source region of storm-time, chorus, Planet. Space Sci., 53, 299–305, 2005. Temerin, M.: The polarization, frequency, and wavelengths of
high-latitude turbulence, J. Geophys. Res., 83, 2609–2616, 1978. Yoon, P. H. and LaBelle, J.: Discrete Langmuir waves
in density structure, J. Geophys. Res., 110, A11308, doi:10.1029/2005JA011186, 2005.
Yoon, P. H., LaBelle, J., Weatherwax, A. T., and Samara, M.: Mode Conversion Radiation in the Terrestrial Ionosphere and Magne-tosphere, in: Geospace Electromagnetic Waves and Radiation, edited by: LaBelle, J. W. and Treumann, R. A., Springer, Heidel-berg Edn., p. 211, 2006.