HAL Id: hal-00318131
https://hal.archives-ouvertes.fr/hal-00318131
Submitted on 9 Aug 2006
HAL is a multi-disciplinary open access
archive for the deposit and dissemination of
sci-entific research documents, whether they are
pub-lished or not. The documents may come from
teaching and research institutions in France or
abroad, or from public or private research centers.
L’archive ouverte pluridisciplinaire HAL, est
destinée au dépôt et à la diffusion de documents
scientifiques de niveau recherche, publiés ou non,
émanant des établissements d’enseignement et de
recherche français ou étrangers, des laboratoires
publics ou privés.
the substorm onset
T. V. Kozelova, L. L. Lazutin, B. V. Kozelov, N. Meredith, M. A. Danielides
To cite this version:
T. V. Kozelova, L. L. Lazutin, B. V. Kozelov, N. Meredith, M. A. Danielides. Alternating bursts of
low energy ions and electrons near the substorm onset. Annales Geophysicae, European Geosciences
Union, 2006, 24 (7), pp.1957-1968. �hal-00318131�
www.ann-geophys.net/24/1957/2006/ © European Geosciences Union 2006
Annales
Geophysicae
Alternating bursts of low energy ions and electrons near the
substorm onset
T. V. Kozelova1, L. L. Lazutin2, B. V. Kozelov1, N. Meredith3, and M. A. Danielides4 1Polar Geophysical Institute, Apatity, Murmansk region, 184209, Russia
2Russia Space Science Division, Scobeltsyn Institute for Nuclear Physics of Moscow State University, Russia 3Mullard Space Science Laboratory, University College, London, UK
4Space Physics Group, University of Oulu, Finland
Received: 1 February 2006 – Revised: 12 May 2006 – Accepted: 24 May 2006 – Published: 9 August 2006
Abstract. The substorm associated behavior of the low en-ergy particles (30 eV–28.5 keV) near the earthward edge of the plasma sheet is examined using data from CRRES during the late growth and early expansion phases of a substorm on 12 March 1991 and their significance for the substorm on-set mechanism is discussed. In this substorm, the CRRES was located on L ∼6.3 and ∼20◦westward of the substorm onset and observed the sequence of the alternating bursts of the low energy ions and electrons. The bursts of the 0.633– 9.6 keV ions occurred 1–2 min before the (7.31–21.7 keV) electron bursts. The first ion burst happened 2 min before the substorm onset, at the moment of weak brightening of the most equatorial pre-breakup arc near the latitude ∼62◦. The alternation of the ion and electron bursts may be a signature of a drift-Alfv´en ballooning instability on the inner edge of the plasma sheet near substorm onset.
Keywords. Magnetospheric physics (Auroral phenomena; Energetic particles, precipitating; Magnetospheric configu-ration and dynamics)
1 Introduction
Injections of energetic particles and dipolarization of the magnetic field are well-known signatures of the magneto-spheric substorm in the near-Earth region of the plasma sheet. Dipolarization has been interpreted as the reduction of a portion of the cross-tail current (current disruption) and the formation of a substorm current wedge (McPherron et al., 1973). Two basic models of substorm onset have been sug-gested: i) the near-Earth current disruption (NECD) in the region of the inner plasma sheet at the distance ≤10 RE(e.g.
Lui, 1991) and ii) the near-Earth neutral line (NENL) at the distance of 15–20 RE(e.g. Baker et al., 1996).
Correspondence to: T. V. Kozelova
(kozelova@pgi.kolasc.net.ru)
From the ground-based observations, the substorm expan-sion phase onset is recognized by the sharp decrease of the X component in magnetometer records near the magnetic midnight and by the breakup of the most equatorial arc. It was found in some events that the source region of the arc in the magnetosphere is located in the inner part of the plasma sheet, which is situated earthward of the open-closed field line boundary (Samson et al., 1992; Mende et al., 2003; Dubyagin et al., 2003; Yago et al., 2005). Using various global magnetic field models, the locations of the auroral onset were mapped to equatorial distances in the range of 5–8 RE (Galperin and Feldstein, 1991; Lopez et al., 1991;
Frank and Sigwarth, 2000; Dubyagin et al., 2003). On the other hand, in order to identify the onset region in the mag-netosphere, auroral particles associated with substorm onset were investigated.
The breakup location relative to the different precipitation boundaries was found using the low altitude satellite obser-vations:
1. The pre-breakup arc near 20–24 MLT is found to corre-spond to the structure of precipitated electrons with the narrow energy peak of 1–2 keV or of ∼3 keV (Dubyagin et al., 2003; Yago et al., 2005).
2. This structure of precipitated electrons with the narrow energy peak is located near the equatorial edge of the diffuse electron precipitation region (Dubyagin et al., 2003; Yago et al., 2005). In this equatorward portion of the auroral precipitation, the average energy of the electrons Ee increases towards a higher λ – latitude,
dEe/dλ>0 (Newell et al., 1996a, b).
3. This electron precipitation structure, which corresponds to a brightening arc, is located about 0.4–1 degree pole-ward of the greatest ion (0.01–24 keV) energy flux loca-tion (Dubyagin et al., 2003; Yago et al., 2005). The ion flux maximum matches the boundary “b2i” (Newell et
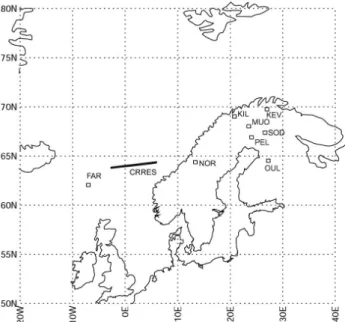
Fig. 1. Locations of ground-based magnetometers and the CRRES mapping to the ionosphere at 1-h interval, 20:00–21:00 UT, during the substorm on 12 March 1991.
al., 1996a, b) or the isotropy boundary (Sergeev et al., 1993). The temperature and energy flux of the ions in the range 3 keV to 30 keV increase with declining lati-tude (Newell et al., 1996a, b).
Thus, the location of the brightened arc mapped to the equa-torial plane is expected to correspond to a region in the mag-netosphere where (a) the average energy of the electrons Ee
increases and (b) the ion energy density rapidly decreases with increasing radial distances. The feature (a) is com-monly interpreted as a characteristic of the Alfv´en convective boundary for hot electrons (on the inner edge of the plasma sheet). The feature (b) indicates the outer boundary of the trapped energetic ions. The motions of these particle bound-aries are observed most frequently during the substorm at geosynchronous orbit in the region near midnight (Kaye and Kivelson, 1979; Walker et al., 1976; Sauvaud and Winckler, 1980).
On the other hand, the current disruptions during the sub-storm onsets were recognized at the equatorial distances of 5–10 RE in the magnetosphere (Lui, 1978; Kaufmann,
1987; Kozelova and Sakharov, 1989; Jacquey et al., 1991; Kozelova et al., 1999). Therefore, satellites at geosyn-chronous distances have, during sufficient magnetospheric activity, a good possibility of registering the particle fluxes and magnetic field variations associated with substorm on-set plasma instabilities in the pre-midnight sector. An in-terchange/ballooning instability appears consistent with the near-geosynchronous observations of the substorm onset (Roux, 1985; Kremser et al., 1988; Samson et al., 1992).
Table 1. Ground stations of this case study.
abbr. name geogr. geogr. CGM CGM
lat. (◦N) lon. (oE) lat. (◦N) lon. (◦E)
FAR Faroes 62.05 352.98 60.72 77.44 KEV Kevo 69.76 27.01 66.32 109.24 KIL Kilpisj¨arvi 69.02 20.79 65.88 103.79 MUO Muonio 68.02 23.53 64.72 105.22 NOR Nordli, 64.37 13.36 61.50 94.92 Norway OUL Ouluj¨arvi 64.52 27.23 60.99 106.14 PEL Pello 66.90 24.08 63.55 104.92 SOD Sodankyl¨a 67.37 26.63 63.92 107.26
Using the GEOS-2 satellite observations on 6.6 RE, Roux
(1985) found electric field oscillations and changes in the azimuthal component of the energetic ion pressure gradi-ent during substorm dipolarization. Localized field-aligned current structures were found to coincide with the westward travelling surge (WTS) and discrete auroral form. Kozelova et al. (1986a, b) found in the study of the GEOS-2 data that i) the increase of the energetic electron fluxes, ii) the de-crease of the energetic ion fluxes, iii) the sharp change in the azimuthal electric field component from eastward to west-ward, and iv) the magnetic field dipolarization, are all con-nected with the western edge of the WTS. Holter et al. (1995) performed spectral and wavelet analyses to characterize the transient oscillations during the substorm. They interpreted the obtained low frequency oscillations as a coupled shear Alfv´en-slow magnetosonic mode. These oscillations may be excited by the ballooning instability (Miura et al., 1989; Cheng and Qian, 1994).
The CRRES observations at 5–6.6 REalso support an idea
that the drift-Alfv´en ballooning instability in the near-geosynchronous plasma sheet is a responsible mechanism for substorm onset and initiation of the substorm current wedge (Maynard et al., 1996; Erickson et al., 2000; Kozelova et al., 2000). Maynard et al. (1996) presented the observation of the electric field reversals that correlated with changes in cross-tail currents and particle energies occurring before and dur-ing the substorm onset at the inner edge of the plasma sheet at 5–6 RE. Erickson et al. (2000) found that the initial wave
power is dominantly magnetical field aligned and flows to-wards the ionosphere during eastward oriented electric field. At this time, the drift wave is coupled with the Alfv´en mode. Just before the local substorm dipolarization onset, Kozelova et al. (2000) observed one oscillation with an ∼90◦ phase
shift between Eyand Bz. The observed time lag between Bz
and Eyindicated the even mode standing wave structure with
UT SOD MUO KIL 20:10 20:24 20:25 20:26 20:27 20:28 20:29
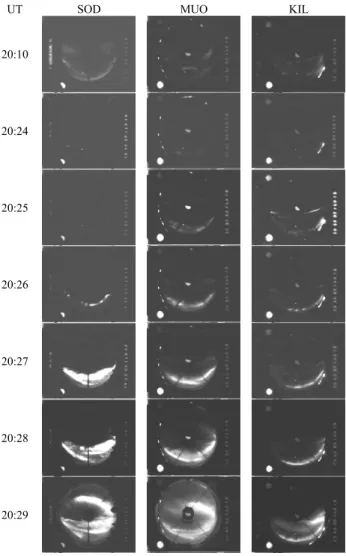
Fig. 2. All-sky camera images taken at SOD, MUO and KIL during the substorm on 12 March 1991. The north (and east) is/are at the top (and right) side of the images.
In this paper, we used data from the CRRES satellite to examine the dynamics of low energy (100 eV–30 keV) ions and electrons (LEPA data) (Hardy et al., 1993) near the onset of the substorm on 12 March 1991. The CRRES was lo-cated on L ∼6.3 (and ∼21.5 MLT) near the earthward edge of the plasma sheet. The CRRES data from the magnetome-ter (Singer et al., 1992) and from the electron and proton wide-angle spectrometer (EPAS) (Korth et al., 1992) were also used. Ground-based observations include magnetome-ters and all-sky data from four Finnish stations (SOD, MUO, KIL and KEV). Positions of the ground stations are shown in Table 1. A general structure of this substorm and a particle dynamics were originally reported by Lazutin et al. (2005) from different viewpoints. This substorm is a sequence of optical pseudo-breakups and a breakup above Scandinavia, southward of SOD. The CRRES was located ∼20◦westward of the substorm onset epicenter. Figure 1 shows the locations
Bz, nT FAR KIL PEL NOR OUL t1 ts To Texp pb2 X component 200, nT pb1
Fig. 3. Substorm on 12 March 1991. The Bzcomponent from the
CRRES and X component from ground magnetometers. Short hor-izontal solid lines, labeled “pb1” and “pb2”, denote weak auroral pseudo-breakups. Horizontal dashed lines are the X component lev-els during quiet conditions for corresponding magnetometers.
of the magnetometers and the mapping of the CRRES tra-jectory along the magnetic field line to the ionosphere at the 1-h interval (20:00–21:00) UT during this substorm using the Tsyganenko (1989) model.
2 Substorm evolution
The day of 12 March 1991 is characterized by long-lasting ground magnetic activity of 400–800 nT (Lazutin et al., 2005). After 19:50 UT, the southward drifting weak auro-ral arcs arose near the KIL meridian (3∼117◦). Auroral activations are observed in a more poleward region of au-roral particle precipitation and may be interpreted as auau-roral pseudo-breakups.
Figure 2 shows several ASC images borrowed from SOD, MUO, and KIL. At the moment of 20:24 UT, a new, weak arc appears near the latitude ∼62◦(equatorward of all arcs observed during growth phase). The optical breakup begins just from this arc at the moment To=20:26 UT. A large
ex-pansion of the substorm begins 7 min after substorm onset (the moment Texp).
Figure 3 presents the Z component of the magnetic field (Bz), observed by the CRRES, and the magnetometer data
at several ground-based stations during the substorm on 12 March 1991. Before To, KIL and PEL were located in the
t1
To Texp Bz, nT 0.633 keV pb2 0.831 keV 2.47 keV 3.24 keV 9.6 keV 16.5 keV 54-69 keV 69-85 keV 85-113 keV 113-147 keVa
c
e
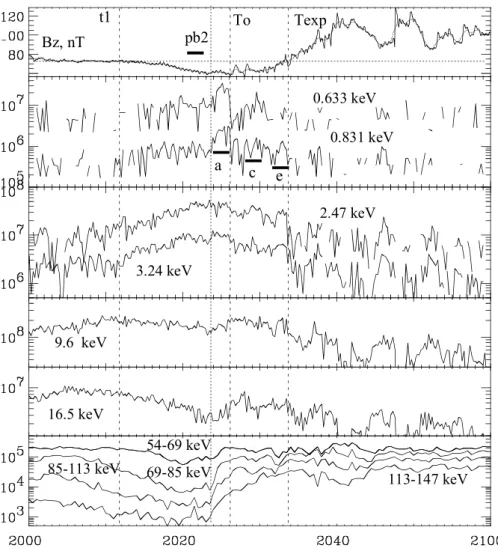
Fig. 4. Substorm on 12 March 1991. Data from the CRRES satellite. From top to bottom: Z-component of the magnetic field; the “A” and “B” populations of LEPA ions with pitch-angles ∼90◦are shown in panels (2–3) and (4–5), respectively; flux of high-energy (EPAS) ions with pitch-angles ∼90◦are presented in panel 6. Ion flux is in cm−2s−1sr−1keV−1.
Harang discontinuity, which marks the boundary between the electrojets of the different directions in the late evening sec-tor (Heppner, 1972). At this time, OUL, NOR and FAR were located in the region of the eastward electrojet, equatorward and westward of the Harang discontinuity. From the ground-based observations, a general evolution of this substorm was originally reported by Kozelova et al. (2004).
The first decrease in the X component of the magnetic field at the ground began at 20:22 UT at the station PEL (latitude ϕ=63◦). The X component decrease was small until T
o, when
the rate of decrease of the X component suddenly increased. This was the first substorm intensification, which had a small poleward expansion (to MUO and KIL). Besides, at To, the
substorm westward electrojet JWappears suddenly westward
of the CRRES on the FAR meridian (3=80◦). However, 3 min later, this substorm intensification recovered, and the global current system with eastward electrojet was reestab-lished on the FAR. At 20:29–20:30 UT new substorm
inten-sification started again near the KIL meridian. This intensi-fication had a significant equatorward expansion (to OUL). The regular westward expansion of the substorm westward electrojet JW was observed after 20:33 UT, during the next
intensification, and the equatorward expansion of the mag-netic activity began near NOR (Harang discontinuity moved westward). This moment Texp=20:33 UT was important in
the dynamics of the inner magnetosphere.
Thus, before To CRRES hits the eastward electrojet
re-gion and encounters the rere-gion 2 field-aligned currents flow-ing into the ionosphere in the pre-Harang discontinuity sec-tor (Iijima and Potemra, 1978). The westward expansion of the JW can be identified as a transition of the CRRES from
the pre-Harang discontinuity to the post-Harang discontinu-ity sector, where the region 2 field-aligned currents flow from the ionosphere.
3 Behavior of the low energy ions
Figure 4 shows the Z component of the magnetic field (Bz),
LEPA (with 15-s time resolution) and EPAS (with 30-s time resolution) ion data in several channels from the CRRES. In the interval between t1 and Texp, the Bz component has a
slow variation in a hollow form. Besides, some small-scale magnetic field fluctuations appear after ∼To. Usually
dur-ing the substorm growth phase at near-geosynchronous dis-tances, the Bzdecrease represents magnetic field line
stretch-ing. The Bz increase (dipolarization) begins after substorm
onset during a substorm expansion phase. We begin our anal-ysis from variations of the low energy ions with the pitch angle ∼90◦during a hollow-like magnetic field variation. 3.1 Slow variation of the ion flux
During the growth phase stretching of the magnetic field lines on the CRRES (from t1 to To), the flux of ions with
pitch-angles ∼90◦was increasing in the energy range from WL=0.28 keV to WH=7.31 keV. We will name these particles
as population “A”. The ion flux in some energy channels from this population is shown in panels 2 and 3 of Fig. 4. One can see that the flux of 2.47–3.24 keV ions increases earlier than that of the 0.633–0.831 keV ions. This dependence of the en-hanced ion flux on energy during the passage into the inner edge of the plasma sheet results in a “nose” distribution in the ion spectrogram (Kerns et al., 1994). The energy WLis
a low-cutoff energy below which the drift paths are closed and eastward. The energy WH is a high-cutoff energy above
which the drift paths are closed and westward (Kerns et al., 1994). The ions with the energy WL<W <WH convect from
the tail to the CRRES position.
During the same interval of time, the flux of ions decreases in the energy range from 9.6 keV to 21.7 keV. We will name these particles as population “B”. For example, the particle flux for two energy channels from this population is shown in panels 4 and 5 of Fig. 4. One can see that the flux of higher-energy ions from this population begins to decrease earlier than the lower-energy ions. The decrease of the par-ticles flux is usually observed at the outer radiation belt dur-ing the growth phase distortion of the magnetosphere to a more tail-like configuration (Walker et al., 1976; Sauvaud and Winckler, 1980).
Thus, different behavior of different energy particles near the inner edge of the plasma sheet during the development of the tail-like magnetic field in the vicinity of the CRRES can separate the distinctive plasma regions and reveal the forma-tion of a sharp transiforma-tion between these regions. The “A” population is probably associated with the inner boundary of the plasma sheet with the outward (tailward) radial gradient of particle flux. The “B” population can be associated with a population of “old” trapped ions from the outer boundary of trapped particles with an inward (earthwards) radial gra-dient of particle flux. During the growth phase, this
transi-tion boundary moves earthwards. After To, population “A”
decreases and population “B” increases at the CRRES po-sition. Both populations are decreasing after Texp, when a
large-scale dipolarization of the magnetic field occurs, and the transition boundary is moving tailwards.
3.2 Ion bursts
We want to pay attention to the low-energy (0.633–9.6 keV) ion bursts that were observed ∼100 s before To and Texp.
These bursts are marked as “a” and “e” in Fig. 4. Besides, one can see a weak burst “c” at nearly 20:29 UT between the bursts “a” and “e”. These three ion bursts with the time dura-tion of ∼100 s were observed with a quasi-period of 3.5 min. The first ion burst coincides with the sudden enhancement of more energetic (54–147 keV) ion fluxes with pitch-angles ∼90◦. Simultaneously, the pitch-angle distribution of these energetic ions changes rapidly from the cigar form to the trapped one (Lazutin et al., 2005). The energetic ion flux mesurements (EPAS data) in the four energy channels with a time resolution of 30 s are shown in the lower panel of Fig. 4. For all energy channels (54–147 keV), the flux increase starts at nearly 20:24 UT. However, for the first energy channel (54–69 keV), a more significant increase of the flux appears with a delay of ∼30 s, which is comparable to the time reso-lution of the data. The ion flux enhancement is the largest for the energy channel (69–85 keV). EPAS ion data with a higher time resolution from three detectors (presented in Lazutin et al., 2005) confirm that the ion flux enhancement near 20:24 UT is “nearly dispersionless” or, more precisely, “dispersion-less with a time resolution of 30 s”.
The first low energy ion burst and a sudden energetic ion enhancement occurred ∼2 min before Toand coincided with
the appearance of the most equatorial weak arc near the lati-tude ϕ=∼62◦observed roughly 20◦eastward of CRRES.
4 Plasma sheet electron dynamics
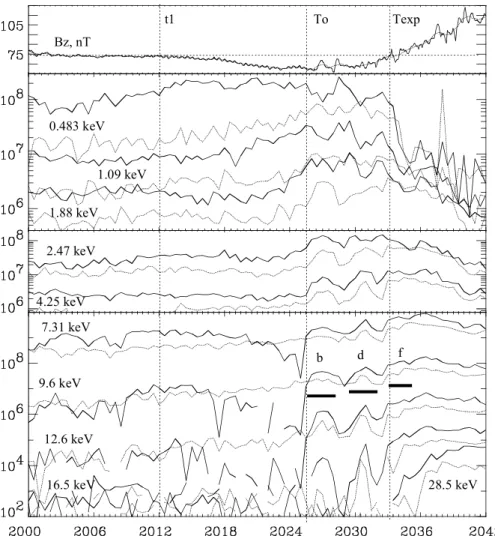
Figure 5 presents differential flux variations in several elec-tron channels of LEPA data with a 30-s time resolution. The dynamics of trapped electrons near the inner edge of the plasma sheet can help in the interpretation of the observa-tions.
4.1 Slow electron flux variations
As seen in Fig. 5, electron flux variations depend on the electron energy. Similar to ion flux variations, the electron fluxes, which increase during the growth phase stretching of the magnetic field lines, will be named as population “A”.
Before To, the electron flux increases in the energy range
from 0.213 keV to WC=1.88 keV. The fluxes in several
en-ergy channels from this population “A” are shown in panel 2 of Fig. 5. One can see that at the CRRES the lowest energy
To t1 Texp Bz, nT 0.483 keV 1.09 keV 1.88 keV 2.47 keV 4.25 keV 7.31 keV 9.6 keV 12.6 keV 16.5 keV 28.5 keV b d f
Fig. 5. Substorm on 12 March 1991. Data from the CRRES satellite. From top to bottom: Z-component of the magnetic field; the “A” and “B” populations of LEPA electrons are shown in the panels (2–3) and (4), respectively. Electron flux in cm−2s−1sr−1keV−1. Solid lines are the flux of particles with pitch-angles ∼90◦; dashes lines are the flux of particles with pitch-angles near the field-aligned direction.
electrons were observed first. The cutoff energy WCis
con-sidered transition energy between the open and closed drift trajectories of the electrons (Kerns et al., 1994). Just before To, the electrons with W ≤WC convect toward the CRRES
position from the tail.
During the same time interval before To, the perpendicular
flux of electrons with energies W >WCis almost constant or
is decreasing. The electron flux is almost constant in the en-ergy range from 2.47 keV to 5.57 keV (panel 3 of Fig. 5). The electron flux decreases in the energy range from 7.31 keV to 16.5 keV (panel 4 of Fig. 5).
According to Kerns et al. (1994), electrons with W >WC
move by closed drift paths. The electron fluxes, which de-crease or are almost constant during the growth phase, will be named “B” population. We observe in panel 4 of Fig. 5 that the perpendicular flux of the higher-energy (12.6–16.5 keV) electrons in this population begins to decrease earlier than the flux of the lower-energy (7.31–9.6 keV) particles similar
to the behavior of particles on the outer boundary of the “old” trapped particles during the inward motion of the boundary (Walker et al., 1976; Sauvaud and Winckler, 1980).
Before To, for the electron energy interval (7.31–16.5 keV)
the flux exhibits the minimum for pitch angles around 90◦.
After Texp, “A” population is decreased and “B” population
is increased.
4.2 Injections of electrons
At ∼To, the electron flux in four adjacent energy channels
in the range (7.31–16.5 keV) grows sharply and exceeds the level which it had before the beginning of the growth phase stretching of the magnetic field lines. One could call these in-creases “injections” of electrons in a small range of electron energy. The first electron injection begins ∼40 s before sig-nificant increases of the Z component of the magnetic field. The second injection of 21.7–28.5 keV electrons occurrs at ∼Texp, during the substorm expansion phase.
4.3 Electron bursts
During the interval between To and Texp, one can see two
electron bursts, marked “b” and “d” in Fig. 5. Their time duration was ∼100 s. Note the third burst, “f”, with an indistinct duration, masked by the electron injection. The bursts had little increases of both perpendicular and parallel fluxes of electrons with energies of 2.47–5.57 keV (panel 3 of Fig. 5), which are close to the cut-off energy WC. More
intensive electron bursts were observed in the higher-energy channels of the “B” population, where the electron flux was decreasing during the substorm growth phase (the bottom panel of Fig. 5). After the first burst, the electron flux in the range (7.31–12.6 keV) exceeds the level which it had be-fore the beginning of the substorm growth phase, after the second burst – in the range (16.5–21.7) keV. After the third burst, the flux of electrons with energies >28.5 keV exceeds its initial value. The bursts occurred at the leading edge of electron injections. During these electron (2.47–12.6 keV) bursts, the flux of electrons (of “A” population) with energies of 0.213–1.88 keV decreases (panel 1 of Fig. 5).
4.4 Parallel fluxes of electrons
Before To, the parallel flux J || (dashed lines, Fig. 5) of
population “A” electrons with W ≤1.88 keV was slowly in-creasing, similar to the perpendicular fluxes. As the satellite crosses the inner edge of the plasma sheet, the average en-ergy of the electrons, Ee, is increasing with the increase of
the radial distance, r, so that dEe/dr>0. These fluxes J ||
may be associated with the equatorial edge of the diffuse au-roral electron precipitation in the ionosphere, where the aver-age energy of Eeis increasing with the latitude λ, providing
dEe/dλ>0 (Newell et al., 1996a,b).
5 Alternation of ion and electron bursts
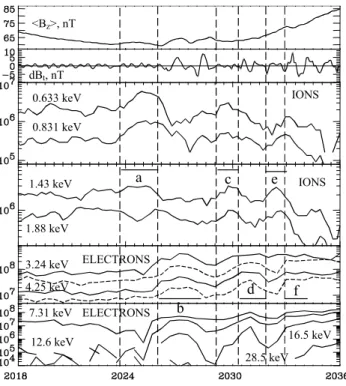
Now it is possible to compare the development of ion and electron bursts and simultaneous variations of the magnetic field at the CRRES during the substorm on 12 March 1991 (Fig. 6). Panel 1 of Fig. 6 presents the sliding 60-s smoothed values of the magnetic field Z component, <Bz>, to
demon-strate slow changes in the field. Fast fluctuations of the total magnetic field dBt=Bt−<Bt>are shown in the next panel.
Panels 3 and 4 present sliding 45-s smoothed values of the ion fluxes for several channels. Panels 5 and 6 present elec-tron fluxes of several energy channels as in Fig. 5.
From Fig. 6, one can see that the ion bursts occur 1–2 min before the electron bursts. The ion bursts occurred without significant fluctuations in dBt, and a dependence of the ion
bursts on changes in <Bz>was not observed. The
elec-tron bursts occurred during small local dipolarizations, with the accompanying increase of the magnetic field fluctuations, with a quasi-period of ∼40–60 s. <Bz>, nT dBt, nT IONS IONS ELECTRONS ELECTRONS 0.633 keV 0.831 keV 1.43 keV 1.88 keV 3.24 keV 4.25 keV 7.31 keV 12.6 keV 16.5 keV 28.5 keV a c e b d f
Fig. 6. The alternation of the low-energy ion and electron bursts during the substorm on 12 March 1991.
The electric field measurements (with 30-s time resolu-tion) during this substorm were presented earlier in Lazutin et al. (2005). Before To, the electric field was very small.
Impulsive enhancements in the electric field were detected, starting at 20:26 UT (Lazutin et al., 2005). After ∼20:31 UT, the CRRES electric field cannot be used due to the spacecraft potential becoming too large and driving the sensor’s pream-plifiers into saturation. During the interval 20:26–20:31 UT, the electric field is nearly zero (in average) and has variations with a period of ∼2 min. We cannot confidently separate the variations with the period of ∼2 min in particle flux data; therefore, we don’t present the electric field data here.
Lower-frequency oscillations with a period of ∼3–4 min, which we observe for particle bursts, are also not seen in electric field. If these oscillations are the same long-period oscillations as in Holter et al. (1995), then they have “a sec-ond harmonic standing wave structure along the magnetic field line and develop as a coupled shear Alfv´en-slow mag-netosonic mode” (Holter et al., 1995). The second harmonic standing wave structure has zero value of the azimuthal elec-tric field at the equatorial plane, where the CRRES satellite was located during considered event. This is a possible ex-planation for the lack of the electric field oscillations.
6 Discussion
The CRRES observation of the substorm on 12 March 1991, when the satellite was located near the inner edge of the
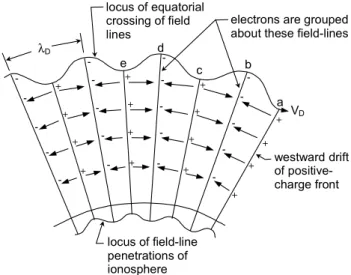
+ + + + + + + + + + + + + + + + -locus of field-line penetrations of ionosphere westward drift of positive-charge front locus of equatorial crossing of field lines
electrons are grouped about these field-lines
VD a b c d e λD
Fig. 7. Illustration of drift-wave resonance of magnetic field lines during azimuthal drift of proton front; adopted from Cladis (1971).
plasma sheet in the pre-midnight sector, supports the near-Earth current disruption (NECD) model of the substorm on-set. The sequence of low-energy particle bursts observed at the CRRES may be a signature of an instability of the sharp transition boundary between different particle populations. Below, we discuss and compare our results with other obser-vations.
6.1 Transition region near the inner edge of the plasma sheet
It is known that the position of the inner edge of the plasma sheet depends on the cross-tail electric field. Lower-energy electrons come closer to the Earth. When the convection electric field increases (for example, during the substorm growth phase) and/or a satellite is moving across the inner edge of the plasma sheet with the radial tailward gradient of particles, the satellite crosses the boundary for one energy of particles after another and the fluxes of the pertinent electron energies will increase. In our case, the same features charac-terized population “A”, which contained the electrons of the energies W ≤1.88 keV. But the inward displacement of the drift orbits causes a decrease in the particle flux at the con-stant energy for the particle population, which has the radial gradient directed toward the Earth, as on the outer bound-ary of trapped particles (Walker et al., 1976; Sauvaud and Winckler, 1980). In our case, before the To, the flux of ions
with energies 9.6–21.7 keV and electrons with the energies 7.31–16.5 keV are decreasing. These trapped particles are “B” population in our notation.
Thus, during the substorm growth phase, the CRRES tra-verses the magnetosphere region where the average energy of the low-energy (≤1.88 keV) electrons is increasing and the density of the ions with W >9.6 keV is decreasing with grow-ing radial distances. The variations of the parallel fluxes J ||
(dashed lines, Fig. 5) of electrons with W ≤1.88 keV in pop-ulation “A” may manifest that the CRRES position is associ-ated with the equatorial edge of the diffuse auroral electron precipitation in the ionosphere. The average energy of the electrons Eeis increasing with latitude λ, so that dEe/dλ>0
(Newell et al., 1996a, b).
When the tail stretching proceeds during the substorm growth phase, both the inner edge of the plasma sheet and the outer edge of the stable trapped particles steepen and the CR-RES observes the formation of the transition boundary be-tween different particle populations with different magnetic field flux tubes at ∼6.3 RE. This boundary may be unstable
to westward travelling perturbations (Roux et al., 1991). The anticorrelation between the ion and electron bursts, found in the investigated substorm on 12 March 1991, is con-sistent with a schematic development of a drift-Alfv´en bal-looning instability at the sharp boundary between “dipole” and “tail-like” magnetic field (Roux, 1985; Roux et al., 1991). At the near-geosynchronous distance, the gradient of plasma pressure and the gradient of the magnetic field are oriented in the same direction (earthward). This situation is potentially unstable to the so-called ballooning modes. Ener-getic ions and electrons, owing to their westward and east-ward drifts, respectively, provide charge separation within the perturbated region with the higher plasma pressure. In-tense auroral forms and WTS associated with enhanced elec-tron precipitation should map to the position where nega-tive charges tend to prevail (Roux, 1985; Kozelova et al., 1986a,b). This disturbance propagates azimuthally as the drift-Alfv´en ballooning wave with k⊥ k||. The disturbance
may persist for 1–2, or even only a half of the wave period and then decays. However, a sharp front of energetic ions may support the development of this disturbance.
6.2 Oscillations associated with a sharp front of energetic ions
The drift-wave resonance of magnetic field lines may be ex-cited by the azimuthal drift of protons when a sharp gradient of the particle flux occurs in the direction of the gradient-B drift (Cladis, 1971). Cladis (1971) showed that the field lines oscillate as standing waves in the meridional plane and form a wave pattern in the azimuthal direction that moves with the phase velocity equal to the mean azimuthal drift velocity of the particles.
Figure 7 contains a schema of the magnetic field lines’ configuration for the drift-wave resonance pattern. This pic-ture is adopted from Fig. 3 of Cladis (1971). In this figure, magnetic field lines that were originally at the same L-shell are shown in their displaced positions (a wave-like line in the equatorial plane, as viewed from above the north pole). According to Cladis (1971), the field lines that are instan-taneously at the minimum displacement positions (“a”, “c” and “e”) contain the maximum positive charge. Those lines
which are instantaneously at maximum displacement posi-tions (“b”, “d”, etc.) contain the maximum negative charge.
Now it is possible to compare the sequence of the al-ternating bursts of the low-energy ions and electrons that are observed during the substorm on 12 March 1991 with the pattern in Fig. 7. A wave-like line on the equatorial plane presents the sharp transition boundary between the re-gions with different characteristics of plasma and magnetic field. The more dipolar-like magnetic field lines with pop-ulation “B” are located in the earthward side of this bound-ary, whereas the tail-like magnetic field lines with popula-tion “A” are located in the tailward side of this boundary. The front of the energetic particles is observed at the more tail-like magnetic field configuration, and the maximum of the first burst of electrons occured at more dipolar magnetic field lines. The observed ion bursts “a”, “c”, and “e” corre-spond to the regions with the positive charge, and the elec-tron bursts “b”, “d”, and “f” correspond to the regions with the negative charge. During electron (2.47–12.6 keV) bursts, the flux of electrons with energies of 0.213–1.88 keV (popu-lation “A”) decreases (panel 1 of Fig. 5). This anticorre(popu-lation of the electron fluxes from different populations is consistent with transitions of a boundary between regions with different populations (“A” and “B”).
While the flux of the population “A” ions abruptly de-creases during the trailing edge of the first burst, the fluxes of the population “B” ions increase. This behaviour of the particle fluxes is consistent with a transition from a tail-like magnetic field region towards a more dipolar magnetic field region (between the points “a” and “b” at Fig. 7). We can interprete all these transitions as a spatial effect associated with the crossings of the transition boundary. Thus, when the wave structure shown in Fig. 7 is passing the satellite, the satellite observes a sequence of the alternating bursts of the low energy ions and electrons.
During the considered event, the oscillations were stim-ulated by the dispersionless (with a resolution of 30 s) jection of ions with the energy of 54–147 keV. This ion in-jection coincides with the appearance of the most equato-rial weak arc, which was observed ∼2 min after the pseudo-breakup “pb2” (Fig. 3) and ∼2 min before To and roughly
20◦eastward of the CRRES. Let us assume that: i) the region of pseudobreakup “pb2” (which occurrs during ∼20:21– 20:23 UT) has a westward expansion with a velocity of about ∼7.7◦/min, as it was obtained for a substorm expansion in Holter et al. (2004); ii) this velocity is constant during a few minutes; and iii) the CRRES was located ∼20◦westward of
the “pb2” onset epicenter. Then, the first indication of the approaching pseudo-breakup “pb2” will appear at CRRES at ∼20:23:30 UT, nearly simultaneously with the high energy ion injection. Although these moments coincide, the lack of dispersion (or a very small dispersion) during the ion injec-tion is evidence of a local accelerainjec-tion of the ions.
The beginning of the ground magnetic field disturbance at the meridian of FAR (∼15◦ westward of the CRRES) that
was observed 2 min after the ion injection onset may be as-sociated with the arrival of the westward drifting ions from the CRRES toward the meridian of FAR.
Note that pseudo-breakups in the ionosphere, the appear-ance of weak magnetic oscillation and the increase of ener-getic ion flux in the magnetosphere, occurring before To, may
testify that the state of the magnetosphere was close to being marginally stable just a few minutes before the moment To.
6.3 Oscillations with a period of 40–60 s
During the substorm of 12 March 1991, the higher-frequency oscillations of the magnetic field, with a period of 40–60 s, were observed during the electron bursts. Note that the elec-tron fluxes during the bursts are larger than the initial elecelec-tron fluxes which occurred before the beginning of the magnetic field line stretching. This fact may indicate that the transition boundary is moving tailward and local acceleration of parti-cles occurs. We suppose that the observed oscillations are probably associated with the kinetic Alfv´en waves.
The importance of kinetic Alfv´en waves for the acceler-ation and anomalous transport of the auroral particles was discussed by Hasegawa (1976), Hasegawa and Mima (1978) and Kremser et al. (1988). Kremser et al. (1988) reported on the occurrence of bi-directional field-aligned beams of elec-trons (16 keV≤E≤80 keV) that were observed near the sub-storm onset by the geosynchronous satellite GEOS 2. The beams lasted for about 90 s (as the bursts) and appeared in the electron pitch angle distributions as the intensity increased at the start of pitch angles of about 20◦(or 160◦)and peaked at
pitch angles of 0◦(or 180◦). These field-aligned beams were
associated with strong increases in the perpendicular electron intensity. Besides, they coincided with strong spatial gradi-ents of the ion intensity and fluctuations of the electric and magnetic fields.
Kremser et al. (1988) considered a model for the beam generation that was based on theoretical investigations by Hasegawa (1976). According to this model, these electron beams may be the result of electron acceleration in the paral-lel electric field of kinetic Alfv´en waves.
We suppose that the electron bursts observed simultane-ously with the magnetic field oscillations during the sub-storm of 12 March 1991 may have a similar origin as the field-aligned electron beams that were observed on GEOS 2 (Kremser et al., 1988). However, in our event, the increase in the flux of field-aligned particles was small. Here it should be noted that before the substorm onset, the CRRES was lo-cated in the pHarang discontinuity sector, where the re-gion 2 field-aligned currents flow toward the ionosphere. It is possible that conditions in this region were not favorable for a more pronounced evolution of the bursts toward the state of the field-aligned electron beams as in Kremser et al. (1988).
6.4 Transition between two regimes of transport
The measurements of the bulk velocity in the plasma sheet (Angelopoulos et al., 1992; Borovsky et al., 1998) indicate that there is a great scattering about the mean velocity. This was interpreted as an evidence of the existence of the turbu-lent transport (Trakhtengerts and Feldstein, 1987; Antonova and Ovchinnikov, 1999).
The presence of the turbulence alters the conductivity and the diffusion properties across the plasma sheet and may per-mit a cross-scale coupling of localized perturbations into a global perturbation. The transition between the two regimes of transport presents a burst-like process with the character-istic time of τ ≤10 s and may correspond to auroral activa-tions and substorm onset (Trakhtengerts and Feldstein, 1987, 1991).
In a quasi-steady state, particularly during the growth phase of substorm, the magnetosphere is in a quasi-steady state with a quasi-static electric field driving a quasi-steady earthward convective flow. However, the transient bursts of fast flows were also observed in the plasma sheet (An-gelopoulos et al., 1992; Nakamura et al., 1994; Le Contel et al., 2001). The standard convection models, based on con-stant electrostatic fields, do not describe this regime of flows. Le Contel et al. (2001) showed that the level of the ULF fluctuations at the proton gyrofrequency seems to control the transition between the two regimes of the plasma transport in the near-Earth plasma sheet: a slow transport during the growth phase and a fast transport during the active phase of the substorm.
Impulsive increases (as short lasting bursts) of these waves were regularly observed at the GEOS 2 during the substorm magnetic field dipolarization (Perraut et al., 1993, 2000; Le Contel et al., 2001). These spatially localized waves are re-lated to field-aligned currents, Perraut et al. (2000) called them the current-driven Alfv´en (CDA) waves. Bursts of CDA waves coincide with the increases in the flux of elec-trons with energy >20 keV at pitch-angles ∼90◦and, simul-taneously, with the increases of low-energy (2.5–7 keV) elec-tron fluxes at pitch-angles <20◦(Perraut et al., 1993, 2000). Also, the high-intensity CDA waves may isotropize and heat the ions (Perraut et al., 1998).
We turn our attention to the substorm of 12 March 1991 from these positions. Then the pseudo-breakups and slow variations of the particles and the magnetic field occurred be-fore Tobecame a signature of convective flow, as well as an
instability, which began to develop slowly. The dispersion-less enhancement of the energetic 54–147 keV proton fluxes and the sequential sharp increase in the electron flux with the energy of 7.32–12.6 keV may correspond to the transition be-tween the convective (laminar) and turbulent regimes of the plasma flows.
7 Summary
In this study we examined the low-energy (30 eV–28.5 keV) particle flux variations observed by the CRRES near the earthward edge of the plasma sheet at L ∼6.3 and ∼20◦ westward the substorm onset during the substorm on 12 March 1991. Some of the main results of the presented anal-ysis are as follows:
1. During the growth phase magnetic field stretch-ing, the ion and electron flux variations depend on the particle energies: the flux of low-energy (with W <Wc=1.88 keV) electrons and ions (0.28–7.31 keV)
is increasing. These particles are convecting toward the CRRES from the tail. The flux of the higher-energy electrons (7.31–16.5 keV) and ions (9.6–21.7 keV) is decreasing. These particles are trapped on the closed drift paths. These changes may imply that both the inner edge of plasma sheet and the outer boundary of higher-energy “old” particles steepen. The transition region be-tween different particle populations of the plasma sheet, dipolar and tail-like flux tubes, narrowed and moved earthwards.
2. The sequence of the alternating bursts of the low-energy ions and electrons begins 2 min before the substorm on-set. The bursts of the ions (0.633–9.6 keV) had a time duration of 100–120 s and a quasi-period of 3–4 min. The ion bursts occurred 1–2 min before the electron (2.47–21.7 keV) bursts. The electron bursts were asso-ciated with the small, local increase in the Bz
compo-nent and in the magnetic field fluctuations.
3. The beginning of the sequence of the low-energy parti-cles bursts coincides with the enhancement of the high-energetic (54–147 keV) ion flux. The enhancement of the high-energetic ion flux happened at the moment of a weak brightening of the most equatorial pre-breakup arc near the latitude ∼62◦.
4. Near the substorm onset, the substorm westward elec-trojet, which is localized ∼20◦westward of the CRRES, increases sharply. Simultaneously, the first injection of electrons was observed in a narrow energy range of 7.31–12.6 keV. This first electron injection began ∼40 s before a significant increase in the Z component of the magnetic field. The injection of higher-energy electrons (12.6–21.7 keV) was observed later, at the beginning of a large substorm expansion.
The variations of the ion and electron bursts may be asso-ciated with the multiple crossings of the transition boundary (discussed above) which has an oscillatory behavior. A sharp gradient of energetic ions in the direction of the gradient-B drift may excite the drift-wave resonance of the magnetic field lines (Cladis, 1971) and support oscillations on the tran-sition boundary. Our analysis supports the idea about the
drift-Alfv´en ballooning instability near the inner edge of the plasma sheet, as associated with the initiation of a substorm onset.
Acknowledgements. Authors are grateful to A. Korth for energetic
particle data and H. Singer for magnetic field data from the CR-RES spacecraft. The authors are grateful to observers and scientists responsible for the ground based magnetic and auroral observations (IMAGE, AASI). The authors thank the SAMNET team for magne-tometer data; SAMNET is a PPARC National Facility operated by Lancaster University. The work of T. V. Kozelova and B. V. Kozelov is supported by the Division of Physical Sciences of the Russian Academy of Sciences (program DPS-18).
Topical Editor I. A. Daglis thanks two referees for their help in evaluating this paper.
References
Angelopoulos, V., Baumjohann, W., Kennel, C. F., Coroniti, F. V., Kivelson, M. G., Pellat, R., Walker, R. J., L¨uhr, H., and Paschmann, G.: Bursty bulk flows in the inner central plasma sheet, J. Geophys. Res., 97, 4027–4039, 1992.
Antonova, E. E. and Ovchinnikov, I. L.: Magnetostatically equi-librated plasma sheet with developed medium scale turbulence: structure and implications for substorm dynamics, J. Geophys. Res., 104, 17 289–17 298, 1999.
Baker, D. N., Pulkkinen, T. I., Angelopoulos, V., Baumjohann, W., and McPherron, R. L.: The neutral line model of substorm: past results and present view, J. Geophys. Res., 101, 12 975–13 010, 1996.
Borovsky, J. E., Thomsen, M. F., and Elphic, R. C.: The driving of the plasma sheet by the solar wind, J. Geophys. Res., 103, 17 617–17 639, 1998.
Cheng C. Z. and Qian, Q.: Theory of ballooning-mirror instabil-ities for anisotropic pressure plasmas in the magnetosphere, J. Geophys. Res., 99, 11 193–11 209, 1994.
Cladis, J. B.: Multiply coupled oscillations of field lines in the mag-netosphere: modulation of trapped particles and ionospheric cur-rents, J. Geophys. Res., 76, 2345–2356, 1971.
Dubyagin, S. V., Sergeev, V. A., Carlson, C. W., Marple, S. R., Pulkkinen, T. I., and Yahnin, A. G.: Evidence of near-Earth breakup location, Geophys. Res. Lett., 30, 1282, doi:10.1029/2002GL016569, 2003.
Erickson, G. M., Maynard, N. C., Wilson, G. R., and Burke, W. J.: Electromagnetics of substorm onsets in the near-geosynchronous plasma sheet, Proc. 5th International Conference on Substorms, St.-Petersburg, Russia, 16–20 May 2000 (ESA SP-443, July 2000), 385–388, 2000.
Frank, L. A. and Sigwarth, J. B.: Findings concerning the positions of substorm onsets with auroral images from the Polar spacecraft, J. Geophys. Res., 105, 12 747–12 761, 2000.
Galperin, Y. I. and Feldstein, Y. I.: Auroral luminosity and its rela-tionship to magnetospheric plasma domains, in: Auroral Physics, edited by: Meng, C. I., Rycroft, M. J., and Frank, L. A., 207–222, Cambridge Univ. Press, New York, 1991.
Hardy, D. A., Walton, D. M., Johnstone, A. D., Smith, M. F., Gough, M. P., Huber, A., Pantazis, J., and Burkhardt, R.: Low Energy Plasma Analyzer, IEEE Trans. Nucl. Sci., 40, 246–251, 1993.
Hasegawa, A. and Mima, K.: Anomalous transport produced by kinetic Alfven waves turbulence, J. Geophys. Res., 83, 1117– 1123, 1978.
Hasegawa, A.: Particle acceleration by MHD surface wave and for-mation of aurora, J. Geophys. Res., 81, 5083–5090, 1976. Heppner, J. P.: The Harang discontinuity in auroral belt ionospheric
currents, Geofysiske Publikasjoner, 29, 105–120, 1972. Holter, Ø., Altman, C., Roux, A., Perraut, S., Pedersen, A., P´ecseli,
H., Lysekk, B., Trulsen, J., Korth, A., and Kremser, G.: Charac-terization of low frequency oscillations at substorm breakup, J. Geophys. Res., 100, 19 109–19 119, 1995.
Holter, Ø., Galopeau, P., Roux, A., Perraut, S., Pedersen, A., Ko-rth, A., and B¨osinger, T.: Two satellite study of substorm expan-sion near geosynchronous orbit, Ann. Geophys., 22, 4299–4310, 2004.
Iijima, T. and Potemra, T. A.: Large scale charactetistics of field-aligned currents associated with sibstorms, J. Geophys Res., 83, 599–615, 1978.
Jacquey, C., Sauvaud, J. A., and Dandouras, J.: Location and propa-gation of the magnetotail current disruption during substorm ex-pansion: analysis and simulation of an ISEE multi-onset event, Geophys. Res. Lett., 18, 389–392, 1991.
Kaufmann, R. L.: Substorm currents: growth phase and onset, J. Geophys Res., 92, 7472–7489, 1987.
Kaye, S. M. and Kivelson, M. G.: Time dependent convection elec-tric fields and plasma injection, J. Geophys. Res., 84, 4183–4188, 1979.
Kerns, K. J., Hardy, D. A., and Gussenhoven, M. S.: Modeling of convection boundaries seen by CRRES in 120-eV to 28-keV particles, J. Geophys. Res., 99, 2403–2414, 1994.
Korth, A., Kremser, G., Wilken, B., Guttler, W., Ullaland, S. L., and Koga, R.: Electron and proton wide-angle spectrometer (EPAS) on the CRRES spacecraft, J. Spacecraft Rockets, 29, 609–614, 1992.
Kozelova, T. V., Lazutin, L. L., Kozelov, B. V., Meredith, N., Danielides, M., Jussila, J., and Korth, A.: Multiple-onset sub-storm case study: pre-onset, auroral onset and expansion, Proc. 7th International Conference on Substorm, Levi, Lapland, Fin-land, 21–27 March 2004, 176–179, 2004.
Kozelova, T. V. and Sakharov, Ya. A.: Configuration of the mag-netic field in a geostationary orbit during a substorm, Geomag-netism and Aeronomy, 29(2), 213–216, 1989.
Kozelova, T. V., Kozelov, B. V., and Lazutin, L. L.: Substorm large impulsive electric fields observed by CRRES, Proc. 5th Interna-tional Conference on Substorms, St.-Petersburg, Russia, 16–20 May 2000 (ESA SP-443, July 2000), 393–396, 2000.
Kozelova, T. V., Lazutin, L. L., and Kozelov, B. V.: Dipolarization and the current perturbations in the magnetosphere from the CR-RES satellite data, Geomagnetism and Aeronomy (in Russian), 39(1), 15–26, 1999.
Kozelova, T. V., Treilhou, J.-P., Korth, A., Kremser, G., Lazutin, L. L., Melnikov, A., Pedersen, A., and Sakharov, Ya.: The active phase of the substorm from ground based and satellite data, Geo-magnetism and Aeronomy (in Russian), 26(6), 963–969, 1986a. Kozelova, T. V., Pudovkin, M. I., Lazutin, L. L., Pedersen, A., and Glassmeier, K.-H.: The electric field behaviour in the magneto-sphere on 6.6 REwithin active region during the substorm,
Kremser, G., Korth, A., Ullaland, S. L., Perraut, S., Roux, A., Ped-ersen, A., Schmidt, R., and Tanskanen, P.: Field-aligned beams of energetic electrons (16 keV≤E≤80 keV) observed at geosyn-chronous orbit at substorm onsets, J. Geophys. Res., 93, 14 453– 14 464, 1988.
Lazutin, L. L., Kozelova, T. V., Danielides, M., Meredith, N., Kozelov, B. V, Jussila, J., and Korth, A.: Aurora, currents and particle dynamics in the inner magnetosphere: case study of multiple-onset substorm of March 12, 1991, Proc. 31st Annual European Meeting on Atmospheric Studies by Optical Methods and 1st International Riometer Workshop, 22 to 28 August 2004, Ambleside, The Lake District, UK, 50–72, 2005.
Lazutin, L. L., Korth, A., and Kozelova, T. V.: Fast bursts of high energy protons and their role in triggering of the substorm on-set instability, Proc. Sixth International Conference on Substorm, Seattle, 340–346, 2002.
Le Contel, O., Roux, A., Perraut, S., Pellat, R., Holter, O., Ped-ersen, A., and Korth, A.: Possible control of plasma transport in the near-Earth plasma sheet via current-driven Alfven waves (f∼=fH +), J. Geophys. Res., 106, 10 817–10 827, 2001.
Lopez, R. E., Spence, H. E., and Meng, C.-I.: DMSP F7 observa-tions of a substorm field-aligned current, J. Geophys. Res., 96, 19 409–19 415, 1991.
Lui, A. T. Y.: A synthesis of magnetospheric substorm models, J. Geophys. Res., 96, 1849–1856, 1991.
Lui, A. T. Y.: Estimates of current changes in the geomagnetotail as-sociated with a substorm, Geophys. Res. Lett., 5, 853–856, 1978. Maynard, N. C., Burke, W. J., Basinska, E. M., Erickson, G. M., Hughes, W. J., Singer, H. J., Yahnin, A. G., Hardy, D. A., and Mozer, F. S.: Dynamics of the inner magnetosphere near times of substorm onsets, J. Geophys. Res., 101, 7705–7736, 1996. McPherron, R. L., Russel, C. T., and Aubry, M. P.: Satellite
stud-ies of magnetospheric substorms on August 15, 1968, 9. Phe-nomenological model for substorms, J. Geophys Res., 78, 3131– 3149, 1973.
Mende, S. B., Carlson, C. W., Frey, H. U., Peticolas, L. M., and Ostgaard, N.: FAST and IMAGE-FUV observa-tions of a substorm onset, J. Geophys. Res., 108(A9), 1344, doi:10.1029/2002JA009787, 2003.
Miura, A., Ohtani, S., and Tamao, T.: Ballooning instability and structure of diamagnetic hydromagnetic waves in a model mag-netosphere, J. Geophys. Res., 94, 15 231–15 242, 1989. Nakamura, T., Baker, D. N., Fairfield, D. H., Mitchell, D. G.,
McPherron, R. L., and Hones Jr., E. W.: Plasma flow and mag-netic field characteristics near the midtail neutral sheet, J. Geo-phys. Res., 99, 23 591–23 602, 1994.
Newell, P. T., Feldstein, Ya. I., Galperin, Yu. I., and Meng, C.-I.: Morphology of nightside precipitation, J. Geophys. Res., 101, 10 737–10 748, 1996a.
Newell, P. T., Feldstein, Ya. I., Galperin, Yu. I., and Meng, C.-I.: Correction to “Morphology of nightside precipitation”, J. Geo-phys. Res., 101, 17 419–17 421, 1996b.
Perraut, S., Le Contel, O., Roux, A., Pellat, R., Kort, A., Holter, O., and Pedersen, A.: Disruption of parallel current at substorm breakup, Geophys. Res. Lett., 27, 4041–4044, 2000.
Perraut, S., Le Contel, O., Roux, A., Pellat, R., Pedersen, A., and Kort, A.: Evidence for a substorm trigger, in: Substorm-4, edited by: Kokubun, S. and Kamide, Y., Astrophysics and space science library, 238, 349–354, 1998.
Perraut, S., Morane, A., Roux, A., Pedersen, A., Schmidt, R., Kort, A., Kremser, G., Aparicio, B., and Pellinen, R.: Characteriza-tion of small scale turbulence observed at substorm onsets: rela-tionships with parallel acceleration of particles, Adv. Space Res., 13(4), 217–222, 1993.
Roux, A., Perraut, S., Robert, P., Morane, A., Pedersen, A., Ko-rth, A., Kremser, G., Aparicio, B., Rodger, D., and Pellinen, R.: Plasma sheet instability related to the westward traveling surge, J. Geophys. Res., 96, 17 697–17 714, 1991.
Roux, A.: Generation of field-aligned current structures at substorm onset, Proc. ESA Workshop on Future Missions in Solar, Helio-spheric nd Space Plasma Physics, Garnisch-Partenkirchen, Ger-many, ESA SP-235, 151–159, 1985.
Samson, J. C., Lyons, L. R., Xu, B., Creutzberg, F., and Newell, P.: Proton aurora and substorm intensifications, Geophys. Res. Lett., 19, 2167–2170, 1992.
Sauvaud, J.-A. and Winckler, J. R.: Dynamics of plasma, ener-getic particles, and fields near synchronous orbit in the nighttime sector during magnetospheric substorms, J. Geophys. Res., 85, 2043–2056, 1980.
Sergeev, V. A., Malkov, M. V., and Mursula, K.: Testing the isotropic boundary algorithm method to evaluate the magnetic field configuration in the tail, J. Geophys. Res., 98, 7609–7620, 1993.
Singer, H. J., Sullivan, W. P., Anderson, P., Mozer, F., Harvey, P., Wygant, J., and McNeil, W.: Fluxgate magnetometer instrument on the CRRES, J. Spacecraft Rockets, 29, 599–601, 1992. Trakhtengerts, V. Yu. and Feldstein, A. Ya.: Turbulent regime of
magnetospheric convection, Geomagnetism and Aeronomy (in Russian), 27, 258–264, 1987.
Trakhtengerts, V. Yu. and Feldstein, A. Ya.: Turbulent Alfven boundary layer in the polar ionosphere 1. Excitation conditions and energetics, J. Geophys. Res., 96, 19 363–19 374, 1991. Tsyganenko, N. A.: Magnetospheric magnetic field model with a
warped tail current sheet, Planet. Space Sci., 37, 5–20, 1989. Walker, R. J., Erickson, K. N., Swanson, R. L., and Winckler, J. R.:
Substorm-associated particle boundary at synchronous orbit, J. Geophys. Res., 81, 5541–5550, 1976.
Yago, K., Shiokawa, K., Hayashi, K., and Yumoto K.: Auroral par-ticles associated with a substorm brightening arc, Geophys. Res. Lett., 32, L06104, doi:10.1029/2004GL021894, 2005.