HAL Id: insu-01969532
https://hal-insu.archives-ouvertes.fr/insu-01969532
Submitted on 27 Aug 2020HAL is a multi-disciplinary open access archive for the deposit and dissemination of sci-entific research documents, whether they are pub-lished or not. The documents may come from teaching and research institutions in France or abroad, or from public or private research centers.
L’archive ouverte pluridisciplinaire HAL, est destinée au dépôt et à la diffusion de documents scientifiques de niveau recherche, publiés ou non, émanant des établissements d’enseignement et de recherche français ou étrangers, des laboratoires publics ou privés.
Calculate the Energy of Active Regions and Solar Disk
on Satellite Images for Real-Time Solar Flare
Forecasting
O.W. Ahmed, Rami Qahwaji, T. Colak, Stan Ipson, Thierry Dudok de Wit
To cite this version:
O.W. Ahmed, Rami Qahwaji, T. Colak, Stan Ipson, Thierry Dudok de Wit. Calculate the Energy of Active Regions and Solar Disk on Satellite Images for Real-Time Solar Flare Forecasting. International Conference on Cyberworlds (CW 2009), Sep 2009, Bradford, United Kingdom. �10.1109/CW.2009.18�. �insu-01969532�
Calculate the Energy of Active Regions and Solar Disk on Satellite Images for
Real-Time Solar Flare Forecasting
O. W. AHMED, R. QAHWAJI, T. COLAK, and S. IPSON
School of Computing, Informatics and Media University of Bradford, Bradford BD7 1DP, UK e-mail: O.W.Ahmed@bradford.ac.uk, r.s.r.qahwaji@bradford.ac.uk, t.colak@bradford.ac.uk, S.S.Ipson@Bradford.ac.uk T. DUDOK DE WIT LPCE / CNRS,
Orleans University, 3A Av. de la Recherche Scientifique,
45071 Orleans cedex 2, France e-mail: ddwit@cnrs-orleans.fr
Abstract—It is extremely important to design preventive
measures to avoid or mitigate the influence of space weather. Severe solar activities could have a catastrophic impact on human activities in general i.e. damaging satellites, flight navigation, power distribution stations, telecommunications, etc. In this paper, a new model has been designed and implemented to calculate the energy of solar active regions and the solar disk energy. The method has been tested in a series of experiments and a relationship has been found between the calculated energies and solar flare events. A final automated real-time model will be designed later to provide flare forecasting, based on the proposed model.
Keywords-active region energy; solar disk energy; satellite images; Ising model.
I. INTRODUCTION
Research and interest in the field of space weather and solar activities is growing because of the significance of their potential impact on human lives and activities. The term space weather is applied to the space environment around the Earth and all the way to the Sun. Space weather is defined as the “conditions on the Sun and in the solar wind, magnetosphere, ionosphere, and thermosphere that can influence the performance and reliability of space-born and ground-based technological systems and can endanger human life or health. Adverse conditions in the space environment can cause disruption of satellite operations communications, navigation, and electricity power distribution grids, leading to a variety of socioeconomic losses” [1] [2] [3]. Human activities are becoming more vulnrable from the potential effects of space weather, especially with the increasing reliance on technology as an essential element of our daily lives. Space weather and solar activities are both directly influenced by the Sun. As such it is important to study the Sun in order to have a good underdanding of its influence on space weather [1].
Two main types of energy are continuously emmited from the Sun into space: electromagnetic (EM) radition and corpuscular radation. EM radiation consists of
visible light, radio waves, microwaves, infrared, ultraviolet, X-ray, and gamma rays. Corpuscular radiation includes the solar wind, which is full of charged atoms and sub-atomic particles (mainly protons and electrons) which expand out to the solar system carrying the Sun’s magnetic field. Solar winds affect the Earth’s environment in a number of ways. They cause changes to the upper atmosphere of the Earth which results in a natural coloured light display in the sky near the northern and southern poles known as
aurorae, as well as carrying large electrical currents
that can disrupt communication, power grids, and satellite navigations [1]. These energies are mainly associated with the following solar activity; Solar
Flares and Coroal Mass Ejections (CMEs). Solar flares
and CMEs are the most remarkable solar activities which drive space weather and affect the terrestrial enviromnent [4]. These two types of solar eruptions can spew vast quantities of radition and charged particles into space [5]. Threfore, it is essential to be able to predict these violent eruptions prior to their occurance to mitigate their consequences. In the past, few solar activities have affected the Earth and caused notable damage. In March 1989, a large CME hit the Earth causing severe power outages to a province in eastern Canada. During the period, from 25/10/2003 to 04/11/2003, the largest ever recorded X-ray flare occurred, known as the Halloween solar storm which caused serious problems on Earth. It damaged 28 satellites (knocking two out of commission), causing airplane routes to be diverted and power failures in Sweden, and other countries [6] [7].
The work presented here demonstrates some recent developments in our ongoing efforts to design web-based, automatic and real-time systems for the prediction of significant solar flares. Therefore it is important to understand the associated solar features such as Sunspots and Active Regions, which are related to flares. Sunspots are seen as dark features in the photosphere and range from simple pore-like structures to very complex structures. They appear darker in comparison with the surrounding photosphere because they are cooler. They are also associated with very 2009 International Conference on CyberWorlds
strong and complicated magnetic fields. Their sizes vary from approximately 300 km, for small pores, to diameters in excess of 100,000 km, which is almost eight times the diameter of the Earth. The lifetime of a sunspot also varies from less than one hour to more than 6 months [8]. Sunspots can be classified according to two methods: Mt. Wilson and McIntosh. Mt. Wilson observatory set rules to classify sunspots according to their magnetic polarity distribution [9]. McIntosh classification was invented in 1966 by Patrick S. McIntosh of the National Oceanic and Atmospheric Administration’s (NOAA) Space Environment Center (SEC) [10]. This method was a modified version of the Zurich sunspot classes [11]. McIntosh’s classification describes the primary properties of a sunspot using three parameters: Z gives the Modified Zurich Class, p describes the penumbra of the largest spot, and c gives the sunspot description. McIntosh classification is the standard method used for international solar data publications and interchange [10]. Active regions are regions on the Sun which usually form with sunspot groups. Sunspots are one component of active regions that are studied in order to forecast solar activity [12]. There exists a wide-range of spectral emissions associated with active regions, ranging from X-rays to decimetric radio waves. Solar active regions are associated with particularly strong and complex magnetic fields which create suitable conditions for the release of enormous amounts of energy in the form of solar flares. This energy can lead to the acceleration of atomic particles which may increase its energetic status and make it capable of affecting terrestrial systems and orbiting satellites. Understanding this energy is important as it aids our ability to predict solar eruptions, such as solar flares as well as CMEs. Flares are sudden, rapid, and intense variations in brightness that occur when the magnetic energy that has built up in the solar atmosphere is suddenly released, over a period lasting from minutes to hours. Flares emit strong radiations such as radio waves, X-rays and gamma rays, releasing very large amounts of energy equivalent to millions of 100-megaton hydrogen bombs exploding at the same time. Solar flares regularly occur in active regions where sunspots exist because the magnetic fields there are always stronger. However, flares could occur even when spots are not present in the region. They are most frequent during the rapid growth stage of an active region’s development. Numerous small flares often occur during the initial formation stage of a sunspot group, while in other small regions they might not occur until after a sunspot has already formed. This is because each sunspot region is different and has its own "character". Flares are created through the sudden release of a massive amount of energy [8].
There is an urgent need to develop preventative measures capable of reducing the risks associated with space weather events, by introducing either a system design or efficient warning and prediction systems [3] [13]. This paper introduces a new method to calculate the energy of active regions as well as the total energy
of the whole solar disk in satellite images for the purpose of solar flare prediction. Daily solar images from the Solar & Heliospheric Observatory (SOHO) satellite are used in this study.
In this work, we introduce an algorithm for the real-time calculation of magnetic energy in the detected active regions in MDI images. The energy calculation algorithm is based on the famous physical Ising model [14]. The Ising model has been modified to fit the properties of this application. More details about the original Ising model and the earlier modified model can be found in our previous publications [15] [16]. The energy calculation method introduced here is the latest updated method, which is better fitted to imitate the property of active regions and flares. This method has been tested in a series of experiments. Energies have been calculated and plotted with flare events occurred within the same region and time. A clear relationship has been noticed between the recorded energies and flares. As such, the energy calculation method proposes an opportunity to provide more parameters that could be integrated with our existing flares prediction technology to deliver enhanced predictions. The Automated Solar Activity Prediction (ASAP) is an automated solar forecasting system which predicts flares based on the McIntosh classification of sunspots and sunspots areas [17], [18]. ASAP is available online (http://spaceweather.inf.brad.ac.uk). The aim of integrating the energy calculation method with ASAP is to build a coherent system capable of predicting flares based on a number of related factors which are; sunspot
McIntosh classification, active region energy, the whole solar disk energy, solar cycle and active region area.
The final model will determine these factors automatically and in a real-time mode using up-to-date daily solar images.
This paper is organized as follows; solar data sources are introduced in section II. Section III introduces our energy calculation method. Section IV describes calculating the energy of active regions. Section V describes calculating the total energy of the whole solar disk. The conclusion and future work are described in section VI.
II. SOLAR DATE
A. Satellite Images
SOHO/MDI magnetogram images in GIF format (Graphic Interchange Format) are used in this work. SOHO (Solar and Heliospheric Observatory) is a joint ESA (European Space Agency) and NASA (National Aeronautics and Space Administration) collaboration to study the Sun from its deep core to the outer corona
(http://sohowww.nascom.nasa.gov). MDI magnetograms record the line-of-sight components of
the magnetic field on the solar disk, as shown in Figure 1 [19]. There are around 15 SOHO/MDI magnetogram images in gif format available per day. This is beneficial for the energy calculation method, in terms of 225
representing the magnetic fields of the solar disc and calculating the energy. The MDI magnetogram images are used in this work because they show the strength and location of the magnetic fields on the Sun which makes them well suited for energy calculation. In MDI magnetogram images, the gray areas indicate regions with minimum magnetic energies, while the black and white regions indicate strong magnetic fields. The black regions indicate “south” magnetic polarity (pointing towards the Sun), while white regions indicate “north” magnetic polarity (pointing outward the Sun) [20].
B. NGDC Flare Catalogue
In this research solar flare catalogues provided by National Geophysical Data Center (NGDC) are used. NGDC holds one of the most comprehensive public databases available for solar features and activities recorded from several observatories around the world and it is available online (ftp://ftp.ngdc.noaa.gov/STP/SOLAR_DATA/). The NGDC flare events catalogues include full details about flares. Erupted flares are represented according to their X-ray intensity as follows: B, C, M, or X, (B is the weakest and X is the strongest). These catalogues also record the NOAA number for the active region associated with the recorded flare. The NOAA number is a unique number, for each active region, given by the National Oceanic and Atmospheric Administration. This is very useful to compare flares and the corresponding active region. However, not all of the recorded flares have their NOAA number provided. This could be related to a difficulty in assigning a flare to the right active region, especially during solar maximum when in some scenarios active regions could be attached to or in a group of complex active regions.
Figure 1 SOHO/MDI Magnetogram Image.
III. THE ENERGY CALCULATION METHOD The idea of the energy calculation method is based on the association between the energy stored in the magnetic fields of active regions and flare eruptions. The energy calculation method is derived from the physical Ising model. The Ising model [14] is a
simplified model used for the analysis of magnetic interactions and structures of ferromagnetic substances. This model allows for the simplification of complex interactions, since it has been successfully employed in several areas of science. The Ising model has been applied to many physical systems such as: magnetism, binary alloys, and the liquid-gas transition [21]. The model was also used in Biology to model neural networks, flocking birds and beating heart cells [22] [23] [24]. Between 1969 and 1997, more than 12,000 papers were published using this model in different applications, which shows the importance and potential of this model [25]. For the first time, the Ising model has been modified to better suit the nature of solar properties and has been applied to calculate the energy of solar active regions. Further details about the original Ising model and the modified Ising model can be found in our previous publications [15] [16].
Further modifications have been applied to the modified model. The new model (the energy calculation method) imitates active regions and flare properties to provide more accurate results. The calculated energy should provide a new way to indicate the flaring and non-flaring active regions, or even X-ray flare class. In some cases solar flares have not been associated with active regions as discussed in section 2.2. As such the energy calculation algorithm has also been applied to calculate the total energy of the whole solar disk. This could help in indicating the overall activities status of the Sun, and could be an important element in flare prediction. SOHO/MDI magnetogram images are used in energy calculation. The magnetogram images are processed and represented in a two dimension grid, according to pixels intensities, in order to calculate the energy. Each pixel value in the magnetogram image is represented in the grid as follow:
• The black colored areas (pixel value less than 30), which indicate a “south” magnetic polarity, are represented as -1’s in the grid.
• The white colored areas (pixel value greater than 230), which indicate a “north” magnetic polarity, are represented as +1’s in the grid.
• The gray colored areas (pixel value between 30-230), which indicate minimum magnetic energies, are represented as 0’s in the grid.
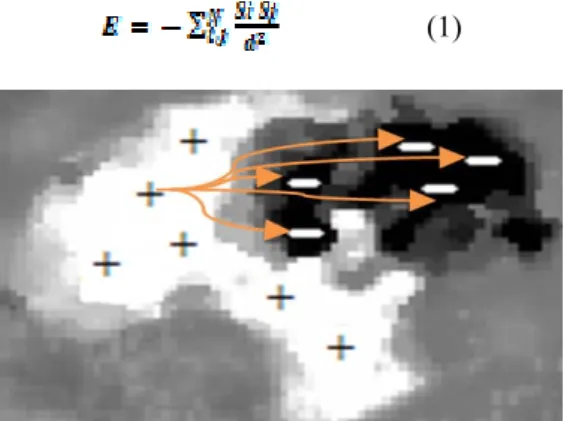
The energy calculation method is based on equation (1) which will only take the following values as an input; 0, +1, and -1. In the equation, Si represents the north polarity areas only (+1), and Sj represents the south polarity areas only (-1). The magnetic fields in active regions loop from the positive magnetic fields to the negative magnetic fields. This property has been applied to the energy calculation method. The multiplication goes only from the values representing the positive magnetic fields (Si) to the negative magnetic fields (Sj) as shown in Figure 2, taking into consideration the distance (d) between the interacting spins. N is the number of the total spins (the 2-D grid values). E is the total energy, and it is unit-less.
(1)
Figure 2 A sample of an active region shows the magnetic configuration and interaction. According to the energy calculation method, each spin within the white area (+) will be multiplied by all the spins in the black area (-).
IV. CALCULATING THE ENERGY OF ACTIVE REGIONS The aim of this method is to calculate the energy of active regions for the purpose of solar flare prediction. A number of procedures and image processing techniques are applied to the MDI magnetogram images, prior to calculating the energy. These procedures are part of the energy calculation method for active regions and they are summarized as follow:
• MDI magnetograms record the line-of-sight component of the magnetic fields on the solar disk. In this work it is important to have the magnetic fields on the MDI magnetogram images represented accurately. Due to the projection effect, it was noticed that active regions located near the solar limb were distorted and it was difficult to observe and record the line-of-sight component of the magnetic fields of these regions. As explained in [26], data far from the solar disk is less reliable because of the observing angle correction factor. This lead to inaccurate representations of the active regions located near the solar limb. In order to resolve this problem, the MDI magnetogram image has been re-mapped to the Heliocentric-Cartesian so the investigated active region relocated to the center of the solar disk, using the method employed in [27]. However, despite remapping the solar images, it was noticed that several active regions located near the solar limb were still distorted. Therefore, active regions located within 45° from the solar limb, which is equivalent to three days, were discarded.
• Most of the MDI magnetogram images used in this work included a random noise. As such, there was a need to apply an image filtering algorithm to reduce the noise in these images. The Median filter was applied for this purpose. This filter is quite popular due to the excellent noise reduction capability it could provide for certain types of random noise [28]. A (3 × 3) Median filter was applied to each image. An example of an active
region image before and after applying the median filter is shown in Figure 3. This means that the new algorithm is more likely to achieve reliable results because better quality images are used. • The active region under investigation is detected
and cropped from the MDI image in order to calculate its energy. The energy calculation method is explained in section III.
Figure 3 An active region before (Left) and after (Right) applying the 3 × 3Median filter.
Active regions candidates selected from different period of times, during solar minimum and solar maximum, were experimented. The calculated energies of the investigated active region are then compared to the flares which erupted from the same region, and they are both plotted against time. According to the NOAA number and date, these active regions are: (308 08/03/2003-18/03/2003), (314 13/03/2003-18/03/2003), (365 20/05/2003-01/06/2003), (482 17/10/2003-27/10/2003), (482 17/10/2003-30/10/2003), (486 25/10/2003-03/11/2003), (488 25/10/2003-03/11/2003), (507 19/11/2003-30/11/2003), (9393 24/03/2001-02/04/2001), (956 17/05/2007-21/05/2007). Studying these groups of active regions, it has been found that active region can be classified into three classes, according to their energy:
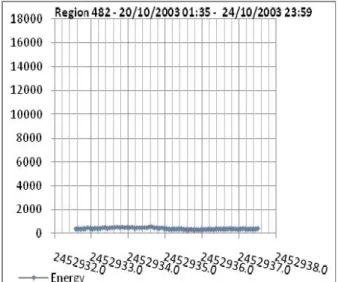
1. Non-Flaring Active Regions, Energy < 600. These active regions were holding very low energy and occasionally were accompanied with few B flares. This can be seen in region 482, shown in Figure 4. 2. Steady Increase Regions, 600 < Energy < 10,000.
Active regions within this energy range usually had steady increase in their energy. Flares of type C, M and X were erupted as the energy increasing. Also, it has been noticed that flares occurred as groups separated by approximately 10hrs. This can be seen in region 365, shown in Figure 5.
3. Highly Energetic Regions, Energy > 10,000. Those active regions were holing very high energy, accompanied by high number of flares of type C, M and X. Also, it has been noticed that erupted flares were separated by short time intervals. This can be seen in region 9393, shown in Figure 6.
As a conclusion, these classifications are a key to determine the state of active regions which could help to increase the accuracy of our flare prediction model. 227
Figure 4 The curve represents the energy of active region 482.Very low energy and no flares were recorded within the region.
Figure 5 The curve represents the energy of active region 365. A gradual build up in energy with flares occurred as groups separated by a period of time.
Figure 6 The curve represents the energy of active region 9393. The energy is very high, accompanied by a high number of flares with short time intervals.
V. CACLCULATE THE ENERGY OF THE WHOLE SOLAR DISK
On many occasions, especially during the solar maximum when number of sunspots and active regions are high, it is difficult to assign erupted flares to active regions in particular with a group of neighbouring active regions. This can be noticed in the NGDC flare catalogue events, where many flares are recorded but not assigned to an active region or a location. Therefore, the whole solar disk energy calculation method was designed. This energy could be used in different scenarios. Currently, the whole solar disk energy will be used to determine the overall solar activity of the sun and predicting solar flares. The procedure of this method is as follow:
• First the MDI magnetogram image is filtered using the Median filter. This is similar to filtering active regions, as explained in section IV.
• Then the total energy of the solar disk is calculated, as explained in section III.
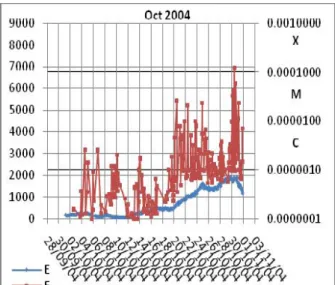
This method has been experimented using MDI magnetogram images over a number of months; April 2001, June 2003, March 2001, March 2003, May 2003, May 2005, May 2007, November 2003, October 2003, October 2004. The calculated energies have been plotted against flares that occurred during the same period. From the plots, a clear relationship between the two curves can be seen. It can be concluded that the number of flare events increases with the increase of the solar disk energy, and vice versa. Some of the results are shown in Figure 7, Figure 8 and Figure 9. This method will be used to find the ratio between the active regions energy and the solar disk energy, which could lead to a better flare prediction model.
Figure 7 This plot shows the solar disk energy and flares which ocured in Octber 2003.
Figure 8 This plot shows the solar disk energy and flares which ocured in October 2004.
Figure 9 This plot shows the solar disk energy and flares which ocured in May 2007.
VI. CONCLUSION AND FUTURE WORK This paper proposes a new method to calculate the energy of solar active regions as well as the total energy of the solar disk, using SOHO/MDI magnetogram images for the purpose of creating an automated real-time flare prediction system. The active region energy calculation method and the whole solar disk energy calculation method follow the same concept. The model has been developed using C++ programming language. The recorded energies from each method and the related flare events are plotted against time. Using the plots, a clear relationship has been found between the energies produced from each method with the flare events. This finding is significant as it can be used to create a new flare prediction model, or it could be added to the existing flare forecasting system, ASAP, to enhance prediction accuracy. Using the daily updated SOHO magnetogram images, the current system is capable of
calculating energies in real-time. However, the exact correlation between the calculated energies and flares need to be determined. This will be done using statistical methods or machine learning techniques. Neural networks machine learning will be used to train the energies data against flare data in order to find the correlation between these data sets. Also, other data sets: sunspots McIntosh classifications, active region area and number of sunspots as well as the active regions and solar disk energies, will be trained using neural networks machine learning to find the correlation between them in relation to flares. Then the final flare prediction model will be decided according to the results from each method.
REFERENCES
[1] M. Moldwin, An Introduction to Space Weather.
Los Angeles, 2008.
[2] O. o. t. F. C. f. Meteorology, "National Space
Weather Program Strategic Plan," 1995.
[3] H. Koskinen, E. Tanskanen, R. Pirjola, and A.
Pulkkinen, "SPACE WEATHER EFFECTS CATALOGUE," ESA Space Weather Study
(ESWS), January 2 2001.
[4] M. Pick, C. Lathuillere, and J. Lilensten, "Ground Based Measurements," ESA Space Weather
Programme Feasibility Studies, 2001.
[5] D. Lenz, "Understanding and Predicting Space
Weather," The Industrial Physicist, pp. 18-21, 2004.
[6] S. T. Online, "Halloween Storm Surge Shocks
Earth." vol. 2008: Space Today Online, 2004. [7] R. Qahwaji and T. Colak, "Automatic Prediction of
Solar Flares using Machine Learning: Practical Study on the Halloween Storm," in IEEE conference
on Recent Advances in Space Technologies Istanbul:
IEEE, 2007.
[8] S. T. Dispatch, "Internet Space Weather And Radio Propagation Forecast Course," Solar Terrestrial Dispatch, 1996-2001.
[9] G. E. Hale, Ellerman, F., Nicholson, S. B., & Joy, A. H., "The Magnetic Polarity of Sun-Spots,"
Astrophysical Journal, vol. 49, p. 153, 1919.
[10] P. S. McIntosh, "The Classification Of Sunspot Groups," Solar Physics, vol. 125, pp. 251-267, Feb 1990.
[11] R. W. Miller, "WOLF - A Computer Expert System for Sunspot Classification and Solar Flare Prediction," in Knowledge-Based Systems in
Astronomy. vol. 329: Springer Berlin / Heidelberg,
1989, p. 1.
[12] D. Hathaway, Wilson, R.M & Reichmann, E.J.,
Solar Physics, pp. 151, 177, 1994.
[13] J. Feynman and S. B. Gabriel, "On Space Weather Consequences and Predictions," J Geophys. Res., vol. 105, pp. 10 543- 10 564, 2000.
[14] E. Ising, "Beitrag zur Theorie des Ferromagnetismus," Z. Phys, vol. 31, pp. 3-4, 1925.
[15] O. Ahmed, R. Qahwaji, T. Colak, T. Dudok De Wit,
and S. Ipson, "A new method for processing solar images to calculate the magnetic energies associated with active regions," in Systems, Signals and
Devices, 2008. IEEE SSD 2008. 5th International Multi-Conference on, 2008, pp. 1-5.
229 229
[16] O. Ahmed, R. Qahwaji, T. Colak, T. Dudok De Wit, and S. Ipson, "Applying a modified ising algorithm to calculate the energy of solar active regions in solar images," in Communications, Computers and
Applications, 2008. MIC-CCA 2008. Mosharaka International Conference on, Amman, 2008, pp.
43-48.
[17] R. Q. T. Colak, "ASAP: A Hybrid Computer Platform Using Machine Learning and Solar Imaging for Automated Prediction of Significant Solar Flares," SPACE WEATHER, 2008.
[18] T. C. R. Qahwaji, "Automatic Detection and
Verification of Solar Features," International
Journal of Imaging Systems Technology, vol. 15,
pp. 199-210, 2005.
[19] S. NetLinks, "Tracking the Movement of Sunspots," Science NetLinks.
[20] K. R. Lang, Sun, Earth and Sky: Springer, 1995. [21] J. P. Sethna, "Statistical Mechanics: Entropy, Order
Parameters, and Complexity," OXFORD, 2007. [22] Rowe GW and T. LE, "A thermodynamic theory of
codon bias in viral genes," J Theor Biol, vol. 101, pp. 171–203, 1983.
[23] I. A, P. C, and P. F, "Evidence for nonrandom
hydrophobicity structures in protein chains," Proc
Natl Acad Sci USA vol. 93, pp. 9533–9538, 1996.
[24] R. J. Ahsan A, Bruinsma R, "Elasticity theory of the B-DNA to S-DNA transition," Biophys J, vol. 74, pp. 132–137, 1998.
[25] S. T. Wierzchon, "Ising Model," E. W. Weisstein, Ed.: WOLFRAM RESEARCH, 1996-2007.
[26] M. J. Knoll, K.D. Leka, G. Barnes, "Statistical Prediction of Solar Flares Using Line of Sight Magnetogram Data," 31 July 2008.
[27] T. Colak and R. Qahwaji, "Automated
McIntosh-Based Classification of Sunspot Groups Using MDI Images," Solar Physics, vol. 248, pp. 277-296, 2008.
[28] R. C. Gonzalez and R. E. Woods, Gigital Image

![[DOC] Formation complet pour débuter et avancer avec le logiciel Audacity | Cours informatique](data:image/gif;base64,R0lGODlhAQABAIAAAP///wAAACH5BAEAAAAALAAAAAABAAEAAAICRAEAOw==)