HAL Id: hal-00296978
https://hal.archives-ouvertes.fr/hal-00296978
Submitted on 26 Apr 2007
HAL is a multi-disciplinary open access
archive for the deposit and dissemination of
sci-entific research documents, whether they are
pub-lished or not. The documents may come from
teaching and research institutions in France or
abroad, or from public or private research centers.
L’archive ouverte pluridisciplinaire HAL, est
destinée au dépôt et à la diffusion de documents
scientifiques de niveau recherche, publiés ou non,
émanant des établissements d’enseignement et de
recherche français ou étrangers, des laboratoires
publics ou privés.
Instability and its relation to precipitation over the
Eastern Iberian Peninsula
I. Iturrioz, E. Hernández, P. Ribera, S. Queralt
To cite this version:
I. Iturrioz, E. Hernández, P. Ribera, S. Queralt. Instability and its relation to precipitation over the
Eastern Iberian Peninsula. Advances in Geosciences, European Geosciences Union, 2007, 10, pp.45-50.
�hal-00296978�
www.adv-geosci.net/10/45/2007/ © Author(s) 2007. This work is licensed under a Creative Commons License.
Geosciences
Instability and its relation to precipitation over the Eastern Iberian
Peninsula
I. Iturrioz1, E. Hern´andez1, P. Ribera2, and S. Queralt1
1Departamento de F´ısica de la Tierra II, Fac. C.C. F´ısicas, Universidad Complutense de Madrid, 28040, Ciudad Universitaria,
Madrid, Spain
2Universidad Pablo de Olavide, Sevilla, Spain
Received: 12 July 2006 – Revised: 18 January 2007 – Accepted: 31 January 2007 – Published: 26 April 2007
Abstract. Synoptic situations producing rainfall at four rawinsonde observatories at eastern Spain are classified as stratiform or convective depending on dynamic and ther-modynamic instability indices. Two daily radiosonde and daily-accumulated precipitation data from four observato-ries in Eastern Spain are used: Madrid-Barajas (MB), Mur-cia (MU), Palma de Mallorca (PA) and Zaragoza (ZA). We calculated two thermodynamic instability indices from ra-diosonde data: CAPE and LI. Likewise, from ERA40 reanal-ysis data we have calculated the Q vector divergence over the Iberian Peninsula and Balearic Islands, as a parameter de-scribing dynamical instability. Synoptic situations producing rainfall were classified as convective or stratiform, satisfying a criterion based on the values of dynamic and thermody-namic indices at each observatory. It is observed that the number of days with stratiform precipitation related to the total number of precipitation days follows a consistent an-nual pattern.
1 Introduction
Clouds are formed as air parcels are forced to rise, cool and condense. This forcing can be accomplished in several ways including surface heating, frontal lifting, or mixing of the air. In warm clouds, droplets can grow by condensation in a supersaturated environment and by colliding and coalescing with other cloud droplets. Cloud droplets can also form with the aid of cloud condensation nuclei in an unsaturated envi-ronment. Warm cloud (T >0◦C) droplets grow and form pre-cipitation also by the collision-coalescence process. In cold clouds (T <0◦C), precipitation forms by deposition, riming, and aggregation. The growth of ice crystals, first by deposi-tion from the vapour phase in mixed clouds, and then by rim-Correspondence to: I. Iturrioz
ing and/or aggregation can produce precipitation-sized cles in reasonable periods of time. Precipitation sized parti-cles actually start falling once gravity overcomes the upward vertical movements of the drops in the cloud sustaining them. These upward vertical movements are critical to form precip-itation. The ability that the atmosphere has to generate these vertical motions is called atmospheric instability.
Over the Iberian Peninsula very notable differences in the behaviour of precipitation patterns exist. The western and eastern zones are characterized by different precipitation pat-terns (Brooks et al., 2003). Besides, among the observatories considered in this work, there are differences regarding their precipitation pattern. A separation between the observatories of Madrid and Zaragoza, on one hand, and those of Palma de Mallorca and Murcia, on the other, can be made. Madrid and Zaragoza are characterized fundamentally by notable strati-form precipitation type predominance. Its origin is located mainly in Atlantic depressions with associated frontal sys-tems sweeping the peninsular territory, producing continu-ous precipitation of stratiform type. This situation is typi-cal during winter months. Precipitation over Eastern Spain observatories (Palma de Mallorca and Murcia) is mostly ac-cumulated on a single season (autumn), when the sea has reached high temperature due to summer warming. Intense showers of convective type dominate, originated by the en-trance of hot and humid air into the Iberian Peninsula and by a presence of cold air at higher levels (Dai, 1999; Eshel et al., 2001; Correoso et al., 2005). Hot and humid air at low levels, when entering the Iberian Peninsula is forced to rise to higher levels forced by the orography and afterwards, fur-ther uplift is enhanced by the presence of cold air at those high levels. This mechanism is responsible for the formation of thick cumulonimbus, which trigger violent precipitation events. There are notable differences among precipitation types in the different areas of the region studied, represented by the four selected observatories.
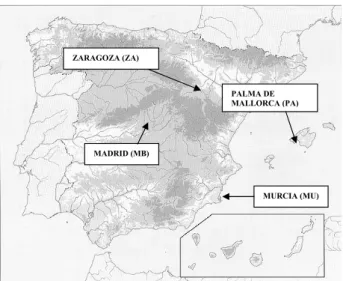
46 I. Iturrioz et al.: Precipitation over the Eastern Iberian Peninsula MADRID (MB) ZARAGOZA (ZA) PALMA DE MALLORCA (PA) MURCIA (MU)
Fig. 1. Orography and the location of the four observatories: Madrid-Barajas (MB), Murcia (MU), Palma de Mallorca (PA) and Zaragoza (ZA).
Rainfall is classified generally in two types, stratiform and convective. This classification is useful, though the distinc-tion between one type and the other is not always as clear and evident as we would like. This is the reason why a great diversity of criteria exists. For example, Houze (1993) con-siders that stratiform rainfall is accumulated when air verti-cal motions are small compared with the downward speed of crystal ice and snow (particles of ice in high levels of the cloud play an important role in the process of generation of rainfall). For the case of the convective rainfall, air verti-cal movements are faster or equal to those of the crystals. The available time observed for the growth of the particles of rainfall is limited, in this case; greatly shorter for the case of the stratified rain. The only fast enough microphysical mech-anism of growth that allows the particles to develop rapidly is the liquid water accretion. Nevertheless, the accretion of liquid water plays a role of minor importance in the strati-form precipitation, where the dominant microphysical mech-anisms are the deposition of water vapour and the aggrega-tion of ice particles.
On the other hand, Rogers (1989) establishes the classi-fication of rainfall depending on the dominant mechanism responsible for the vertical movements:
– Stratiform precipitation (usually produced by
nimbo-stratus), continuous and with a great extension, is as-sociated with large scale upward motion, produced by frontal or topographic elevation, or determined by a great scale horizontal convergence.
– Convective rainfall (usually produced by
cumulonim-bos), intense and localised, is associated with local cu-mulus convection in unstable air.
The aim of this paper is to classify stratiform and convec-tive precipitation events at the selected observatories in the Eastern Iberian Peninsula and Balearic Islands. In order to do this, we have rawinsonde data and rainfall at four obser-vatories from the east of the Iberian Peninsula. Additionally, reanalysis data from ERA 40 allow us to separate the days that are thermodynamically unstable from the those dynam-ically unstable and to classify the rainfall registered at every observatory. Section 2 describes in detail the data used. The methodology is explained in Sect. 3. Section 4 presents our results and a short discussion. Finally, conclusions are pre-sented in Sect. 5.
2 Data
Data consist in two daily (00:00 and 12:00 UTC) observa-tions from four rawinsonde observatories over the Eastern Spain. Data have been obtained from the Integrated Global Rawinsonde Archive (IGRA). Additionally, precipitation data for the same observatories: Madrid-Barajas (40.47◦N, 3.58◦W. Period: 1963 to 2003), Murcia (38.00◦N, 1.17◦W. Period: 1984 to 2003), Palma de Mallorca (39.55◦N, 2.62◦E. Period: 1963 to 2002) and Zaragoza Airport (41.67◦N, 1.02◦W. Period: 1958 to 2003) have been used. The location of the observatories is presented in Fig. 1.
We have calculated several indices of thermodynamic stability, like CAPE and LI. In order to obtain dynamic in-dices, ERA40 reanalysis data have been used. The selected fields are geopotential height and temperature at 500 hPa and 850 hPa. From these parameters we have calculated the di-vergence of Q vector on a grid comprised between 20◦N to 70◦N and 25◦W to 25◦E, with a grid resolution of 0.5◦.
3 Methodology
In order to characterize the dynamic instability, the diver-gence of Q vector at 500 and 850 hPa at each observatory has been calculated (Jusem and Atlas, 1997). Dynamic insta-bility is characterized by negative values of the divergence, while stability is characterized by positive values. The math-ematical expression of Q vector is:
Qx= − R p ∂vg ∂x · ∇T (1) Qy= − R p ∂vg ∂y · ∇T (2)
where R is the Ideal Gas Constant for dry air, p the cor-responding pressure level, vgis the geostrophic wind speed vector and T the temperature at that level. The finite differ-ence method has been used to compute the partial differen-tials. Using this method, we obtain Q divergence.
Omega equation of the vertical motion can be reduced to an expression that provides us with privileged information. We can compute where vertical motion can develop.
∇2+f 2 σ ∂2 ∂p2 ! ω =−2 σ ∇ ·Q (3)
ω is the isobaric vertical speed, ω=dpdt
σ is the stability parameter, that is defined as follows: σ =−αθ∂θ∂p, where α is the specific volume and θ the potential temperature.
The first term of (3) is proportional to −rω. In such a way, if there is convergence in a level, ω has to be smaller than zero; that is, the air is moving upwards (instability). On the contrary, if divergence is present, the air has to move down-wards because ω is greater than zero.
Calculating the divergence of Q in the levels of 500 and 850 for each station, we directly characterize the dynamic instability. For negative divergence there is instability and for positive divergence there is stability.
As we said, in order to characterize thermodynamic sta-bility, several indices have been calculated: CAPE (Convec-tive Available Potential Energy), LI (Lifted Index), TT (Total Totals Index), KI (K Index), SI (Showalter Index) and CIN (Convective INhibition) (De Rubertis, 2005). They provided some redundant information and finally only two of these indices, the ones providing best information, have been in-cluded in this paper. CAPE is the abbreviation for Convective Available Potential Energy. CAPE represents the amount of buoyant energy available to accelerate a parcel vertically, or the amount of work a parcel does on the environment. CAPE is defined as: CAPE=g EL Z LFC Tv(z) −Tv(z) Tv(z) (4)
where Tvis the wet adiabatic virtual temperature profile of the parcel and Tv is the virtual temperature profile of the environment. EL is the Equilibrium Level and LFC is the Level of Free Convection.
LI (Lifted Index) can be estimated using a Skew-T thermo-dynamic diagram. The Lifted Index accounts for low level moisture. A negative lifted index indicates the possibility of convection. To compute LI the temperature of the parcel at 500 hPa is subtracted from the environmental temperature at 500 hPa.
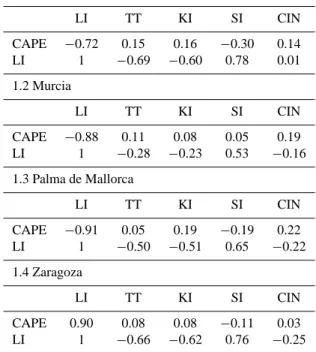
We note that CAPE is an index that describes the insta-bility in the troposphere and LI only is defined for the level of 500 mb. Nevertheless, they have a very high correlation between them. In Table 1 we can see correlation values be-tween the indices we used on the selected observatories (Ta-ble 1.1: Madrid-Barajas, Ta(Ta-ble 1.2: Murcia, Ta(Ta-ble 1.3: Palma de Mallorca, Table 1.4: Zaragoza). Correlation values are much lower when the other indices are considered.
Table 1. Correlation values between the indices that were tested: :
CAPE (Convective Available Potential Energy), LI (Lifted Index), TT (Total Totals Index), KI (K Index), SI (Showalter Index) and CIN (Convective INhibition).
1.1 Madrid-Barajas LI TT KI SI CIN CAPE −0.72 0.15 0.16 −0.30 0.14 LI 1 −0.69 −0.60 0.78 0.01 1.2 Murcia LI TT KI SI CIN CAPE −0.88 0.11 0.08 0.05 0.19 LI 1 −0.28 −0.23 0.53 −0.16 1.3 Palma de Mallorca LI TT KI SI CIN CAPE −0.91 0.05 0.19 −0.19 0.22 LI 1 −0.50 −0.51 0.65 −0.22 1.4 Zaragoza LI TT KI SI CIN CAPE 0.90 0.08 0.08 −0.11 0.03 LI 1 −0.66 −0.62 0.76 −0.25
Adding up, we have an assembly of stations in the Iberian Peninsula and Balearic Islands, each of them being charac-terized by several dynamic and thermodynamic indices every day and during several years. Within each day, we have raw-insonde data at different hours, so we selected the data of the reanalysis attending to the corresponding sounding. Also we have daily accumulated precipitation data. Our aim is to separate between stratiform and convective precipitation af-ter instability is computed.
To classify the daily type of instability we have considered several criteria (see Appendix for further details). Finally, criterion 1A (see Table 2) was selected because considering the results obtained from the different proposed criteria, it exhibited the most realistic results. In order to compare be-tween results obtained on the four observatories, a method based on percentile analysis was used.
3.1 Separation between stratiform and convective precipi-tation
Convective and stratiform precipitation has been classified according to thermodynamic and dynamic indices. The three criteria used to produce this classification are:
First, those days characterized by dynamic instability are selected without considering thermodynamic indices. Pre-cipitation for these days when the value of the dynamic in-stability index exceeds the percentile 95 (among all the days
48 I. Iturrioz et al.: Precipitation over the Eastern Iberian Peninsula
Table 2. Instability criterion. Dynamic instability is based on 95 percentile Q vector divergence at two levels (850 and 500 mb). When Div Q
is over 95 percentile at both levels, we consider dynamic instability. TI is the thermodynamic instability index in use. It can be LI or CAPE. We consider the situation is thermodynamically unstable when Q vector divergence is below 95 percentile at least in one of the pressure levels and CAPE or LI (it depends on the criterion used) is over 90 percentile.
INSTABILITY CRITERION 1A
DYNAMIC INSTABILITY DivQ en 500 hPa. and DivQ en 850 hPa. are both over 95%
THERMODYNAMIC IN-STABILITY
DivQ en 500 hPa. and/or DivQ en
850 hPa. are/is below 95% and TI is over 90% Stratiform precipitation 0,30 0,40 0,50 0,60 0,70 0,80 0,90 1,00
Jan Feb Mar Apr May Jun Jul Aug Sep Oct Nov Dec
Month G C A P E Madrid Murcia Palma Zaragoza
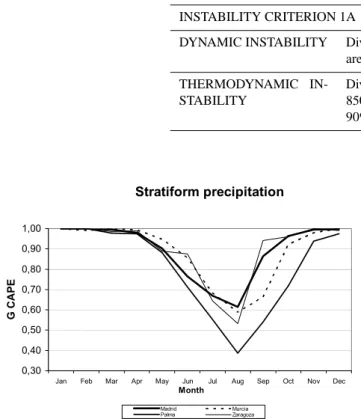
Fig. 2. Number of days with stratiform precipitation over the total
number of precipitating days (G) for the whole year in all the obser-vatories, using CAPE as thermodynamic instability index. For the separation between dynamic and thermodynamic instability days, the criteria of Table 2 have been used.
with precipitation at the selected observatory) is classified as stratiform.
Second, when no dynamic instability is present, precip-itation will be classified as convective only if the selected thermodynamic index is high enough (higher than 90% of all the days with precipitation at the selected observatory not previously classified as stratiform).
Third, all the remaining precipitation days, not included in any of the previous classifications, will be considered as stratiform, as the values of the thermodynamic instability in-dex do not exceed the present threshold in order to be classi-fied as convective precipitation.
These criteria are summarized and presented in Table 2. Applying these criteria we can compute the number of days with stratiform precipitation over the total number of pre-cipitating days (G) using instability indices. Thus, G could be considered as the sum of the number of the dynamically unstable days and the number of days that could not be clas-sified in the convective category, based on the preset index
Stratiform precipitation 0,00 0,10 0,20 0,30 0,40 0,50 0,60 0,70 0,80 0,90 1,00
Jan Feb Mar Apr May Jun Jul Aug Sep Oct Nov Dec
Month G L I Madrid Murcia Palma Zaragoza
Fig. 3. Number of days with stratiform precipitation over the total
number of precipitating days (G) for the whole year at all the ob-servatories, using LI as thermodynamic instability index. For the separation between dynamic and thermodynamic instability days, the criteria of Table 2 have been used.
thresholds. If we define r, as the percentage of thermody-namically unstable days that are not dythermody-namically unstable we can calculate G as follows:
G = s + (1 − r)(1 − s) (5)
G = number of days with stratiform precipitation over the
total number of precipitating days.
s = Number of dynamically unstable days (ID) over the total number of days with precipitation (N ).
s =ID
N (6)
r = Percentage of thermodynamically unstable days using the
corresponding thermodynamic index (hereafter, I T ) from the (N –ID) that are not dynamically unstable.
r = IT
N − ID
(7)
Table 3. Number of days with stratiform precipitation over the total number of precipitating days (G) for the whole year in the observatories
of Madrid-Barajas (MB), Murcia (MU), Palma de Mallorca (PA) and Zaragoza (ZA). Using CAPE and LI as thermodynamic instability indices, two different results for G were obtained. For the separation between dynamic and thermodynamic instability days, the criteria in Table 1 have been used.
MB MU PA ZA
G CAPE G LI G CAPE G LI G CAPE G LI G CAPE G LI
Jan 1.00 0.96 1.00 0.92 1.00 0.82 1.00 0.99 Feb 1.00 0.95 0.99 0.87 1.00 0.81 1.00 0.96 March 1.00 0.80 1.00 0.86 0.98 0.70 0.99 0.81 April 0.98 0.66 0.99 0.68 0.97 0.64 0.99 0.70 May 0.90 0.47 0.95 0.44 0.88 0.43 0.89 0.41 June 0.77 0.27 0.85 0.37 0.71 0.31 0.88 0.47 July 0.67 0.17 0.68 0.30 0.55 0.20 0.64 0.20 Aug 0.61 0.24 0.59 0.16 0.39 0.11 0.53 0.26 Sep 0.86 0.44 0.66 0.27 0.54 0.25 0.94 0.53 Oct 0.96 0.67 0.92 0.55 0.72 0.33 0.96 0.72 Nov 1.00 0.88 0.98 0.87 0.94 0.63 1.00 0.95 Dec 1.00 0.91 1.00 0.96 0.97 0.74 0.99 0.93
4 Results and discussion
Figures 2 and 3 and Table 3 describe the evolution of mean monthly values for G (see Eq. 5) based on the two thermody-namic indices (CAPE and LI). G values have been calculated once per day, at 12:00 UTC and averaged for each month. The evolution of G values was computed for each observa-tory. An instability criterion (Table 2) has been applied and by using the two indices, CAPE and LI, two different results are presented: “G CAPE” (Fig. 2) and “G LI” (Fig. 3).
The instability criterion showed that most winter precip-itation events can be classified as stratiform for all the ob-servatories as, in some way, was expected. Nevertheless, the greatest discrepancy is observed when we focus our atten-tion on summer precipitaatten-tion. For this season, G CAPE de-creases significantly at all observatories (Fig. 2). Figure 3 and Table 3 show that G LI decreases below 20% during summer months. This annual distribution of precipitation pattern using LI index in the instability criterion is in agree-ment with the results of previous studies (Tremblay, 2005), i.e., the amount of stratiform precipitation is greater in winter than in summer. Also, convective events are more likely in August, September and October (Correoso et al., 2005). Our results show that CAPE overestimates the amount of precip-itation collected in summer (see for example the values in Table 3 for Palma de Mallorca observatory in June). A value of 71% for the stratiform precipitation amount is considered too high. Much more realistic results were obtained from LI, with a value of 31%.
It is worth pointing out that the proposed method classifies precipitation types in a realistic way in the different observa-tories throughout the year. Results show an increase in the percentage of stratiform precipitation during winter months
and a decrease in summer. Also, it was found that convective events are more probable to occur at seaside observatories than at inland observatories in Madrid and Zaragoza (Fig. 3).
5 Conclusions
Precipitation at four meteorological observatories in Spain has been classified as stratiform or convective following an easily implemented methodology based on the use of stabil-ity indices. This method allows the generation of an annual pattern for precipitation. When the patterns obtained were analyzed, results were in very good agreement with previ-ous publications and common experience, both regarding the type and frequency of different precipitation events. Summer rainfall is predominantly convective, while winter precipita-tion is mostly stratiform.
The comparison between results obtained using CAPE or LI indices shows a better performance when using LI, which reproduces better the quantity of convective rainfall impounded during September and October. Murcia and Palma (seaside observatories) have a more intense convective behaviour than Madrid and Zaragoza (inland observatories), especially during August, September and October.
Appendix A Instability criteria
All instability criteria are based on the fact that the dynamic instability dominates over the thermodynamic one. So, first of all, we compute dynamic instability at two levels of 500 and 850 hPa. The criteria are the following:
50 I. Iturrioz et al.: Precipitation over the Eastern Iberian Peninsula
INSTABILITY CRITERION 1
CRITERION 1A CRITERION 1B DYNAMIC DivQ en 500 hPa. and DivQ en 850 hPa. INSTABILITY are both over 95%
THERMO-DYNAMIC INSTABILITY DivQ en 500 hPa. and/or DivQ en 850 hPa. are/is below 95% and TI is over 90% DivQ en 500 hPa. and/or DivQ en 850 hPa. are/is below 95% and TI is over 95% INSTABILITY CRITERION 2 CRITERION 2A CRITERION 2B DYNAMIC DivQ en 500 hPa. and DivQ en 850 hPa. INSTABILITY are both over 90%
THERMO-DYNAMIC INSTABILITY DivQ en 500 hPa. and/or DivQ en 850 hPa. are/is below 90% and TI is over 90% DivQ en 500 hPa. and/or DivQ en 850 hPa. are/is below 90% and TI is over 95% INSTABILITY CRITERION 3 CRITERION 3A CRITERION 3B DYNAMIC DivQ en 500 hPa. or DivQ en 850 hPa. INSTABILITY is over 95% THERMO-DYNAMIC INSTABILITY DivQ en 500 hPa. and DivQ en
850 hPa. are both
below 95% and TI
is over 90%
DivQ en 500 hPa.
and DivQ en
850 hPa. are both
below 95% and TI
is over 95%
Acknowledgements. The author wishes to thank the Instituto
Nacional de Meteorologia for providing the precipitation data and ECMWF for the reanalysis data. The Ministerio de Educaci´on y Ciencia supported this study through the DINPRE (DIN´amica de la PREcipitaci´on) project (CGL2004-05187-C03-01/CLI). Comments and suggestions provided by two anonymous reviewers helped to improve the final version of this paper.
Edited by: S. C. Michaelides and E. Amitai Reviewed by: anonymous referees
References
Brooks, H., Lee, J., and Craven, J. P.: The Spatial distribution of severe thunderstorm and tornado environments from global re-analysis data, Atmos. Res., 67–68, 73–94, 2003.
Correoso, J. F., Hern´andez, E., and Garc´ıa Herrera, R.: A 3-year study of cloud-toground lightning flash characteristics of Mesoscale convective systems over the Western Mediterranean Sea, Atmos. Res., 79, 89–107, 2005.
Dai, A. G.: Recent changes in the diurnal cycle of precipitation over the United States, Geophys. Res. Lett., 26, 341–344, 1999. De Rubertis, D.: Recent Trends in four common stability Indices
derived from U.S. Radiosonde Observations, J. Climate, 19, 309–323, 2005.
Eshel, G. and Farrel, B.: Thermodynamics of Eastern Mediter-ranean Rainfall Variability, J. Atmos. Sci., 58(1), 87–92, 2001. Houze, R. A.: Cloud Dynamics, Academic Press, pp. 197–200,
1993.
Jusem, J. C. and Atlas, R.: Diagnostic evaluation of vertical motion forcing mechanisms by using Q-vector partitioning, Mon. Wea. Rev., 126, 2166–2184, 1997.
Rogers, R. R. and Yau, M. K.: A Short Course in Cloud Physics, Pergamon Press, pp. 196–205, 1989.
Tremblay, A.: The Stratiform and Convective Components of Sur-face Precipitation, J. Atmos. Sci., 62(5), 1513–1528, 2005.