DEVELOPMENT RANGES FOR THE INTERSTATE ROUTE 495 AREA AND IMPLICATIONS
TO GENERAL PHYSICAL PLANNING
by
William Chester Melia B.S., Boston College
(1960)
Submitted In Partial Fulfillment
Of The Requirements For The
Degree of Master in City Planning
at the
Massachusetts Institute of Technology June, 1962
Signature of Author
Certified By
Depart nt of Cit"W and
Nfegional
Planning/1
Thesis Supervisor Chaiian, Depaetmental Committe6 ofGraduate Studies Accepted By
38
Acknowledgements are never very adequate. They are only partially sufficient. Often-times prosy. Nevertheless.
To my Parents, to Nancy for general but very special support. To Professor
Howard for his valuable help and criticisms. To Professor Fleislber for his ideas, his long-hours, his long-suffering.
Highway impact studies continue to multiply. It has been observed that the wide variations in purpose, scope, and method have made difficult any generalizations from conclusions of
specific studies. This thesis is an attempt to identify the physical planner as a prospective user of a particular highway impact study. Specifically, the thesis asks the questions what possible impacts may occur for the Area near Route 495, anP Outer Circumferential in the Boston Region: these based upon
observa-tions of development around Route 128, and older Inner circum-ferential in the same Region. Then, the possible implications of
the impact ranges are considered relative, on a gross level, to community physical planning.
Findings:
(1) A remotely plausible limit of 630,000 persons and
80,000 manufacturing jobs added ban be reasoned from
the Route 128 experience to the Outer, Route 495, area; a more reasonable upper limit may be more nearly half of this.
(2) Based on case,, studies of eight "growth" communities in the Greater Boston Area the Outer Band towns were
arranged in three categories. All towns in all three categories at the limit of 630,000 added population would experience particular physical planning diffi-culties from this impact level. The smaller towns may be particularly troubled but this would depend upon the real distribution of population. On an average
increase of 8600 persons per town, however, all the small towns (below 10,000 population) and about half of the medium size ones would be experiencing growth additions that may be considered more than moderate. (3) At half of the remote "upper limit" (an addition of
315,000 persons),
nlanning
problems would be generally experienced only by the smaller communities but there would be sufficient flexibility for additions (andgood reason to believe this would happen) to larger communities,(at little or no particular difficulty to them) that growth could be accommodated by all communities.
PAGE PART I THE POSSIBLE RANGES OF DEVELOPMENT FOR THE ROUTE
495 AREA
Introduction... 1
Chapter I: An analysis of population and industrial 13 distribution in a Route 128 Band of
Communities.
A. Scope of the Analysis 13
B. Population Distributiom 16
C. Industrial Distribution ,18
D. Summary 24
E. The Greater Boston Growth "Norm" 25
Chapter II:- The Outer Band Range of Development 30 A. The most remotely plausible upper 30
limit
B. A more likely upper industrial limit 32
C. A more likely upper population limit 36
D. Density Comparisons 40
PART II GROWTH PROSPECTS AND PLANNING 44
Chapter III: Case Studies of Eight Greater Boston 44 "Growth" Towns
A. Foreword 44
B. The Small Towns 48
C. "Medium" Towns 56
D. The Larger Town 65
E. Observations 70
Chapter IV: Summary and Conclusions: Growth Levels 74 and Physical Planning
A. Generalizations from the Case Studies 74 B. The Industrial Range and Physical
Planning Problems
C. The Population Range and Physical 79 Planning Problems and Implications
D. General Summary of the Development 84 Ranges and Planning
LIST OF TABLES
Table Page
I Population in Massadhusetts and Sub Areas 16 1950-1960
II Population Distribution in Massachusetts 17 III The Distribution of Population IncreasesPer 17
Square Mile in Massachusetts
IV Manufacturing Employment in Massachusetts and 21 Sub Areas 1950-1960.
V The Distribution of Manufacturing Employment
in Massachusetts 1950-1960 21-22
VI Large Manufacturing Metropolitan Areas With 27 Employment Gains in 1947, 1954 and 1950
VII The Distribution of Manufacturing Employment 36 in Greater Boston 1950 and 1960
VIII .Relative Distribution of Population in Greater
Boston 39
IX Density Comparison: Route 128 Band and Outer 40 Band
X Basic Data for the Eight "Growth" Towns 48 XI Outer Band Town Size Classifications 77
XII Population and Land Available for Develop- 81
ment In the Larger Outer Band Cities and Towns
XIII Condition of Dwelling Units in the Larger Outer
Band Cities and Towns 81-82
ILLUSTRATIONS
Figure I Routes 128 and 495 in their Regional 3 Setting
Figure II The Core, Route 128 Band Outer Band 15 And the Rest of Massachusetts
1. Introduction Foreword
The many facets of highway impact have been a popu-lar subject for much research and study in recent years. We are told that the wide variations in purpose, scope and method have made it very difficult to generalize from conclusions drawn from specific studies.1 Much effort may be saved and confusion averted if we knew better who it is that uses the results of a highway impact study and what particular things investigated canbest serve that user. If we know the user
of these studies ahd the
euestions
that would particularly require resolution for that user, then perhaps we can fix upon methods and fasten upon the more important problems that need be giVen close attention. to better advance,thus, the general fund of knowledge from each specific study. The thesis attempts to assess the possible concern to physical planning at each level of a range of highway
projects. The possible physical planning problems and the communities concerned at each level of impact are considered for a second proposed limited-access circumferential highway in the same metropolitan area as another for which a highway impact study is available. The thesis looks upon the highway as producing planning problems of general concern or not of general concern, to all communities, or to class of communities, in the Outer Band, at various assumptions of growth levels.
1. Commonwealth of Massachusetts, Department of Public Works, Social and Economic Impact of Highways, Review of Important Studies and Selected Bibliography (April, 1961), p.1
AMES9UAy
FIGURE I MERRMAC
ROUTES 128 AND 4951N .
THEIR REGIONAL SETTING :9
GREATER BOSTON METHUEN -- . GEORG WN _ LAWRENC[-DUNSTABLE YNGSBOROUGH -S \00 NORTH ANDOVER \ - IANDOVER LOWELL ADVRTOPSftEL \. HAILTO)N ESSEX
GROTON TEWKSBURY DDLETO GLOUCESTE
CHELMS WElHA.M
WESTFORD NORTH READING \ --- E
A DANVERS V
AYER- BLLEfCAWALMINGTON
EAD I L \
U ETON CARLISLE BAIG
HARVARD SAEM
HARVARE IELD MAR HEAD
BIEDFORD BURUNHGTO'N \AIFED
.Z 2~., ~ O USTO / *\ ' STO SftE'AC
X RUH ACTON WOBURN ST
SAUG US LYN SWAMPSCCT *Alnr (kra
-- CONCORD - \
\ N 4 1MLROSE\*
"K LEINTO %- WINC HESTER\
BOLTON STOu
MALDEN
BERUIN HUDSON
WALTHAM 4.
5 ER LE ELSE - THROP
ARLBOROUGH WAYLD WESTON ow
NORTHOROUGH FRAMINGHAM *BROOKUINE J ON - - -SOUTHBOROUGH WELLESLEY// I NATICK NEEDHAM HL WESTBOROUGH f ASHLAND HMMLO
SHERBORN DOVER COHASSE
H)VNTON NHINGHAM \ OASE
WESTWOOD\
/---N BAINTREE SCITUATE
HOtusTON " T WE Tm
UPTON MEDFIELD NORWOOD
Po---uNOcWELL
MLFORD MEDWAY \NOWL
\ - -J WALPOLE HOLBROOK Ii
1e-$HAND SOCULANO
0~~~ NORAOOK ONOUABTOGTON OIAD \ 14N VCR
MAI LD
BELLINGHAM
rRAVKN BROCKTON
MRX
4 5
LA NVILLE MANSFIELD W T BRIDGEWATE
Rhde hlad \_-'-. AIA
NORTH ATTLEBOROUGH NOT rKDGEWATER
LEBONROUGHEATE
LESOROU\ RAY AM
HIGHW YS TUNT \ MIDDLEBOROUGM
--Existing limited ccess
help clear, however slightly and incidentally, the possible
confusion that might have arisen in the diversity of purposes, methods and scopes of highway impact studies. The investiga-tion proceeds in a concrete case but in a f6irly hypothetical and general way and proceeds, also, as only a very minor step in a succession of hopefully many.
Notes for Figure I
The red borderlines indicate:
1. the inner red line:; the western border of the twelve city and town core.
cf
p15'2. The next, outer, red line indicates the
western boarder of the Standard Metropolitan Statistical Area. of. PIS'
3. The whole area includes the 153 city and town are known as Greater Boston (includes the
new additions of Amesbury, Merrimac, Newbury-port and Salisbury). cf. p/5
4. In 1951 Boston's Metropolitan highway network was be-ginning to take form. A 22.5 mile segment of circumf erential
highway, Route 128, was opened to traffic. From Wakefield, a town rough]:y twelve miles northwest of Bostonto Wellesley, roughly twelve miles west, the new section of.highway brought about forty miles of sixty-seven total miles of the planned circumferential into service.2 The southern portion was com-pleted in stages from Wellesl.ey to Braintree in 1956and 1960.
When the central 22.5 mile section was dedicated, it was generally felt that the limited access feature would discourage commercial or industrial development along its path. 3 Some people, when the central s ection opened could only comment:
"But it doesn't go anywhere." Notwithstanding, the highway soon became more than merely "Route 128". It was now the "Golden Ring"n5 "The Golden Industrial Semicircle", "Miracle Highway", The Nation's dolden Industrial Incubator.6 Such
epithets may be slightly puffy but the fact of the new high-way's capacity to attract new industrial locations is readily apparent.
2. Northern sections were completed at interva3s between 1936
and 1941 and, following the War, reconstruction here was begun. 3. A.J. Bone and Martin Wohl: Route 128 Study, Transportation
Engineering Division, Department of
givil
and Sanitary Engineering, Massachusetts Institute of Technology(Cambridge, Mass.:. December, 1958), p7.
4. "Bostonts G-olden Indusgrial Semicircle", Greater Boston
Business, Special Supplement of 1959 (Boston: Greater Boston Chamber of -Commerce), p.6
5. Commonwealthof Massachusetts, Department of Public Works, The Massachusettv. Highway Story 1949-1956. p.4
6. "Boston's Golden Industrial Semicircle", p.1 and inside back cover,
By the end of 1960, 169 establishments (manufacturing, research and development, distribution, and service) employing
some 24,000 persons and representing about 110,000,000 were counted as visible from the highway. 7
The highway also has been observed as accelerating a -process of "filling-in between-the-radials": as a powerful
force in influencing population distribution in the Metropolitan area. Before the highway was built population increases were greater in towns along high traffic radials; after the opening of Route 128, however, populations increases of substantial
sizes were observed, also, in towns in-between the high traffic radials*8
The "filling-in" process is expected to continue and actually acc&erate, further, to a distance of fifteen miles from downtown Boston, at least to 1970, in a path thus
with the circumferential Route 128.9
While the new highway is observed as a strong factor in the location of population and industry in the Boston metro-politan suburbs, the prime function of the highway had been
7. Roger Johnson, "Route 128 Study Assesses Social and Economic Impact", Industry (Boston: Associated Industries of
Massachu-setts, December, 1960), p.11
8. Bone and Wohl, ppl8l-185.
9. The Route is located about 10 miles from the downtown. The observation of Route 128's continued influence upon circum-ferential population distribution is noted in: Greater Boston Economic St idy Committee, Economic Base Report No.4, The Population of the Cities and Towns of Greater Boston Projected to 1970 (Boston, December, 1959), p.4
6.
anticipated as its serving as a by-pass for north-south through traffic around the congested core areas. This new circumferen-tial was to remove the through route from conflict with local traffic - the situation which had made the old Route 128, passing through the center's core communities, intolerably congested.lo
For the new Route 128, however, little evidence, in 1957, was found that the highway had been much used as a complete by-pass for the intovn areas. 1 1 The evidence did indicate that as its older predecessor the Route was being largely used by persons living, working, or shopping in the nearby towns. 1 2
The character 6f the Route traffic-wise appears to be no different from the old one. Route 128 remains a local suburban traffic
circulator.-The special significance of this highway, that which really characterizes it, was and is its ability to influence the dis-tribution of industry and population along ibe route. Route 128 is a metropolitan physical phenomenon(but, with, apparently, its area of influence somewhatsmaller than the total metropolis)
- for we observe industry located along its edges; population "filling-in" to 1970 from the edge of the built up area to
10. Bone and Wohl, p.1 11. ibid; p. 78
12. ibid; pp77-78. About 76% of all weekday trips were found to have origins or destinations in the towns lying close to the highway.
fifteen miles from the downtown, belt fashion; andtraffic, also, generated belt-fashion mostly from persons living, working, and shopping in the towns along its path.
A new circumferential highway, Interstate Route 495, in
various stages of design, construction and completion, ten to thirty miles west of Route 128, will run an arc 88 miles from hear the New Hampshire border in the north and Interstate
Route 95 tb within horn-tooting distance of Rhode Island at, again, Route 95, south, in Mansfield, Massachusetts.
Originally, in 1956, a Route 110 expressway was proposed to alleviate severe congestion on an older Route (110) that passed through the central areas of Haverhill, Lawrence, Lowell, the intervening small towns, and into Worcester. Special
emphasis was placed upon the ability ofa new freeway to accommodate economic revival in the distressed textile and leather cities of the Merrimack Valley.13 And the Department
of Public Works, at the time, suggested that the new. partially circumferential highway could mean that'bhe State would then have a 'Golden Ring' - Route 128 - capped by a 'Platinum Band' - New Route 110." 14
In 1956 Congress gave the Go sign to the Federally aided Interstate Highway System.
13. Edwards, Kelcey and Beck, A Master Plan of Highways for the Lowell, LawrEnce and Haverhill Metropolitan Areas, prepared for Massachusetts Depatment of Public Works and the United States Bureau of Public Roads (gay 1956) p.3 14. The Massachusetts Highway Story 1949-1956, p.4
8.
Proposed Route 110 now became proposed Interstate Route 495. Instead of terminating at Worcester, the highway is
scheduled to meet - twelve miles east of that city - with Route 90 (the toll Massachusetts Turnpike) and Interstate 290, the Worcester Expressway, twenty-seven miles, here, west of downtown Boston.
The State Department of Public Works feels that the new highway "holds great promise for the 30 communities which it touches along its path." And:
Because of the need for relieving the heavy intercity traffic which was clogging outmoded Routes 110 and 125 and the desire to alleviate
the chronic economic distress which has plagued the area, it was decided to give priority to work
on the Outer Belt in the Merrimack Valley. 1 5
The experience of Routel28 as attracting substantial in-dustrial development seems to occupy, now, a good portion of peoplets thinking on what might happen at Route 495.16 When Route 128 was being built little thought was given its
in-dustrial development potential, but now, whenwe hear dis-cussion of Route 495, just such development possibility seems uppermost.
15. Commonwealth of Massachusetts, Department of Public Works,
A Report of Progress to Governor John A. Volpe, On the Massachusetts Highway Program (Fall, 1961), pp 26-27.
16. One observer notes that "In the minds of many is the thought that circumferential highway Route 495 will be THE road of the future - perhaps even surpassing Route 128 in its
eventual economic impact." But on the other hand it is observed, also, that, "Some of the industrial developers who played such an important part in the growthof Route 128 have a 'wait and see' attitude toward 495." Dr. J. Laurence Phalan, "Economic: Impact of Highways with Particular Re-ference to Merrimack Valley", Boston University Business-Review (Spring,1961). pp 28-29.
The Route 495 impact, generally, is quite naturally of
interest to many persons: politicians, economists, bankers, real estate brokers, developers, unemployed textile workers.
What about the physical planner? Is he concerned? 17
How much and what spatial industrial and population distribution does it appear that Route 128 might have influenced? Does
this suggest which particular towns, which areas, with physical planning problems, may thus require the professional scrutiny
of the physical planner?
If Royte 495 were to similarly influence population and
industrial distribution what can we say of the towns that might experience physical planning difficulties. First of all: which towns? Secondly: what difficulties? At what levels of population and industrial additions do physical
planning problems becomemore pressing; perhaps more demanding of solution? Is there some upper limit, some level between plausibility and unlikelyhood, that is about the maximum that can be expected as highway impact? If such a limit can be
found perhaps the very most difficult physical planning problems
17. The planner, in general, is apparently felt tobe concerned where it is- suggested that ... "If a sound program of land, .population, and economic planning is to be formulatdd it will be necessary to consider...( Among other things)...
the probable impact on the distribution of populations and economic activity of qll proposed highway facilities with specialattention paid to the impact of the planned cir-cumferehtial Route 495, the proposed southeast and northeast expressways and the extensions of Routes 2 and 3 into
downtown Boston." Economic Base Report No. 4, The Popula-tion of'the Cities and Towns of Greater Boston-Projected to
10.
can be brought to light. Planning problems also can be assessed at various levels within this upper limit and perhaps within the more likely range of population and industrial distribution impacts.
We are looking for an indication of the Towns that might be affected by Route 495 development and the physical problems that could be thereby encountered at various hypothetical levels of impacts. At that levels, if any, do planning problems cease to be of general concern? And what problems usually are of this general concern?
We are concerned with particular problems thd might be encountered, at various levels of growt4 by towns abutting the highway and towns not-abutting. We are seeking, in a general way, the problems that might be encountered by rural Nashoba Valley apple producer towns, by emerging suburban communities, by the older, larger, Merrimack Valley Cities - but not as
individual- towns, perhaps not even as identifiable towns, but
as towns within a class that looks to be generally characteristic. We are looking for typical problems for typical towns, with growth. What, for example, does the particular growth level mean in terms of existing community facilities: will the old
schools, the old streets, the old fire station need replacement, rebuilding, expansion? Will the towncenter become intolerably
congested? Need more parking? What about town chargcter: is the old lost? Will the old land use patterns meshvth the new?
These are questions we would like to answer at least generally in the thesis. We would like to know what may be
the most concern physical planning should give the highway. How important the industrial location impact is to physical planning. How important may be the impact on population
distribution. The area where the planner may be concerned only little, if at all. Where he may possibly become more
con-cerned.
To answer these questions we shall look at the possibilities for the Route 495 area development - from the most unlikely,
but still wildly possible, on down - and attempt, then, to relate planning problems in communities for various growth levels. We consider the most wildly possible not because it is expected but because it may serve as a base for comparison with lesser, more- likely, levels of development and because we feel that it is often well to know especially in planning,
rather exactly what is the most that one m~pt be called upon to deal with in a particular period of time.
In an investigation of this sort it cannot be stated strongly enough that a so called upper limit, or some hypo-thetical growth level within that limit, is anything but a device to consider, rather arbitrarily but analytically, problems that would be associated with growth of certain amounts. It is hoped, therefore, that the various limits analyzed are not taken as predictions or projections, fore-casts, estimates, recommendations of policy. Also, at times, -the analysis requires some attempts at educated- guesswork:
it is important that the guesswork be understood as such. Accordingly, the thesis accepts Route 128 as having strong influence upon population and indutrial locations
12.
in the Boston region. We are looking for an indication of
what that impact might have been. To do this we have divided the Boston Region into a core and two bands. We shall attempt to compare Boston' with other metropolitan areas for Route 128Is possible role in the Boston region's growth.
Then we seek, from our experience with Route 128, an indication of -hat might occur at Route 495 and in the towns possibly concerned - in population and industrial growth.
Finally, the thesis attempts to consider the growth possibilites and their relation, thus, to community physical planning.
The thesis, therefore, is divided into two Parts: the first d evelops the possible range of impacts and the more
probable areas within the range that development may occur; Part II discusses in detail, eight specific cases of
community growth from which generalizations were made to apply to growth levels in the range of Route 495 development possibi-lities.
CHAPTER I An analysis of population and industrial
distribution in a Route 128 Band of communities
A. In the introduction we were careful to ask how much does it appear that Route 128 might have influenced popu-lation and industrial distribution. 1 8
We are reminded that Route 128 was located just outside existing developed areas.19 We also note that the highway was built while strong pressures for postwar suburbanization of population and industry were present and working in
the Boston area.2 0 The highway was immediately in the pgth
of an outward pattern of physical development.21 And
Route 128 was there to satisfy a strong outward movement which would have occurred in Metropolitan Boston even if the new highway had never been built.2 2
A serious analysis of the impact of Route 128 would
require a painstaking detailed separation of metropolitan suburbanization influences, and the effects, then, upon population and industrial distribution, which these would have had notwithstanding Route 128.
18. p 11, supra 19. Bone and Wohl, p3
20. ibid
21. And in this connection we may note that the historical pattern of movement, mostly, ran in a radial fashion west, northwest, and southeast from the central City: Economic Base Report No. 4, The Population of the Cities and Towns of Greer Boston Projected to 1970, p4. cf also Figures I and II in the Report.
14.
Such is not our intent in this section. For our purposes a total impact which includes highway influences and metropolitan growth pressures would be adequate.23 Thus if we can observe certain consequences in the Route 128 Band of communities
-consequences 6f: unmeasured inputs - and if', from our observations, we can rationally define a range of possibilities for the
Route 495 area impact, we may have what we need to consider the highway, then, as presenting planning problems of general or not of general concern.
In a sense, the thesis investigation may be thought of as asking what might be the most development that the Route 495 area might expect; what this may mean to physical planning; and the answers, thus, may give indication of whether it would be worthwhile to attempt a separation of direct influences and metropolitan growth influences.2 4
The analysis in this section, therefore, is more one of
a total impact observable in the Route 128 area: of consequences, a posteriori, without reference, generally, to causes.
The area must be defined along with areas with which it will be compared. Then, in the Route 128 area, 1950-1960, corresponding roughly with the first decade of the highway's life, growth may be assessed with growth in other areas.
23. And perhaps, really, they are inseparable.
24. The indication may become apparent at the conclusion of the investigation but we are not conducting it with this purpose; rather, we are more interes-ted in the Route 495 area's possible problems.
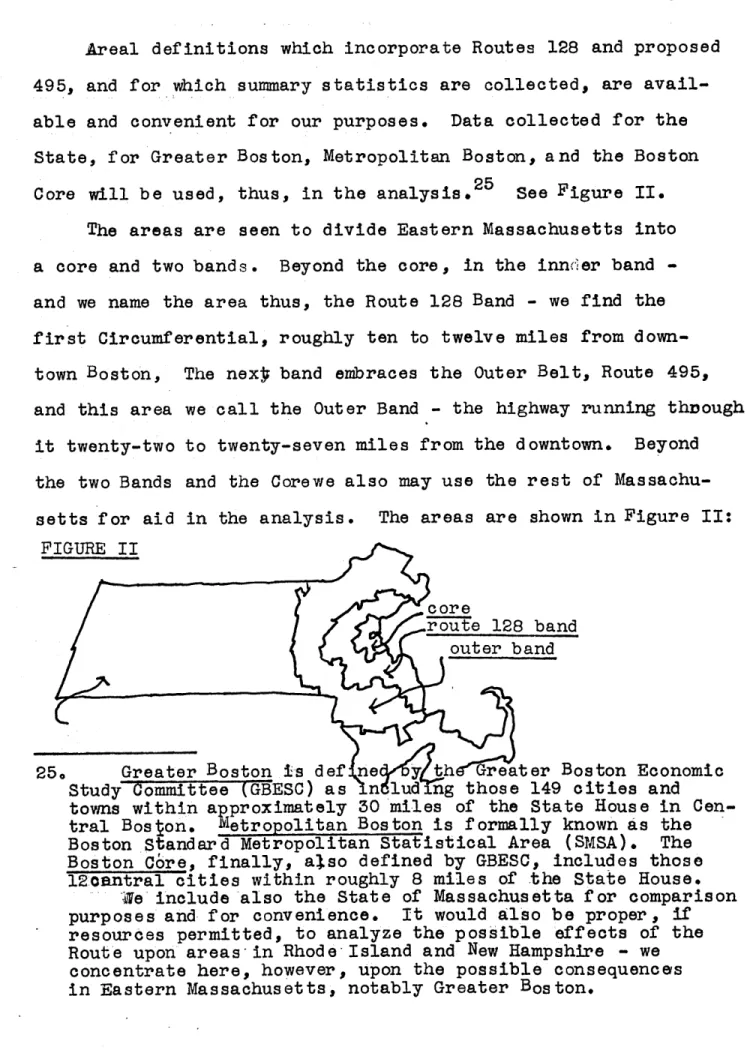
Areal definitions which incorporate Routes 128 and proposed 495, and for which summary statistics are collected, are avail-able and convenient for our purposes. Data collected for the State, for Greater Boston, Metropolitan Boston, and the Boston
25
Core will be used, thus, in the analysis. See Figure II. The areas are seen to divide Eastern Massachusetts into a core and two bands. Beyond the core, in the innder band -and we name the area thus, the Route 128 B-and - we find the first Circumferential, roughly ten to twelve miles from down-town Boston, The nexi band embraces the Outer Belt, Route 495, and this area we call the Outer Band - the highway running through it twenty-two to twenty-seven miles from the downtown. Beyond the two Bands and the Corewe also may use the rest of
Massachu-setts for aid in the analysis. The areas are shown in Figure II: FIGURE II
c or e
route 128 band outer band
25. Greater Boston is def ne y th Greater Boston Economic Study Committee (GBESC) as n lud ng those 149 cities and towns within approximately 30 miles of the State House in Cen-tral Boston. Metropolitan Boston is formally known as the Boston Standard Metropolitan Statistical Area (SMSA). The Boston Cbre, finally, also defined by GBESC, includes those 12cantral cities within roughly 8 miles of the State House.
e include also the State of Massachusetta for comparison purposes and for convenience. It would also be proper, if
resources permitted, to analyze the possible effects of the Route upon areas -in Rhode -Island and New Hampshire - we
concentrate here, however, upon the possible consequences in Eastern Massachusetts, notably Greater Boston.
16.
If we compare population and industrial growth in the
areas, presumably the Route 128 area should show, if there was a highway impact, a significant departure in measurement from any other area. if there is no significant departureeither there was no impact or the areas d efined do not show it and may need to be re-defined so as not to cloud the impact.
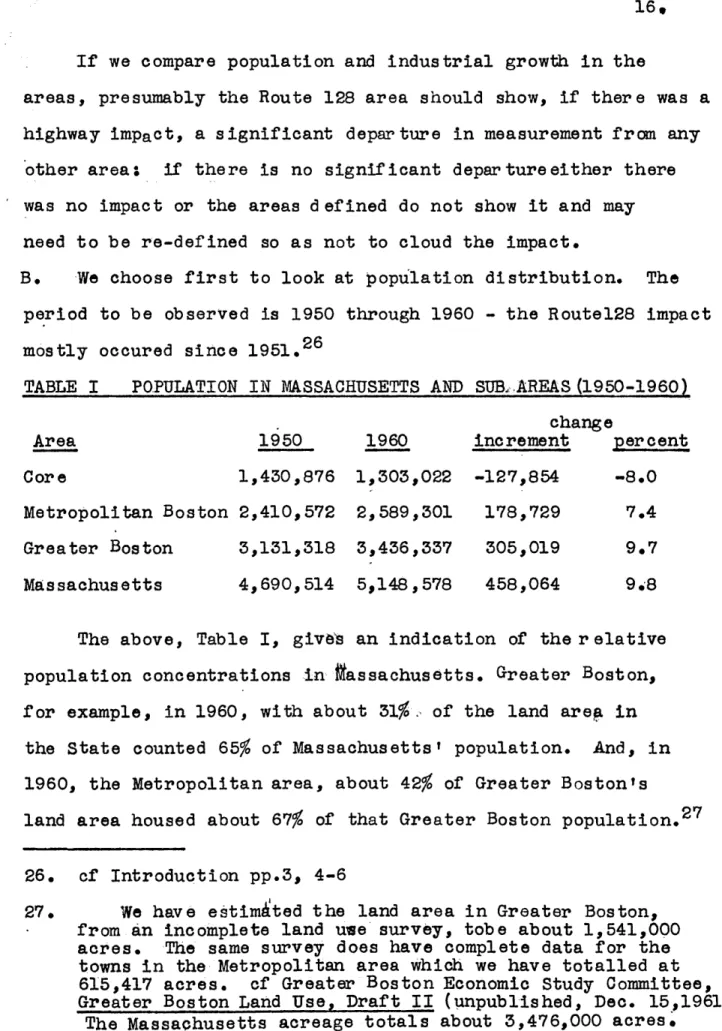
B. We choose first to look at population distribution. The period to be observed is 1950 through 1960 - the Routel28 impact mostly occured since 1951.26
TABLE I POPULATION IN MASSACHUSETTS AND SUB, AREAS (1950-1960) change
Area 1950 1960 increment percent
Core 1,430,876 1,303,022 -127,854 -8.0
Metropolitan Boston 2,410,572 2,589,301 178,729 7.4 Greater Boston 3,131,318 3,436,337 305,019 9.7 Massachusetts 4,690,514 5,148,578 458,064 9.8
The above, Table I, givob an indication of the relative population concentrations in fassachusetts. Greater Boston, for example, in 1960, with about 31% of the land areg in
the State counted 65% of Massachusettst population. And, in 1960, the Metropolitan area, about 42% of Greater Boston's
land area housed about 67% of that Greater Boston population.2 7
26. cf Introduction pp.3, 4-6
27. We have estimated the land area in Greater Boston, from an incomplete land use survey, tobe about 1,541,000 acres. The same survey does have complete data for the towns in the Metropolitan area which we have totalled at 615,417 acres. cf Greater Boston Economic Study Committee, Greater Boston Land Use, Draft II (unpublished, Dec. 15,1961).
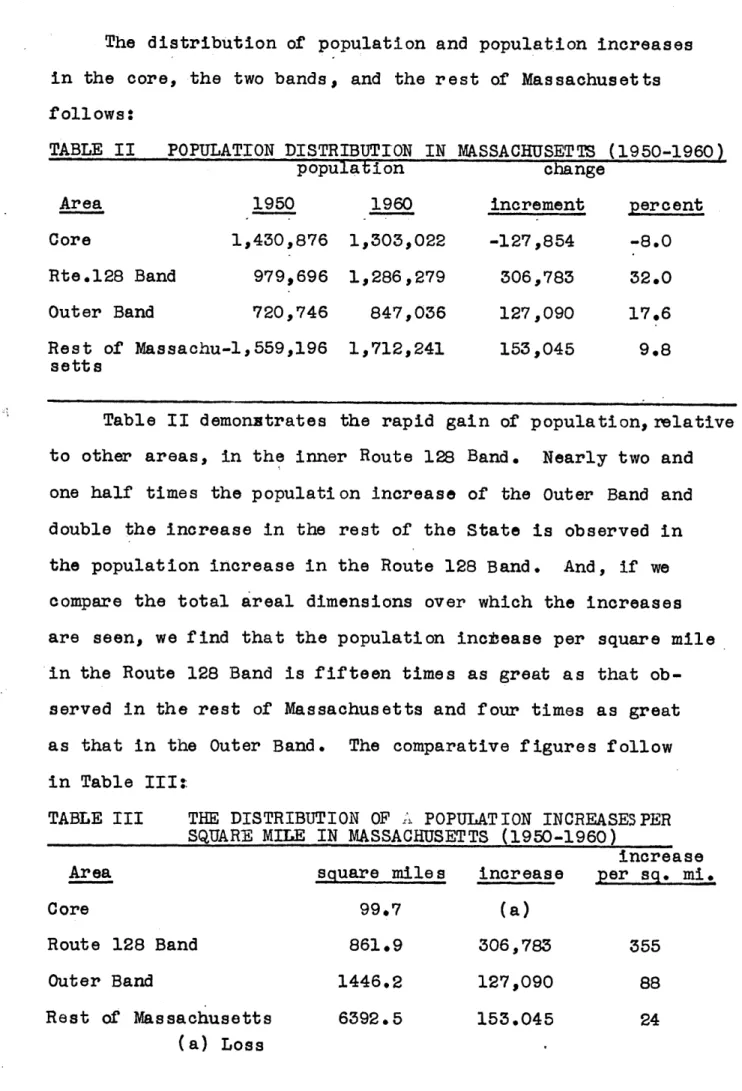
The distribution of population and population increases in the core, the two bands, and the rest of Massachusetts follows:
TABLE II POPULATION DISTRIBUTION IN MASSACHUSETTS (1950-1960)
population change
Area 1950 1960 increment percent
Core 1,430,876 1,303,022 -127,854 -8.0
Rte.128 Band 979,696 1,286,279 306,783 32.0
Outer Band 720,746 847,056 127,090 17.6
Rest of Massachu-1,559,196 1,712,241 153,045 9.8 setts
Table II demonstrates the rapid gain of population,relative to other areas, in the inner Route 128 Band. Nearly two and one half times the population increase of the Outer Band and double the increase in the rest of the State is observed in
the population increase in the Route 128 Band. And, if we compare the total areal dimensions over which the increases are seen, we find that the population incbease per square mile in the Route 128 Band is fifteen times as great as that
ob-served in the rest of Massachusetts and four times as great as that in the Outer Band. The comparative figures follow in Table III:
TABLE III THE DISTRIBUTION OF A POPULATION INCREASE3PER
SQUARE MILE IN MASSACHUSETTS (1950-1960)
increase Area square miles increase per sq. mi.
Core 99.7 (a)
Route 128 Band 861.9 306,783 355
Outer Band 1446.2 127,090 88
Rest of Massachusetts 6392.5 153.045 24
18.
The Route 128 Band has re ceived a lion's share of popula-tion increases in the State and in Greater Boston. We note, again, that this is a measured total impact: the result of metropolitan urbanization and suburbanization forces and, to
an unknown extent, perhaps some result of the highway.
Noting the population increases in the Route 128 Band, we recall in the Introduction, a sbatement that we should like
to consider problems encountered by abutting'and by non-abutting towns.
Not all Band towns will be touched by Route 495. Might these townst problems be lesser?
A distinction: of abutting, non-abutting does not appear to be valid for the Route 128 Band. Towns not abutting the highway experienced about as much population growth ( and actually their rate of population increase was faster) as the towns abutting. Of the 306,783 net population added in
the Band, 166,870 is accounted for by the 26 abutting towns (a 30% rate of increase) and 139,913 is accounted for by 38 non-abutting towns (36% increase). In assessing planning problems for certain levels of population growth it would be well, at Route 495, to expect similar problems of growth in
abutting and non-abutting towns; there is little need, thermf ore, to maintain any distinction in towns on this measure.
C. The more. apparent feature of Route 128 is its performance as a location f or industrial a ctivity.28 Industry also can*
introduce planning problems, as, among other things, industry is a land user, an origin and a destination of employee and
truck traffic; aid a generator, sometimes of the noise,dirt and smoke that can limit the spectrum of land uses considered as likely neighbors.
Industrial activity will be measured in employment
-employment data being generally more available.2 9 And, in this regard also our only estimates of future industrial
development are written in the language of employment data.3 0 In order to avoid confusion we choose to look at manu-facturing employment in our gross analysis of industrial
dis-tribution: the data thus would cover Standard Industrial Classification Categories 19 through 39. We recognize that
the activities such as retail and wholesale trade and services (which accounted for about 15% of employment "along" Route 128 in 1957 and 50% of the number of plants3 1) are highly impor-tant considerations for potential highway development but, also however, a great deLl of this employment is non-highway
-locating in central areas, local shopping districts etc. For -our purposes, concentration on manufacturing distribution
29. GBESC has tabulated employment data furnished it by the Massachusetts Division of Employment SecUrity. The datq includes "covered" employment: those employees covered by
the Employment Security Provisions. Such workers include all but'the self-employed, government workers, agricultural workers, those in domestic service, railroading, and non-profit institutions. The GBESC tabulations cover the years
1947-1957, 1950, 1954, and 1960 for the 149 cities and
towns in the s tudy area (lately increased to 153).
30. Namely, Melvin R. Levin and David Grossman, Industrial Land Needs in the Greater Boston Area Through 1980(Boston: GBESC and the Federal Reserve Bank of Doston, prepared by Planning Services Group, Octobdr, 1961)
31. This is the amount included in the Route 128 Study's two functional categories: Distribution and Service. Bone and Wohb, Table 11-4, p18 and Appendix 11-2, p206.
20.
ought tongive a clearer picture of the impact of Route 128 and its industrial attractiveness. Retail, service, and wholesale
jobs can be added into the limits by a factor of say, 15 or 20o, if need be, when the time comes to estimate a potential ceiling of jobs in the Outer Band.
We analyze the distribution of manufacturing employment increases in the Greater Boston Area during the decade of the 1950's.
It should be noted that the area designated as the Core, for the analysis, includes only the two central cities, Boston and Cambridge. These two cities have been strong industrial centers but recently they have lost industrial jobs to other locales.3 2
These are the cities from which most relocated companies on Route 128 had moved. 3 3 Relocated industries and relocated branch plants, also, we note, in 1957 accounted for 76.8
percent of total investment and 78.3 percent of total employment in 77 of 96 plants located within roughly a mile of Route 128.34
Where relocations to the Inner Circumferential have played such an important role in that highway's industrial development-a fdevelopment-actor not to be overlooked development-at Route 495 - and, where most
of the relocated plants have moved from Boston and Cambridge,
we choose, for purposes of investigating industrial distributions 32. Levin and Grossman, pll.
33. Bone and Wohl, p21. In tbrms of total investment in Route 128 plants, 96% of total investment in relocated plants has come from those plants which had been located within 41 miles of the State House - the areas, thus, of toston and Cambridge. 34. ibid, Table 11-4, pl8; Figure 11-7 p20; and p.21.
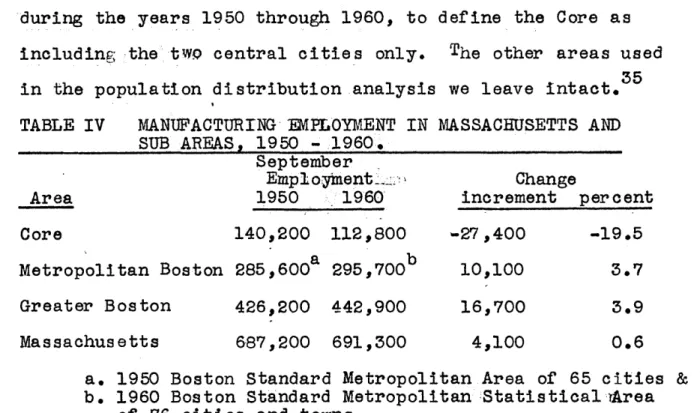
during the years 1950 through 1960, to define the Core as including the tw central cities only. The other areas used in the population distribution analysis we leave intact.3 5 TABLE IV MANUFACTURING EMPLOYMENT IN MASSACHUSETTS AND
SUB AREAS, 1950 - 1960.
September
Employment-' Change
Area 1950 1960 increment percent
Core 140,200 112,800 -27,400 -19.5
Metropolitan Boston 285,600a 295,700b 10,100 3.7 Greater Boston 426,200 442,900 16,700 3.9
Massachusetts 687,200 691,300 4,100 0.6
a. 1950 Boston Standard Metropolitan Area of 65 cities & towns b. 1960 Boston Standard Metropolitan Statistical Area
of 76 cities and towns
The concentration of industry in Massachusetts, as measured by manufacturing employment, is demonstrated in Table IV. In
1960, 64% of Massachusetts' manufacturing jobs are located in Greater Boston and, within that latter area, 67% of those
jobs are located in the Metropolitan Area. The ratios compare quite closely with the ratios of population con-centration - the shares of population and manufacturing jobs being almost exactly the same. 3 6 The distribution of manu-facturing employment in the core, the Bands, and the rest of
Massachusetts is now considered.
TABLE V THE DISTRIBUTION OF MANUFACTURING EMPLOYMENT IN
MASSACHUSETTS, 1950 -1960.
September
Employment Change
AREA 1950 1960 increment percent
Core 140,200 112,800 -27,400 -19.5
Route 128 Band 145,400 182,900 37,500 25.7
22. Sept emb er
Employment Change
Area 1950 1960 Increment Percent
Outer Band 140,600 147,200 6,600 4.7
Rest
of
Massachu- 261,000 248,400 -12,600 -4.8 settsTable V indicates how strongly the Route 128 Band has attracted net manufacturing jobs over and above any other area in the State. A small increase in the Outer Band is seen but this is only about one sixth the increase in the Route 128 Band. Enough jobs have been added to nearly offset losses in all the .rest of the state including the core (and also to offset manu-facturing jobs lost in the Route 128 Band itself in such indus-tries as textiles, leather, rubber etc). Whereas the manufac-turing jobs added in the Route 128 Band represent an addition of about 435 jobs in ten square miles, the increase in the Outer Band represents one of little over 45 jobs in ten square miles.
The distribution of manufacturing jobs within the Route
128 Band can also be considered. What particular towns got the new industrial locations? Did the non-abutting towns receive, as they did population distributions, a nearly equal share? In planning for industry
At
the Outer Belt is it worth knowing which towns may receive the new industries in an abuttingnon-abutting distinction?
The Bone & Wohl Route 128 Study, in 1957, counted the number of manufacturing employees at 14,563 - about 85% of total employment "along" the Route. We can compare this
37. That is, workers in their two functional categories, Production, and Research and Development, cf Bone and Wohl, Table II-A, p 18.
with total manufacturing employment in the towns that the
Bone Study covers, and for the period that Study extended, roughly, September 1950 through 1957. This comparison will give, an
indication of the employment "along" the highway vis-a-vis employment slightly beyond a one mile reach.
Of the jobs added in the towns in manufactnring,
app-roximately 46 to 93% are found to be added ithin one mile
of the highway, (depending on the industrial location groups).3 8 Over all the industrial location groups, the jobsadded along the highway account for about 61 percent of all manufacturing
jobs added in the Towns. 39
For the decade 1950 through 1960, meanwhile, we find a not increase of 30,330 manufacturing jobs in "developed" Route 128 towns - and a net loss of 6548 in certain SrI,
categories. 40Of the 37,500 job increase found in the Route
128 Band, then, only 7200 or so are located either in the abutting towns in the Band or in abutting but
non-41 "developed" Route 128 towns.
38. cf. Appendix I p 88.
39. ibid.
40. Totalled from GBESC employment data for the towns.
41. "Developed" Route 128 refers to the portion of the Route that is observed to display a fairly continuous arrange-ment of new plants as shown in the latest Massachusetts Department of Commerce Map of Industrial Development Along Massachusetts Route 128 (July, 1961). Towns excluded, thus, are: at the northern extremity, Gloucester -(with but two food-processor-warehouses 'not actually located along the Route), Manchester and Wenham; arid, at the southern
ex-tremity, with no observable industrial development along the~Route, Braintree, Milton Quincy, Randolph and Weymouth
(much of the land'being preempted by the Blue Hills Reserva-tion in Randolph, Quincy and Milton especially). "Abutting" towns number 26 and "developed" towns, 18.
24.
D. In summary the distribution of industrial locations measured by employment in manufacturing finds nearly all
Greater Boston increases in the Route 128 Bandand, within the Band, most increases are found in the "developed" towns,
finally, within the Towns, especially towns which had little industry previously (in the Burlington and South of Needham locational areas), nearly all, ninety percent of newjobs added1 are added within a mile, approximately of the highway. In the t'bywns more familiar with industrial locations in the past
(Waltham, Needham, Newton) only about 46% of jobs added appear to be added within one mile of the highway.4 2
The attractiveness of Route 128 to industry is rather more closely aligned with the highway than the distribution of population. For planners this may mean that unless abutting the highway, not much industry will locate in the Town. For abutting towns, industrial sites may 4ot necessarily need be located immediately adjacent to the highway where the town has a developed industrial base. For towns newly acquiring industry, sites adjacent to the highway would be demanded.
Population increases, on the other hand, may be equally experienced in abutting and non-abutting towns.
The increases in population and industry in the Route 128 Band are significantly greater than any increases in any such wide area of the State;
Route 128 and Route 495 should be of physical planning concern - not only to the Town planner immediately-adjacent to the highway but to the metropolitan, the regional, planner
(should he arrive), Of how much concern is Route495, however
must await the setting of the most that can be reasonably expected at the Outer Belt in population and industrial dis-tribution.
E. The preceding analysis of population and manufacturing employment distribution has indicated the strength of Greater Boston in relation to the rest of the State, and the State as
a whole. Massachusetts increased its population by 1,560,196 persons yet only 153,000, about ten percent, of the increase occurred outside Greater Boston in the 1950-1960 decade. Further, for manufacturing employment, the "pull" of Greater Boston appears even stronger. In the years 1950-1960,
Massachusetts increased its employment in manufacturing by 4100. All of this net increase is accounted for by the jobs added in Greater Boston which offset core losses and losses in
43 the Rest of Massachusetts, thus, to the amount of 4100.
Do these two observations, above, indicate an abnormality, a rate of growth, for Greatr Boston, above its norm, which we may account to Route 128?
We do not have areas that we are very sure are comparable to Greater Bostonls Areal definition; however, the Bureau of the Budget's definitions of SMSA's have been sufficiently de-fined objectively to~allow comparability.~
43. cf Table V. p 21,22.
44. Definitions have changed for some areas, however, as Bostonts current 76 city and town Standard Metropolitan Statistical Area (SMSA) differs from the Staindard Metropolitan Area of earlier years (SMA) of 65 cities and towns. We must assume, within
our limited resources, that the differences are not critical. And, if the criteria for changing Metropolitan area definitions are objective, then comparing one Metropolitan Area with
another(even though their own areal definitions may have changed) may not be so critical as comparing a Metropolitan area with itself when, in time, its area's definition has
26.
Where the "pull" of Greater Boston appears to be best and most clearly indicated by manufacturing employment we use
that employment as our parameter, our more sensitive measure. We are using, here for the moment, Greater Boston and Metropolitan Boston interchangeably, as the latter Is, 1950
through 1960, increase in manufacturing employment accounts for about 85% of Greater Boston incregses. 4 5
What is sought is a norm by which to judge the rate of growth in Metropolitan (and Greater) Boston.
We have chosen, for this purpose Boston's historical data being rather useless here - Metropolitan Areas which have demonstrated an increase in manufacturing employment
46
through the years 1947, 1954 and 1958. Only Metropolitan Areas with over 100,000 manufacturing employees in 1947 were chosen - the assumption b-eing that they would more
nearly represent Metropolitan boston's manufacturing character. The Metropolitan Areas comparable to boston for the
period, therefore:
45. from Table V, p 21.
46. Census of Manufacturer's Years. They do not corres-pond with the opening of Route 128, however, but there
is afficient overlap to allow the 1947-1958 period as useable.
TABLE VI LARGE MANUFACTURING METROPOLITAN AREAS WITH EMPLOYMENT GAINS 1947, 1954, and 1958
47. Other manufggturing areas were excluded - Buffalo, Chicago, Dayton, Detroit, Indianapolis, Kansas City ,
Youngstown - either for "losses" 1954, 1947-1958,~or 1954-1958. The "losses" may have resulted from changed areal definitions. New York is excluded
as too large for comparisons here.
1947-1958
Metropolitan Area Manufacturing Employment percent
1947 1958 increase Baltimore 170,062 198,000 16.0 Boston 271,273 301,000 10.0 Cincinnati 135,774 151,000 10.1 Cleveland 262,750 285,000 8.0 Los Angeles 358,772 725,000 100.0 Milwaukee 177,202 185,000 4.0 Minneapolis-St.Paul 118,824 144,000 20.1 Philadelphia 532,492 536,000 1.0 St. Louis 244,516 255,000 4.0 San Francisco-Oakland 163,641 191,600 16.0
If we remove the extremes, Los Angeles and Philadelphia, the average of the increases indicates a norm of about 11.0%.
Boston's metropolitan rate of growth measured by manu-facturing employment increases, does not appear to be anything but in-line with the estimated growth norm for a large metro-politan area. The Metropolitan and Greater Boston Areas would
appear to exhibit growth rates over this period that are very normal. This last is a significant point, for, if the rate of growth in the region is demonstrated as being normal, then
289
Route 128 which is observed as an "influencer" during the period cannot be regarded as stimulating Greater Boston (or Metropolitan Boston's) development. Rather, and the
hypothesis is advanced, Route 128 acted not as a "stimulator" but a "gatherer" 6f normal growth of population and industry
in the Greater Boston Region. Route 128's influence, then,
is regarded as exerted not upon regional growth, but upon regional distribution (or redistributicn),of persons and industries.
If we assume that this same thing would hold true for Route 495: that it be a gatherer not a stimulator, then it becomes qminently reasonable to say that the very most that
could be remotely plausible in development in the Outer Band-in the first decade of the highway's life - would amount to a gathering of all Greater Bostonts population and employment increasesfor the period. Of course we do not expect this to happen - it is highly unlikely. Tahles II and V indicate that Route 128 never did this even as it was located at the edge
of the built up area, close to the downtown, and immediately in the path of suburban movement. We capnot mpect that growth will halt in the areas outside the Outer Band because the
new circumferential is opened. There are good reasons to believe that the Route 495 area would nolt "gather" all
regional growth to it, but nonetheless, we can consider this possibility, if only to indicate the most that the highway impact could demand physical planning 4ttention.4 8
48. We shall discuss the more probable ranges of Outer Belt development later. cf 32-39
If, therefore, we have at our disposal projections of population and employment that appear fairly reasonable,
even high, for Greater Boston, then we can establish, from them, the most that could plausibly occur at the Outer Band.
The time period for which we seek projections will be the decade of the 1970as. We have no official schedule for completion of the Outer Belt. In the northern portion of the highway, some 62 miles are currently under design, construction
or have been completed: 40, 14 and 8 miles respectively. 49 The southern portions, from Route 9 in Westborough to proposed Route 95 in Mansfield, about 26 miles, were1as of the Fall
of 1961), then in the survey and mapping stages.
The study of Industrial Land Needs for 1980 in Greater Boston suggests that, at the present rate of construction, Route 495 would be completed around 1970. If this true, and where our study of apparent Route 128 impact covers the decade, 1950 through 1960, we similarly use a decade: the ten years after expected completion of the highway, 1970-1980. The interim period, 1960-1970, we expect will.grow somewhat in line with present conditions and we use for this decade the Greater Boston Economic Study Committee estimates to 1970.51
49. Commonwealth of Massachusetts, Department of Public Works, A report of Progress to Gov. John A. Volpe on the Massachusetts Highway Program (Fall, 1961), pp26-31 and 10-14.
50. ibid.
51. Especially, Economic Base Report No. 4, The Population of the Cities and Towns of Greater Boston Projected to 1970; and Greater Boston Ecohomic Study Committee, Revised 1970 Populations Projections For the 149 Cities and Towns In
30.
CHAPTER II The Outer Band Range of Development.
A.
The previous chapter demonstrates that whatever impact had occurred because of Route 128, that impact can be found within Greater Boston. The area defined by GBESC had becomethe locus of most population increases and all net manufacturing job additions in Massachusetts.5 2 And, we proposed, the most population and employment that the Outer Band might plausibly receive would be no more than the normal Greater Boston
increase-and most probably something a good deal less.
This chapter attempts to discover what the ceiling upon expectations would be and what possibly narrow range within that ceiling may be more reasonably expected in the Outer Band, 1970-1980.
A study of land needs for industry has estimated a possible 475,000 manufacturing jobs by 1970 and 555,000 by 1980.53 The projections are admittedly optimistic.54 Where Greater Boston's
manufacturing employment grew at a rate of 4% in the decade of the 1950's,5 5 the projections would see the rate double in the 60's and double again in the 70ts. The consultants believe
52. This is observed also, in: Everett J. Burtt, Economic Base Report No. 3, Recent Changes in the Employment Structure of
GreaterBoston (Boston: Greater Boston Economic Study Committee, November 1959), pl.; and in Frank L. Sweetser, Economic Base Report No. 2, the. Population of Greater Boston
Projected to 1970 (Boston: Greater Boston Economic Study Committee, June 1959), p.4.
53. Levin and Grossman, p 54, Table V Ratio projections based upon Federal Reserve Bank of Boston
54. They are felt to indicate a "considerable improvement in Greater Boston's employment level as compared to the 1957
(and 1959) levels." Levin and Grossman p 42; also p 77. 55. Table IVi p 21, supra.
the projections to be generally reliable, not definitive, but adequate for their purposes56 and also adequate, we think, for ours.
For population in the Greater Boston Area beyond 1970 we do not have any formal projections. We can use an economic base approach and estimate the 1980 population relying upon a presumed relationship between basic (manufacturing) employment and populati on.
The observable ratio of basic employmett to population in 1950 in Greater Boston was .136; and, in 1960 .128. GBESC has projected a total population of 3,738,999 in the study area by 197057 : comparing this with the estimated 475,000 basic employment for 1970 we find a ratio of .127. If the ratio, .127, were to hold through 1980, population in the
Area may be estimated at sometning 'like 4,370,000 - an increase over expected 1970 of about 630,000 persons.58
The most remotely plausible (but highly unlikely) extent
of Route 495 area development would ihelude all of the Greater
56. Levin and Grossman, pp4l-42*
57. Frank L. Sweetser, Economic Base Report No.2.
58. Again, this is'probably optimistic: the job projections are optimistic; the ratio itself has decreased since 1950; and we have a 1980 guess of about 4,000,000 persons
(somewhere between 1975 and*1985) in thearea. If this
latterwere reached in 1980, the increase in Greater Boston's Population would not be 630,000 but a good deal less
-about 260,000. The 1980'"guess" is found in Greater Boston Economic Study Committee, People and Money ( Interim Report) p.1. The 630,000 increase would be an increase of 16.8% over an estimated 1970 (GBESC) population of 3,738,000
persons - this wheres 1950-1960 the increase was around 9.6%'and the 1960-1970 increase is expected to be around 8.8%0
32.
Boston population and industrial increases, 1970-198Q in the Outer Band. This ceiling would be estimated rather optimis-tically at 80,000 jobs and 630,000 persons added. Can we narrow the range to a more likely coverage? To do this we need to take. a slighlty more sober look at Route 128 and its similarity or dissimilarity, possibly, to the Route 495 cir-cumstance.
B. As far as industrial development at Route 128 is con-cerned, the comments of Mr. Robert H. Ryan, Vice President of Cabot, Cabot and Forbes - the company which played so great a role in the highway's industrial development - are worth noting.5 9 His comments are summarized:
1. Greater Boston was and is an old community but with pressures of growth.
2. Old industrial facilities had depreciated many times
over in the accounting sense, and had become expensive to operate in multi-story buildings, with no parking, and bad materials handling facilities.
3. There was in existence no available inventory of land ready to build on industrially so new sites had to be made - there was plenty of raw land everywhere but none
ready to build upon.
4. A new limited access highway (Route 128) was built.
59. Robert H.Ryan, "Planned Industrial Districts", 42nd Annual Conference of the Massachusetts Federati6=n~ Planning Boards (October 19 and 20, 1956) pp 3-4
5. A good Aguess would have been that land along the limited
access highway was going to appreciate in value.
6. Time was becoming more importantin transportation than distance.
Mr.Ryan's comments can be applied to expectations of industrial development along any future limited access highway this is precisely why Route 495 may not be, in its initial decade of life at least, another Route 128.
Without the relocated growing industrids that left the core areas Route 128 probably would never be called "Golden", nor "Industrial", and about all that might be leftof its
appbllation would be "Semicircle". Without the relocated industries Route 128 in 1957 may have attracted perhaps $20,000,000 (instead of $85, 000,000) in investment., in 19 plants (instead of 96), hiring 3,700 employees (instead of
60
17,000). Instead of seeing about twenty plants per ten 61
miles, we might be seeing six per ten miles.
At the present time, there is little indicaticn of the prospects of future growth industries located now eiher in Boston or other centers which may relocated to a Aoute 495. Nor do we know how much.-new employment projected may actually be added in new plants.
60. cf Bone and Wohl, p 18 Table II-d; amd p 21.
61. This estimate from a survey for the Associated Industries of Massachusetts: Roger Johnson, "Route 128 Study Assesses Social and Economic Impact", Industry (Boston: AIM, December 1960) pp 11-12. The study found 169 plants visible from the highway (over an 80 mile length, including the extension
to Route 3 in the south) and of these 121 were relocated plants. .
34.
We do know, however, that industry that has decentra-lized, has done so at low densities and can thus expand on
62
their present sites without relocation. - with a good deal of growth industries observed along Route 128, projected economic expansion, projected employment increases, may, possibly be satisfied by additions to physical plant at existing locations.
We do know that while 'Route 128 may have been the only truly limited access highway in 1951, since then, we have the Massachusetts Turnpike, Route 3, Route 24, Interstate 93 and 95 and the Southeast Expressway completed or sub-stantially complete. In addition to proposed Route 495 another Radial proposed Route 95 South will be added; also
six of seven radials are proposed to extend from Route 128 into the core and the proposed Inner Belt.
We note that in the Core and a Band of surrounding com-munities there remains about 9700 acres of suitable6 3 (for
development) land vacant and zoned for industry6 4 -this within roughly 15 miles of the State House.
In Greater Boston, with Mr. Ryants comments in mind, ve
62. cf. Levin and Grossman, p 51.
63. "Suitable" as defined by GBESC: i.8. having less than
15 per cent slope and not adjudged to be swampy. Greater
Boston Economic Study Committee, Greater Boston Land Use (Boston, December 1961, draft II), p.5
64. The GBESC land use and zoning studies are summarized in Levin and Grossman, for their areal definitions, g.v.,
p.9 (insert). And,' the data is presented in Table III
find now a great deal of land at least zoned for industry. There were, as of 1960, over 55,000 acres of vacant land zoned for industry and, of this, about 39,000 acres was adjudged "suitable".
When Route 128 first opened it was noted that sites for industry had to be made as none were available ready to
biild upon.65 The industrial parl - a planned industrial district usually with utilities, central management, package deals and the like - is a relative newcomer on the scene. Of 7223 acres so developed by 1961, only 109 acres were developed prior to 1950.66 And, in these parks and in others currently under development, an additional 5000 acres is available or will be available for industrial development. Half of the acreage is available, also, within these communities roughly 15 miles from central Boston -. in 2400 acres' or so.
There are plenty of industrial sites alternative to Route 495 locations, The situation for the Outer Belt would appear to be rather different from what faced Route 128 in the early 1950 's. To expect a Route 128 kind of
in-dustrial impact for the Outer Belt, at least in its initial decade of life would seem to be highly optimistic. The highway may .well be neutral as an industrial locator
con-sideration. If this is so, then perhaps vhat may occur is about a continuation of the Greater Boston share of jobs -that is observed in 1950 and 1960 in the Outer Band, thus
through 1970 -and 1980.
65. p 32 supra.
36. From Table V we can calculate the employment distribu-tion in the sub-areas of Greater Boston.
TABLE VII THE DISTRIBUTION OF MANUFACTURING EMPLOYMENT IN GREATER BOSTON 1950 amd 1960
percent distribution
Area 1950 1960
Core 33.0 25.5
Route 128 Band 34.0 41,5
Outer Band 33.0 33.0
In Table VI we note that the Outer Band Area main-tained about a one third share of Greater Boston jobs in 1950 and 1960. If this were to continue, and if we accept
the 475,000 and 555,000 projections for 1970 and. 1980, then the Outer Band may have perhaps 158,000 manufacturing jobs by 1970 and 184,000 by 1980 - the increase, then, 10,800 in the 1960's and 26,000 in the 1970's. If the Outer Band increase were to parallel, however, the Route 128 increase, and we feel this to be unlikely, the increase
over a presumed 1970 share of 158,000 may be more nearly 67
41,000. Whether all of any one of these increases in employment would be r eflected in new plant construction is rather debatable.
C. An estimate of the more likely range of population increases in the Outer Babd requires' a number of guesses and assumptions. The "filling-in" within the Metropolitan Area can be expected to continue. We can look historically at the share of Greater Boston's population in 1950 and 1960;