HAL Id: hal-03108573
https://hal.archives-ouvertes.fr/hal-03108573
Submitted on 13 Jan 2021HAL is a multi-disciplinary open access archive for the deposit and dissemination of sci-entific research documents, whether they are pub-lished or not. The documents may come from teaching and research institutions in France or abroad, or from public or private research centers.
L’archive ouverte pluridisciplinaire HAL, est destinée au dépôt et à la diffusion de documents scientifiques de niveau recherche, publiés ou non, émanant des établissements d’enseignement et de recherche français ou étrangers, des laboratoires publics ou privés.
Deactivation of Cu/FER-Exchanged Zeolites Dedicated
to the SCR of NOx with NH3
Marie-Laure Tarot, Mathias Barreau, Daniel Duprez, Vincent Lauga, Eduard
Iojoiu, Xavier Courtois, Fabien Can
To cite this version:
Marie-Laure Tarot, Mathias Barreau, Daniel Duprez, Vincent Lauga, Eduard Iojoiu, et al.. Influence of the Sodium Impregnation Solvent on the Deactivation of Cu/FER-Exchanged Zeolites Dedicated to the SCR of NOx with NH3. Catalysts, MDPI, 2018, 8 (1), pp.3. �10.3390/catal8010003�. �hal-03108573�
catalysts
Article
Influence of the Sodium Impregnation Solvent on the
Deactivation of Cu/FER-Exchanged Zeolites
Dedicated to the SCR of NO
x
with NH
3
Marie-Laure Tarot1, Mathias Barreau1, Daniel Duprez1, Vincent Lauga2, Eduard Emil Iojoiu2, Xavier Courtois1,* ID and Fabien Can1,*
1 CNRS, UMR 7285 Institut de Chimie des Milieux et Matériaux de Poitiers (IC2MP), Université de Poitiers, 4 rue Michel Brunet—TSA 51106—86073 Poitiers CEDEX 9, France;
marie.laure.tarot@univ-poitiers.fr (M.-L.T.); mathias.barreau@univ-poitiers.fr (M.B.); daniel.duprez@univ-poitiers.fr (D.D.)
2 Renault Trucks—Volvo Group Trucks Technology—Powertrain Engineering Lyon, 99 route de Lyon—69806 Saint-Priest CEDEX, France; vincent.lauga@volvo.com (V.L.);
eduard.emil.iojoiu@volvo.com (E.E.I.)
* Correspondence: xavier.courtois@univ-poitiers.fr (X.C.); fabien.can@univ-poitiers.fr (F.C.); Tel.: +33-519453994 (X.C.); +33-549453997 (F.C.)
Received: 24 November 2017; Accepted: 19 December 2017; Published: 23 December 2017
Abstract: The effect of the sodium addition mode was investigated on model Cu/FER selective catalytic reduction (SCR) catalysts with two copper loadings (2.8 wt. % and 6.1 wt. %) in order to compare samples with or without over-exchanged copper. Na was added by wet-impregnation using two solvents: water or ethanol. Catalysts were evaluated in Standard and Fast-SCR conditions,
as well as in NO and NH3oxidation. They were characterized by H2-TPR, NO and NH3adsorption
monitored by FT-IR. As expected, whatever the copper loading, ammonia adsorption capacity was decreased by Na additions. Interestingly, characterizations also showed that Na impregnation in water favors the migration of the Cu-exchanged species, leading to the formation of CuO extra-framework compounds. Consequently, for both copper loadings, Na impregnation in water led to a stronger catalyst deactivation than impregnation in ethanol. Finally, the NOxconversion at low temperature
(250◦C) appeared mainly affected by the loss in NH3 adsorption capacity whereas the deNOx
deactivation at high temperature (500◦C) was rather governed by the decrease in the exchanged
copper ratio, which also induced a partial inhibition of NO and NH3oxidation behaviors. Keywords:NH3-SCR; sodium poisoning; copper exchanged zeolite; acidity
1. Introduction
Selective catalytic reduction of NOxby ammonia (NH3-SCR) is an effective method to control
nitrogen oxides emissions from fixed-source exhaust gases. The main involved reactions are the “Standard-SCR” reaction (Equation (1)) and the “Fast-SCR” reaction (Equation (2)).
2NH3+ 2NO +
USV Symbol Macro(s) Description
00AA ª \textordfeminine \textsuperscript{a}
FEMININE ORDINAL INDICATOR
00AB « \guillemotleft \textflqq
LEFT-POINTING DOUBLE ANGLE QUOTATION MARK
00AC ¬ \textlogicalnot \textlnot \textneg
NOT SIGN
00AE ® \textregistered REGISTERED SIGN
00AF ¯ \textasciimacron MACRON
00B0 ° \textdegree DEGREE SIGN
00B1 ± \textpm \textplusminus PLUS-MINUS SIGN 00B2 ² \texttwosuperior \textsuperscript{2} SUPERSCRIPT TWO 00B3 ³ \textthreesuperior \textsuperscript{3} SUPERSCRIPT THREE
00B4 ´ \textasciiacute ACUTE ACCENT
00B5 µ \textmu MICRO SIGN
00B6 ¶ \textparagraph \textpilcrow PILCROW SIGN 00B7 · \textcentereddot \textperiodcentered \textcdot MIDDLE DOT 00B8 ¸ \textasciicedilla \textcedilla CEDILLA 00B9 ¹ \textonesuperior \textsuperscript{1} SUPERSCRIPT ONE 00BA º \textordmasculine \textsuperscript{o}
MASCULINE ORDINAL INDICATOR
00BB » \guillemotright \textfrqq
RIGHT-POINTING DOUBLE ANGLE QUOTATION MARK
00BC ¼ \textonequarter VULGAR FRACTION ONE QUARTER
00BD ½ \textonehalf VULGAR FRACTION ONE HALF
00BE ¾ \textthreequarters VULGAR FRACTION THREE QUARTERS 00BF ¿ \textquestiondown INVERTED QUESTION MARK 00C0 À \`{A}
\capitalgrave{A}
LATIN CAPITAL LETTER A WITH GRAVE
00C1 Á \'{A}
\capitalacute{A}
LATIN CAPITAL LETTER A WITH ACUTE
00C2 Â \^{A}
\capitalcircumflex{A}
LATIN CAPITAL LETTER A WITH CIRCUMFLEX
00C3 Ã \~{A}
\capitaltilde{A}
LATIN CAPITAL LETTER A WITH TILDE
00C4 Ä \"{A}
\capitaldieresis{A}
LATIN CAPITAL LETTER A WITH DIAERESIS
00C5 Å \r{A}
\capitalring{A} \AA
LATIN CAPITAL LETTER A WITH RING ABOVE
00C6 Æ \AE LATIN CAPITAL LETTER AE
00C7 Ç \c{C}
\capitalcedilla{C}
LATIN CAPITAL LETTER C WITH CEDILLA
00C8 È \`{E}
\capitalgrave{E}
LATIN CAPITAL LETTER E WITH GRAVE
00C9 É \'{E}
\capitalacute{E}
LATIN CAPITAL LETTER E WITH ACUTE
00CA Ê \^{E}
\capitalcircumflex{E}
LATIN CAPITAL LETTER E WITH CIRCUMFLEX
00CB Ë \"{E}
\capitaldieresis{E}
LATIN CAPITAL LETTER E WITH DIAERESIS
00CC Ì \`{I}
\capitalgrave{I}
LATIN CAPITAL LETTER I WITH GRAVE
2
O2→2N2+ 3H2O (1)
2NH3+ NO + NO2→2N2+ 3H2O (2)
In fact, the activity obtained in Standard-SCR condition is largely improved by favoring the
oxidation of NO to NO2 to provide the most favorable NO2/NOx ratio of 0.5, leading to the
“Fast-SCR” stoichiometry.
More recently, this NH3-SCR technology was adapted to mobile sources to reach the
environmental standards dedicated to passenger cars and heavy duty vehicles. Ammonia is then
usually obtained by the decomposition of an aqueous solution of urea, which is injected in the exhaust pipe. The first generations of NH3-SCR catalysts were based on V2O5-WO3-TiO2materials, as usually
implemented for NOxtreatment from power plants and stationary sources. Subsequently, new systems
have emerged to expand the operating temperature window and to solve the high temperature deactivation drawback due to the anatase-rutile transition of TiO2and the possible V2O5sublimation.
Metal-exchanged zeolite-based catalysts were reported to be relevant materials for this purpose. A variety of zeolites have been proposed (ZSM-5, mordenite, beta, ferrierite, Y-zeolite, chabazite, . . . ) and in the last few years, new generations of exchanged catalysts based on small pore zeolites have emerged. For instance, SAPO-34 or SZZ-13-based zeolites showed very good hydrothermal stabilities and also a resistance to hydrocarbon (HC) poisoning [1–4]. Zeolites are usually promoted by transition metals such as iron or copper [5]. Compared with iron-exchanged zeolites, copper-zeolite catalysts were reported to be more active at low temperature (<300◦C), less sensitive to the inlet NO2/NOx
ratio, but produced more N2O [6].
Besides, CO2emissions from common fossil sources induce a worrying situation that requires
to increase the role of renewable resources for energy production. Biomass can be used as feedstock for the production of biodiesel which can be then utilized in the transport sector to replace fossil fuels. According to the recent European legislation (Directive 2003/30/EC), 10% share of biofuels in the transport sector must be achieved by 2020. However, biodiesel contains minerals traces such as sodium, potassium or phosphorus, which are authorized in limited amounts (maximum of 5 and 4 ppm for Na + K and P, respectively in European Union; EN 14214). Considering that (i) the Euro VI standard for heavy duty vehicles requires a durability of 700,000 km and (ii) some truck fleets use biodiesel exclusively, catalysts in the exhaust pipe may be subjected to kilograms of these poisons.
Consequently, this study is focused on the influence of Na deposit on the NH3-SCR process over
copper-exchanged zeolite.
The effects of alkali on vanadia-based SCR catalysts are well described in the literature. For instance, exchange of alkali metal cation from the acids groups of V-OH species decreases the acidity, leading to a loss of ammonia-sorption properties [7]. The deactivation of the V5+= O redox sites was also highlighted [8]. In addition, potassium was reported to induce a stronger deactivation than sodium, for four similar weight contents of sodium and potassium (0.1, 0.5, 1, 2 wt. %) in the same catalyst [9]. Similar conclusion was reported by Kern et al. [10] for iron-exchanged catalysts with
K and Na contents from 0 to 0.5 mmol/gcata. However, only few studies concerning the poisoning
of zeolites by alkali are available. Sodium and potassium are supposed to lead to the same type of deactivation. Shwan et al. studied the poisoning of a Fe-BEA zeolite by exposition to vapors from an aqueous solution of KNO3[11]. This poisoning led to a decrease in the Brønsted acidity and to
a loss of active isolated iron species, but also increased both the NOxstorage behavior and the NO
oxidation activity. Ma et al. [12] observed the same tendencies on the Cu/SAPO-34 poisoned by
incipient wetness impregnation. They also noticed that the Standard-SCR activity is not impacted with 0.5 wt. % of potassium. Adding potassium firstly affected the low temperature activity (<300◦C) together with an increase in the N2O formation. In addition, Brookshear et al. [13,14] showed the
importance of the diesel exhaust pipe design toward the sodium impact on the SCR catalyst. The heavy duty configuration (Diesel Oxidation Catalyst (DOC)—Diesel Particulate Filter (DPF)—SCR) was less impacted by sodium than in the light-duty configuration (DOC-SCR-DPF), because sodium was preferentially trapped by the DPF.
The aim of this study was to investigate the deactivation of Cu-FER catalysts by sodium, with a special focus on the influence of the sodium impregnation solvent. The ferrierite (FER) structure was selected as host support because of its medium pore size allowing a high thermal stability [15]. FER structure was also claimed as appropriate structure for iron or copper-exchanged SCR catalysts [16]. Impregnation of sodium in water was used especially to simulate cold start/engine switch off periods, for which water condensation occurs in the exhaust pipe [11,12,17]. However, the use of such polar solvent should not be representative of Na-catalyst interactions in the exhaust pipe at usual operating
Catalysts 2018, 8, 3 3 of 20
temperature. Then, sodium impregnations were also performed in ethanol, which is less polar than water, to avoid interactions between water and the exchanged zeolite. This is assumed to be more representative of a gas phase poisoning. In order to compare the different mechanisms of deactivation depending on the Na impregnation solvent, two catalysts with or without extra-framework copper were used, containing 6.1 wt. % and 2.8 wt. % of copper, respectively.
2. Results
2.1. Structural/Textural Characterisation of the Catalysts, Elemental Analysis 2.1.1. Sodium Free Catalysts
XRD patterns of the zeolite as received and after the hydrothermal treatment at 600◦C are reported in Supplementary Materials (Figure S1). No evolution of the diffraction peaks were evidenced, which is also consistent with the stability of the specific surface area at 395–405 m2·g−1. However, the infrared structural band (T–O–T vibrations) were shifted from 1096 to 1103 cm−1after aging, indicating a small dealumination of the zeolite (Supplementary Materials, Figure S2).
After copper exchange, no evolution of the zeolite structure was observed by XRD analysis.
No new diffraction peak appeared over Cu2.8/FER, whereas broad diffraction peaks appeared on the
diffractogram of Cu6.1/FER near 2θ = 35.5◦and 38.7◦, which are attributed to CuO (Supplementary
Materials, Figures S3 and S4). For both copper loadings, metal exchange and subsequent hydrothermal
treatment induced a decrease of about 10% of the specific surface area, at around 352 m2 g−1 for
Cu2.8/FER and Cu6.1/FER (Table1).
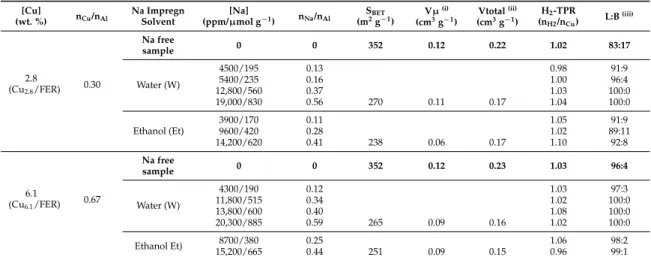
Table 1.Catalysts characterizations.
[Cu] (wt. %) nCu/nAl Na Impregn Solvent [Na] (ppm/µmol g−1) nNa/nAl SBET (m2g−1) Vµ(i) (cm3g−1) Vtotal(ii) (cm3g−1) H2-TPR (nH2/nCu) L:B (iii) 2.8 (Cu2.8/FER) 0.30 Na free sample 0 0 352 0.12 0.22 1.02 83:17 Water (W) 4500/195 0.13 0.98 91:9 5400/235 0.16 1.00 96:4 12,800/560 0.37 1.03 100:0 19,000/830 0.56 270 0.11 0.17 1.04 100:0 Ethanol (Et) 3900/170 0.11 1.05 91:9 9600/420 0.28 1.02 89:11 14,200/620 0.41 238 0.06 0.17 1.10 92:8 6.1 (Cu6.1/FER) 0.67 Na free sample 0 0 352 0.12 0.23 1.03 96:4 Water (W) 4300/190 0.12 1.03 97:3 11,800/515 0.34 1.02 100:0 13,800/600 0.40 1.08 100:0 20,300/885 0.59 265 0.09 0.16 1.02 100:0 Ethanol Et) 8700/380 0.25 1.06 98:2 15,200/665 0.44 251 0.09 0.15 0.96 99:1
(i): microporous volume deduced from N
2adsorption/desorption at 77 K;(ii): total porous volume deduced from N2 adsorption/desorption at 77 K;(iii): Lewis acid sites (L); Brønsted acid sites (B) ratio determined by NH
3adsorption at 50◦C.
2.1.2. Na Impregnated Catalysts
All the sodium loading from Inductively Coupled Plasma (ICP) elemental analysis are reported
in Table1depending on the copper content and the Na impregnation solvent.
For each Cu2.8/FER and Cu6.1/FER catalyst, four Na loadings from 4300–4500 ppm to
19,000–20,300 ppm were obtained by sodium impregnation in water. The specific surface areas of the highest loaded samples were decreased to 265–270 m2g−1, compared with 352 m2g−1for the fresh catalysts (Table1). In addition, the XRD patterns of the corresponding samples point out the appearance of CuO for Cu2.8/FER whereas the intensity of the CuO peaks significantly increased for
Sodium loadings after impregnation in ethanol were ranked between 3900–14,200 ppm and 8700–15,200 ppm for Cu2.8/FER and Cu6.1/FER, respectively. No evolution of the XRD patterns was
observed compared with the sodium free catalyst (patterns not shown), unlike the impregnation of Na in water. This first result already predicts an effect of the sodium solvent toward physico-chemical properties of the materials. The specific surface areas for the higher Na amounts decreased to 240–250 m2g−1(Table1).
2.2. Catalytic Activity
NOxconversions obtained over stabilized Cu2.8/FER and Cu6.1/FER samples (without sodium)
are reported in Figure1for the Standard-SCR and Fast-SCR conditions. Please remind that the catalytic tests in Fast-SCR condition were performed with lower amount of catalyst (15 mg versus 50 mg for the Standard-SCR condition) to limit the deNOxefficiency and to possibly distinguish a deactivation by
sodium addition.
Catalysts 2018, 8, 3 4 of 19
properties of the materials. The specific surface areas for the higher Na amounts decreased to 240– 250 m2 g−1 (Table 1).
2.2. Catalytic Activity
NOx conversions obtained over stabilized Cu2.8/FER and Cu6.1/FER samples (without sodium)
are reported in Figure 1 for the Standard‐SCR and Fast‐SCR conditions. Please remind that the catalytic tests in Fast‐SCR condition were performed with lower amount of catalyst (15 mg versus 50 mg for the Standard‐SCR condition) to limit the deNOx efficiency and to possibly distinguish a
deactivation by sodium addition.
Figure 1. NOx conversion by NH3 over Cu/FER‐exchanged zeolite. (A) standard‐SCR; (B) Fast‐SCR.
(—, ): Cu2.8/FER; (—, ): Cu6.1/FER.
In Standard‐SCR condition (Figure 1A), the best activity at low temperature was achieved by the Cu6.1/FER catalyst with a full NOx conversion at around 300 °C. However, the NOx conversion showed
a net drop in the 350–500 °C temperature range. It is assigned to a competition between the NOx
reduction reaction and the ammonia oxidation reaction, leading to a lack in ammonia to reduce NOx.
To the opposite, Cu2.8/FER sample presented an expanded operating temperature window, with
around 90–95% of NOx conversion from 300 to 500 °C. The maximum outlet N2O concentration was
recorded at 500 °C, at 1.5 and 5 ppm for Cu2.8/FER and Cu6.1/FER, respectively.
Compared with the Standard‐SCR condition, higher NOx conversions were observed at low
temperature (200 °C) in Fast‐SCR condition (Figure 1B), especially taking into account that the implemented catalyst weight was divided by more than 3. Again, a decrease in NOx conversion was
denoted at temperature higher than 350–400 °C, especially for Cu6.1/FER samples, attributed to the
ammonia oxidation reaction. The maximum outlet N2O concentration (500 °C) was then a little
increased, at 4 and 7 ppm for Cu2.8/FER and Cu6.1/FER, respectively.
Standard‐SCR and Fast‐SCR catalytic tests were also performed on the Cu/FER zeolite containing various sodium loadings. Preliminary tests were performed with catalysts submitted to the impregnation procedures in water or ethanol, but without sodium salt. Results (not shown) indicated no change in the catalytic behavior.
In order to illustrate the influence of both sodium content and sodium impregnation solvent (water or ethanol) on the deNOx efficiency of both Cu2.8/FER and Cu6.1/FER catalysts, two
representative temperatures were selected: 250 °C was chosen to compare the deNOx behaviors at
“low” temperature, while 500 °C was selected for the “high” temperature comparisons. Figure 2 compares the loss of the NOx conversion (expressed as a percentage of loss compared with the Na
free samples) at “low” and “high” selected temperatures, depending on the sodium content (water and ethanol solvents are presented in blue and red lines, respectively). Note that the N2O outlet
concentration was not affected by sodium additions.
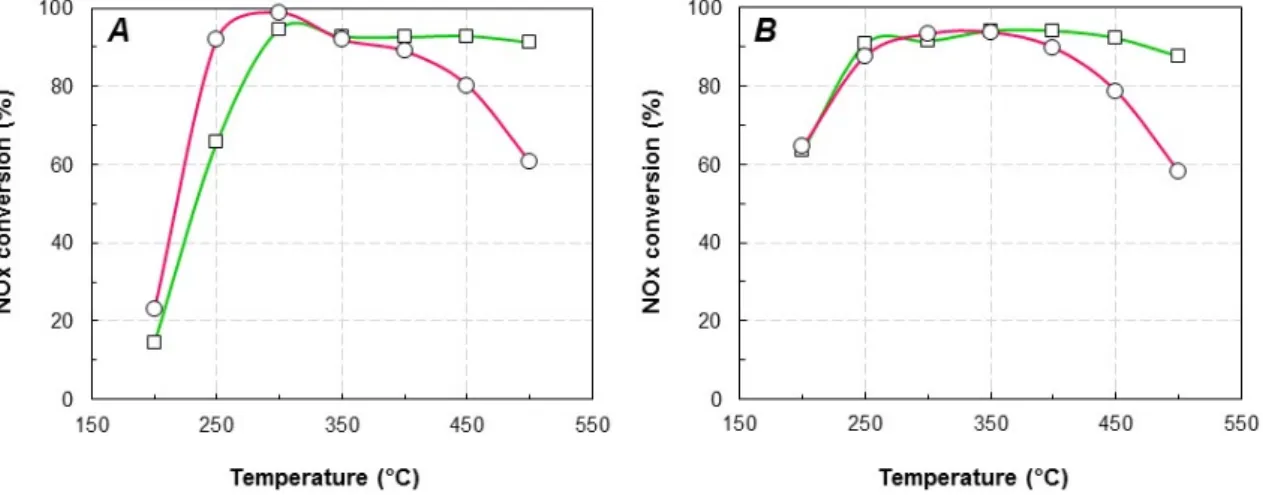
Figure 1.NOxconversion by NH3over Cu/FER-exchanged zeolite. (A) standard-SCR; (B) Fast-SCR. (
Catalysts 2018, 8, 3 4 of 19
Na in water. This first result already predicts an effect of the sodium solvent toward physico-chemical properties of the materials. The specific surface areas for the higher Na amounts decreased to 240– 250 m2 g−1 (Table 1).
2.2. Catalytic Activity
NOx conversions obtained over stabilized Cu2.8/FER and Cu6.1/FER samples (without sodium)
are reported in Figure 1 for the Standard-SCR and Fast-SCR conditions. Please remind that the catalytic tests in Fast-SCR condition were performed with lower amount of catalyst (15 mg versus 50 mg for the Standard-SCR condition) to limit the deNOx efficiency and to possibly distinguish a
deactivation by sodium addition.
Figure 1. NOx conversion by NH3 over Cu/FER-exchanged zeolite. (A) standard-SCR; (B) Fast-SCR.
(—, ): Cu2.8/FER; (—, ): Cu6.1/FER.
In Standard-SCR condition (Figure 1A), the best activity at low temperature was achieved by the Cu6.1/FER catalyst with a full NOx conversion at around 300 °C. However, the NOx conversion showed
a net drop in the 350–500 °C temperature range. It is assigned to a competition between the NOx
reduction reaction and the ammonia oxidation reaction, leading to a lack in ammonia to reduce NOx.
To the opposite, Cu2.8/FER sample presented an expanded operating temperature window, with
around 90–95% of NOx conversion from 300 to 500 °C. The maximum outlet N2O concentration was
recorded at 500 °C, at 1.5 and 5 ppm for Cu2.8/FER and Cu6.1/FER, respectively.
Compared with the Standard-SCR condition, higher NOx conversions were observed at low
temperature (200 °C) in Fast-SCR condition (Figure 1B), especially taking into account that the implemented catalyst weight was divided by more than 3. Again, a decrease in NOx conversion was
denoted at temperature higher than 350–400 °C, especially for Cu6.1/FER samples, attributed to the
ammonia oxidation reaction. The maximum outlet N2O concentration (500 °C) was then a little
increased, at 4 and 7 ppm for Cu2.8/FER and Cu6.1/FER, respectively.
Standard-SCR and Fast-SCR catalytic tests were also performed on the Cu/FER zeolite containing various sodium loadings. Preliminary tests were performed with catalysts submitted to the impregnation procedures in water or ethanol, but without sodium salt. Results (not shown) indicated no change in the catalytic behavior.
In order to illustrate the influence of both sodium content and sodium impregnation solvent (water or ethanol) on the deNOx efficiency of both Cu2.8/FER and Cu6.1/FER catalysts, two
representative temperatures were selected: 250 °C was chosen to compare the deNOx behaviors at
“low” temperature, while 500 °C was selected for the “high” temperature comparisons. Figure 2 compares the loss of the NOx conversion (expressed as a percentage of loss compared with the Na
free samples) at “low” and “high” selected temperatures, depending on the sodium content (water and ethanol solvents are presented in blue and red lines, respectively). Note that the N2O outlet
concentration was not affected by sodium additions.
,
Catalysts 2018, 8, 3 4 of 19
Na in water. This first result already predicts an effect of the sodium solvent toward physico-chemical properties of the materials. The specific surface areas for the higher Na amounts decreased to 240– 250 m2 g−1 (Table 1).
2.2. Catalytic Activity
NOx conversions obtained over stabilized Cu2.8/FER and Cu6.1/FER samples (without sodium)
are reported in Figure 1 for the Standard-SCR and Fast-SCR conditions. Please remind that the catalytic tests in Fast-SCR condition were performed with lower amount of catalyst (15 mg versus 50 mg for the Standard-SCR condition) to limit the deNOx efficiency and to possibly distinguish a
deactivation by sodium addition.
Figure 1. NOx conversion by NH3 over Cu/FER-exchanged zeolite. (A) standard-SCR; (B) Fast-SCR.
(—, ): Cu2.8/FER; (—, ): Cu6.1/FER.
In Standard-SCR condition (Figure 1A), the best activity at low temperature was achieved by the Cu6.1/FER catalyst with a full NOx conversion at around 300 °C. However, the NOx conversion showed
a net drop in the 350–500 °C temperature range. It is assigned to a competition between the NOx
reduction reaction and the ammonia oxidation reaction, leading to a lack in ammonia to reduce NOx.
To the opposite, Cu2.8/FER sample presented an expanded operating temperature window, with
around 90–95% of NOx conversion from 300 to 500 °C. The maximum outlet N2O concentration was
recorded at 500 °C, at 1.5 and 5 ppm for Cu2.8/FER and Cu6.1/FER, respectively.
Compared with the Standard-SCR condition, higher NOx conversions were observed at low
temperature (200 °C) in Fast-SCR condition (Figure 1B), especially taking into account that the implemented catalyst weight was divided by more than 3. Again, a decrease in NOx conversion was
denoted at temperature higher than 350–400 °C, especially for Cu6.1/FER samples, attributed to the
ammonia oxidation reaction. The maximum outlet N2O concentration (500 °C) was then a little
increased, at 4 and 7 ppm for Cu2.8/FER and Cu6.1/FER, respectively.
Standard-SCR and Fast-SCR catalytic tests were also performed on the Cu/FER zeolite containing various sodium loadings. Preliminary tests were performed with catalysts submitted to the impregnation procedures in water or ethanol, but without sodium salt. Results (not shown) indicated no change in the catalytic behavior.
In order to illustrate the influence of both sodium content and sodium impregnation solvent (water or ethanol) on the deNOx efficiency of both Cu2.8/FER and Cu6.1/FER catalysts, two
representative temperatures were selected: 250 °C was chosen to compare the deNOx behaviors at
“low” temperature, while 500 °C was selected for the “high” temperature comparisons. Figure 2 compares the loss of the NOx conversion (expressed as a percentage of loss compared with the Na
free samples) at “low” and “high” selected temperatures, depending on the sodium content (water and ethanol solvents are presented in blue and red lines, respectively). Note that the N2O outlet
concentration was not affected by sodium additions.
): Cu2.8/FER; (
Catalysts 2018, 8, 3 4 of 19
Na in water. This first result already predicts an effect of the sodium solvent toward physico-chemical properties of the materials. The specific surface areas for the higher Na amounts decreased to 240– 250 m2 g−1 (Table 1).
2.2. Catalytic Activity
NOx conversions obtained over stabilized Cu2.8/FER and Cu6.1/FER samples (without sodium)
are reported in Figure 1 for the Standard-SCR and Fast-SCR conditions. Please remind that the catalytic tests in Fast-SCR condition were performed with lower amount of catalyst (15 mg versus 50 mg for the Standard-SCR condition) to limit the deNOx efficiency and to possibly distinguish a
deactivation by sodium addition.
Figure 1. NOx conversion by NH3 over Cu/FER-exchanged zeolite. (A) standard-SCR; (B) Fast-SCR.
(—, ): Cu2.8/FER; (—, ): Cu6.1/FER.
In Standard-SCR condition (Figure 1A), the best activity at low temperature was achieved by the Cu6.1/FER catalyst with a full NOx conversion at around 300 °C. However, the NOx conversion showed
a net drop in the 350–500 °C temperature range. It is assigned to a competition between the NOx
reduction reaction and the ammonia oxidation reaction, leading to a lack in ammonia to reduce NOx.
To the opposite, Cu2.8/FER sample presented an expanded operating temperature window, with
around 90–95% of NOx conversion from 300 to 500 °C. The maximum outlet N2O concentration was
recorded at 500 °C, at 1.5 and 5 ppm for Cu2.8/FER and Cu6.1/FER, respectively.
Compared with the Standard-SCR condition, higher NOx conversions were observed at low
temperature (200 °C) in Fast-SCR condition (Figure 1B), especially taking into account that the implemented catalyst weight was divided by more than 3. Again, a decrease in NOx conversion was
denoted at temperature higher than 350–400 °C, especially for Cu6.1/FER samples, attributed to the
ammonia oxidation reaction. The maximum outlet N2O concentration (500 °C) was then a little
increased, at 4 and 7 ppm for Cu2.8/FER and Cu6.1/FER, respectively.
Standard-SCR and Fast-SCR catalytic tests were also performed on the Cu/FER zeolite containing various sodium loadings. Preliminary tests were performed with catalysts submitted to the impregnation procedures in water or ethanol, but without sodium salt. Results (not shown) indicated no change in the catalytic behavior.
In order to illustrate the influence of both sodium content and sodium impregnation solvent (water or ethanol) on the deNOx efficiency of both Cu2.8/FER and Cu6.1/FER catalysts, two
representative temperatures were selected: 250 °C was chosen to compare the deNOx behaviors at
“low” temperature, while 500 °C was selected for the “high” temperature comparisons. Figure 2 compares the loss of the NOx conversion (expressed as a percentage of loss compared with the Na
free samples) at “low” and “high” selected temperatures, depending on the sodium content (water and ethanol solvents are presented in blue and red lines, respectively). Note that the N2O outlet
concentration was not affected by sodium additions.
,
Catalysts 2018, 8, 3 4 of 19
Na in water. This first result already predicts an effect of the sodium solvent toward physico-chemical properties of the materials. The specific surface areas for the higher Na amounts decreased to 240– 250 m2 g−1 (Table 1).
2.2. Catalytic Activity
NOx conversions obtained over stabilized Cu2.8/FER and Cu6.1/FER samples (without sodium)
are reported in Figure 1 for the Standard-SCR and Fast-SCR conditions. Please remind that the catalytic tests in Fast-SCR condition were performed with lower amount of catalyst (15 mg versus 50 mg for the Standard-SCR condition) to limit the deNOx efficiency and to possibly distinguish a
deactivation by sodium addition.
Figure 1. NOx conversion by NH3 over Cu/FER-exchanged zeolite. (A) standard-SCR; (B) Fast-SCR.
(—, ): Cu2.8/FER; (—, ): Cu6.1/FER.
In Standard-SCR condition (Figure 1A), the best activity at low temperature was achieved by the Cu6.1/FER catalyst with a full NOx conversion at around 300 °C. However, the NOx conversion showed
a net drop in the 350–500 °C temperature range. It is assigned to a competition between the NOx
reduction reaction and the ammonia oxidation reaction, leading to a lack in ammonia to reduce NOx.
To the opposite, Cu2.8/FER sample presented an expanded operating temperature window, with
around 90–95% of NOx conversion from 300 to 500 °C. The maximum outlet N2O concentration was
recorded at 500 °C, at 1.5 and 5 ppm for Cu2.8/FER and Cu6.1/FER, respectively.
Compared with the Standard-SCR condition, higher NOx conversions were observed at low
temperature (200 °C) in Fast-SCR condition (Figure 1B), especially taking into account that the implemented catalyst weight was divided by more than 3. Again, a decrease in NOx conversion was
denoted at temperature higher than 350–400 °C, especially for Cu6.1/FER samples, attributed to the
ammonia oxidation reaction. The maximum outlet N2O concentration (500 °C) was then a little
increased, at 4 and 7 ppm for Cu2.8/FER and Cu6.1/FER, respectively.
Standard-SCR and Fast-SCR catalytic tests were also performed on the Cu/FER zeolite containing various sodium loadings. Preliminary tests were performed with catalysts submitted to the impregnation procedures in water or ethanol, but without sodium salt. Results (not shown) indicated no change in the catalytic behavior.
In order to illustrate the influence of both sodium content and sodium impregnation solvent (water or ethanol) on the deNOx efficiency of both Cu2.8/FER and Cu6.1/FER catalysts, two
representative temperatures were selected: 250 °C was chosen to compare the deNOx behaviors at
“low” temperature, while 500 °C was selected for the “high” temperature comparisons. Figure 2 compares the loss of the NOx conversion (expressed as a percentage of loss compared with the Na
free samples) at “low” and “high” selected temperatures, depending on the sodium content (water and ethanol solvents are presented in blue and red lines, respectively). Note that the N2O outlet
concentration was not affected by sodium additions.
): Cu6.1/FER.
In Standard-SCR condition (Figure1A), the best activity at low temperature was achieved by
the Cu6.1/FER catalyst with a full NOxconversion at around 300◦C. However, the NOxconversion
showed a net drop in the 350–500◦C temperature range. It is assigned to a competition between the
NOxreduction reaction and the ammonia oxidation reaction, leading to a lack in ammonia to reduce
NOx. To the opposite, Cu2.8/FER sample presented an expanded operating temperature window,
with around 90–95% of NOxconversion from 300 to 500◦C. The maximum outlet N2O concentration
was recorded at 500◦C, at 1.5 and 5 ppm for Cu2.8/FER and Cu6.1/FER, respectively.
Compared with the Standard-SCR condition, higher NOxconversions were observed at low
temperature (200 ◦C) in Fast-SCR condition (Figure 1B), especially taking into account that the
implemented catalyst weight was divided by more than 3. Again, a decrease in NOxconversion
was denoted at temperature higher than 350–400◦C, especially for Cu6.1/FER samples, attributed to
the ammonia oxidation reaction. The maximum outlet N2O concentration (500◦C) was then a little
increased, at 4 and 7 ppm for Cu2.8/FER and Cu6.1/FER, respectively.
Standard-SCR and Fast-SCR catalytic tests were also performed on the Cu/FER zeolite containing
various sodium loadings. Preliminary tests were performed with catalysts submitted to the
impregnation procedures in water or ethanol, but without sodium salt. Results (not shown) indicated no change in the catalytic behavior.
In order to illustrate the influence of both sodium content and sodium impregnation solvent (water or ethanol) on the deNOxefficiency of both Cu2.8/FER and Cu6.1/FER catalysts, two representative
Catalysts 2018, 8, 3 5 of 20
while 500◦C was selected for the “high” temperature comparisons. Figure2compares the loss of
the NOxconversion (expressed as a percentage of loss compared with the Na free samples) at “low”
and “high” selected temperatures, depending on the sodium content (water and ethanol solvents are presented in blue and red lines, respectively). Note that the N2O outlet concentration was not affected
by sodium additions.Catalysts 2018, 8, 3 5 of 19
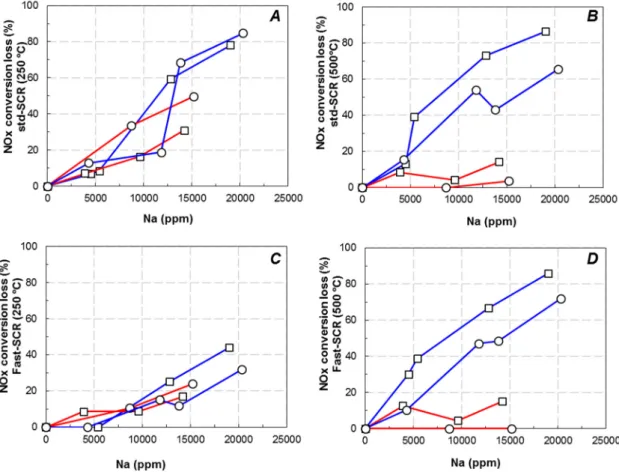
Figure 2. NOx conversion loss in function of the sodium loading on Cu/FER zeolites in standard (A,B)
and Fast‐SCR (C,D) at 250 °C (A,C) and 500 °C (B,D). : Cu2.8/FER; : Cu6.1/FER. (Na impregnation
in water: blue line; sodium impregnation in ethanol: red line). It appears that the NOx conversion was strongly affected by the sodium loading. However, the deactivation acted differently depending on both the Na solvent (i.e., water or ethanol) and the SCR inlet condition (Standard or Fast‐SCR experiments). In Standard‐SCR condition, when sodium was impregnated on Cu6.1/FER via the water pathway (blue line), the deactivation at 250 °C (Figure 2A) appeared rather limited until 12,500 ppm of Na content, with a loss of NOx conversion of 20%. Beyond, the deNOx efficiency rapidly dropped to
achieve deactivation over 80% for the higher Na content (around 2% of Na deposit). Interestingly, Na deposition using ethanol as solvent (red line) led to different observations. For approximately the same Na content (15,000 ppm), the loss in NOx conversion was around 50% when sodium was
impregnated in ethanol versus 70% when sodium was impregnated in water.
Over Cu2.8/FER, same trends were obtained: the most pronounced decrease was observed for
sodium impregnation in water (blue line). However, for this catalyst with the low copper loading, the influence of the sodium solvent appeared a little less marked than for Cu6.1/FER.
Finally, for Na contents higher than 14,200 ppm impregnated in water, similar NOx conversions
were observed in Standard‐SCR condition whatever the catalyst (i.e., Cu6.1/FER or Cu2.8/FER). This
suggests that beyond a threshold value of Na deposit, both catalysts tend to exhibit similar remaining active sites.
At high temperature, it was previously described that the competitive reaction between ammonia oxidation and NOx reduction was enhanced over the most loaded copper catalyst
(Cu6.1/FER). Nevertheless, Figure 2B clearly shows that at 500 °C, for both studied copper loading,
sodium impregnation in ethanol (red lines) had few impact on the NOx conversion up to 14,200 ppm
Na content. On the opposite, strong deactivations were denoted when Na was impregnated in water (blue line). The NOx conversion loss for approximately 2% Na then reached 65% and 86% for
Cu6.1/FER and Cu2.8/FER, respectively.
Figure 2.NOxconversion loss in function of the sodium loading on Cu/FER zeolites in standard (A,B) and Fast-SCR (C,D) at 250◦C (A,C) and 500◦C (B,D).
Catalysts 2018, 8, 3 4 of 19
Na in water. This first result already predicts an effect of the sodium solvent toward physico-chemical properties of the materials. The specific surface areas for the higher Na amounts decreased to 240– 250 m2 g−1 (Table 1).
2.2. Catalytic Activity
NOx conversions obtained over stabilized Cu2.8/FER and Cu6.1/FER samples (without sodium)
are reported in Figure 1 for the Standard-SCR and Fast-SCR conditions. Please remind that the catalytic tests in Fast-SCR condition were performed with lower amount of catalyst (15 mg versus 50 mg for the Standard-SCR condition) to limit the deNOx efficiency and to possibly distinguish a
deactivation by sodium addition.
Figure 1. NOx conversion by NH3 over Cu/FER-exchanged zeolite. (A) standard-SCR; (B) Fast-SCR.
(—, ): Cu2.8/FER; (—, ): Cu6.1/FER.
In Standard-SCR condition (Figure 1A), the best activity at low temperature was achieved by the Cu6.1/FER catalyst with a full NOx conversion at around 300 °C. However, the NOx conversion showed
a net drop in the 350–500 °C temperature range. It is assigned to a competition between the NOx
reduction reaction and the ammonia oxidation reaction, leading to a lack in ammonia to reduce NOx.
To the opposite, Cu2.8/FER sample presented an expanded operating temperature window, with
around 90–95% of NOx conversion from 300 to 500 °C. The maximum outlet N2O concentration was
recorded at 500 °C, at 1.5 and 5 ppm for Cu2.8/FER and Cu6.1/FER, respectively.
Compared with the Standard-SCR condition, higher NOx conversions were observed at low
temperature (200 °C) in Fast-SCR condition (Figure 1B), especially taking into account that the implemented catalyst weight was divided by more than 3. Again, a decrease in NOx conversion was
denoted at temperature higher than 350–400 °C, especially for Cu6.1/FER samples, attributed to the
ammonia oxidation reaction. The maximum outlet N2O concentration (500 °C) was then a little
increased, at 4 and 7 ppm for Cu2.8/FER and Cu6.1/FER, respectively.
Standard-SCR and Fast-SCR catalytic tests were also performed on the Cu/FER zeolite containing various sodium loadings. Preliminary tests were performed with catalysts submitted to the impregnation procedures in water or ethanol, but without sodium salt. Results (not shown) indicated no change in the catalytic behavior.
In order to illustrate the influence of both sodium content and sodium impregnation solvent (water or ethanol) on the deNOx efficiency of both Cu2.8/FER and Cu6.1/FER catalysts, two
representative temperatures were selected: 250 °C was chosen to compare the deNOx behaviors at
“low” temperature, while 500 °C was selected for the “high” temperature comparisons. Figure 2 compares the loss of the NOx conversion (expressed as a percentage of loss compared with the Na
free samples) at “low” and “high” selected temperatures, depending on the sodium content (water and ethanol solvents are presented in blue and red lines, respectively). Note that the N2O outlet
concentration was not affected by sodium additions.
: Cu2.8/FER;
Catalysts 2018, 8, 3 4 of 19
Na in water. This first result already predicts an effect of the sodium solvent toward physico-chemical properties of the materials. The specific surface areas for the higher Na amounts decreased to 240– 250 m2 g−1 (Table 1).
2.2. Catalytic Activity
NOx conversions obtained over stabilized Cu2.8/FER and Cu6.1/FER samples (without sodium)
are reported in Figure 1 for the Standard-SCR and Fast-SCR conditions. Please remind that the catalytic tests in Fast-SCR condition were performed with lower amount of catalyst (15 mg versus 50 mg for the Standard-SCR condition) to limit the deNOx efficiency and to possibly distinguish a
deactivation by sodium addition.
Figure 1. NOx conversion by NH3 over Cu/FER-exchanged zeolite. (A) standard-SCR; (B) Fast-SCR.
(—, ): Cu2.8/FER; (—, ): Cu6.1/FER.
In Standard-SCR condition (Figure 1A), the best activity at low temperature was achieved by the Cu6.1/FER catalyst with a full NOx conversion at around 300 °C. However, the NOx conversion showed
a net drop in the 350–500 °C temperature range. It is assigned to a competition between the NOx
reduction reaction and the ammonia oxidation reaction, leading to a lack in ammonia to reduce NOx.
To the opposite, Cu2.8/FER sample presented an expanded operating temperature window, with
around 90–95% of NOx conversion from 300 to 500 °C. The maximum outlet N2O concentration was
recorded at 500 °C, at 1.5 and 5 ppm for Cu2.8/FER and Cu6.1/FER, respectively.
Compared with the Standard-SCR condition, higher NOx conversions were observed at low
temperature (200 °C) in Fast-SCR condition (Figure 1B), especially taking into account that the implemented catalyst weight was divided by more than 3. Again, a decrease in NOx conversion was
denoted at temperature higher than 350–400 °C, especially for Cu6.1/FER samples, attributed to the
ammonia oxidation reaction. The maximum outlet N2O concentration (500 °C) was then a little
increased, at 4 and 7 ppm for Cu2.8/FER and Cu6.1/FER, respectively.
Standard-SCR and Fast-SCR catalytic tests were also performed on the Cu/FER zeolite containing various sodium loadings. Preliminary tests were performed with catalysts submitted to the impregnation procedures in water or ethanol, but without sodium salt. Results (not shown) indicated no change in the catalytic behavior.
In order to illustrate the influence of both sodium content and sodium impregnation solvent (water or ethanol) on the deNOx efficiency of both Cu2.8/FER and Cu6.1/FER catalysts, two
representative temperatures were selected: 250 °C was chosen to compare the deNOx behaviors at
“low” temperature, while 500 °C was selected for the “high” temperature comparisons. Figure 2 compares the loss of the NOx conversion (expressed as a percentage of loss compared with the Na
free samples) at “low” and “high” selected temperatures, depending on the sodium content (water and ethanol solvents are presented in blue and red lines, respectively). Note that the N2O outlet
concentration was not affected by sodium additions.
: Cu6.1/FER. (Na impregnation in water: blue line; sodium impregnation in ethanol: red line).
It appears that the NOx conversion was strongly affected by the sodium loading. However,
the deactivation acted differently depending on both the Na solvent (i.e., water or ethanol) and the SCR inlet condition (Standard or Fast-SCR experiments).
In Standard-SCR condition, when sodium was impregnated on Cu6.1/FER via the water pathway
(blue line), the deactivation at 250◦C (Figure2A) appeared rather limited until 12,500 ppm of Na
content, with a loss of NOxconversion of 20%. Beyond, the deNOxefficiency rapidly dropped to
achieve deactivation over 80% for the higher Na content (around 2% of Na deposit). Interestingly, Na deposition using ethanol as solvent (red line) led to different observations. For approximately
the same Na content (15,000 ppm), the loss in NOxconversion was around 50% when sodium was
impregnated in ethanol versus 70% when sodium was impregnated in water.
Over Cu2.8/FER, same trends were obtained: the most pronounced decrease was observed for
sodium impregnation in water (blue line). However, for this catalyst with the low copper loading, the influence of the sodium solvent appeared a little less marked than for Cu6.1/FER.
Finally, for Na contents higher than 14,200 ppm impregnated in water, similar NOxconversions
This suggests that beyond a threshold value of Na deposit, both catalysts tend to exhibit similar remaining active sites.
At high temperature, it was previously described that the competitive reaction between ammonia
oxidation and NOx reduction was enhanced over the most loaded copper catalyst (Cu6.1/FER).
Nevertheless, Figure 2B clearly shows that at 500 ◦C, for both studied copper loading, sodium
impregnation in ethanol (red lines) had few impact on the NOxconversion up to 14,200 ppm Na content.
On the opposite, strong deactivations were denoted when Na was impregnated in water (blue line).
The NOxconversion loss for approximately 2% Na then reached 65% and 86% for Cu6.1/FER and
Cu2.8/FER, respectively.
In Fast-SCR condition, no influence of Na deposits on the NO2availability (from NO oxidation
into NO2) is expected since the optimal inlet NO2/NOx ratio is already fixed to 0.5. Only other
parameters should be involved in the deactivation mechanism. In fact, Figure2C reports that the NOx
conversion at 250◦C was decreased with similar tendencies with sodium contents, whatever the Na
impregnation route (water or ethanol) and regardless the copper loading (Cu2.8/FER or Cu6.1/FER).
The decrease rate appeared less marked than in Standard-SCR condition.
At 500 ◦C (Figure 2D), similar behaviors to those denoted in Figure 2B (Standard-SCR)
are observed: the ethanol impregnation solvent did not induce a strong deactivation of the
catalysts whereas impregnation with water induced the same NOx conversion loss than in
Standard-SCR condition.
Finally, for the two studied catalysts with different copper loadings, the sodium impregnation in water strongly impacted the catalytic activity compare with the impregnation in ethanol. Moreover, when Na was added in water, almost the same catalytic activities were reached for the highest sodium loadings for both catalysts with different copper contents, whereas the initial catalytic activities were different. Considering the needed functions for the NH3-SCR activity, the decrease in activity of the
catalysts could be attributed to alteration of the redox properties and/or to a poisoning of the acidic sites. Results described in this section, indicate that sodium addition in water or ethanol did not led to the same effects on the catalysts behaviors. Consequently, dedicated characterizations were performed to gain information about the Na poisoning and the influence of the Na impregnation solvent. 2.3. Redox Properties and Copper Characterization
In this section, the influence of the sodium impregnation solvent was examined through redox
properties of Cu2.8/FER and Cu6.1/FER catalysts. Both NH3 and NO oxidation catalytic tests
and H2-TPR experiments were carried out. Additionally, NO adsorption monitored by infrared
spectroscopy was also performed to assess to the copper state.
2.3.1. NH3and NO Oxidation
As described in the previous section, the oxidation performances of Cu2.8/FER and Cu6.1/FER are
suspected to be differently affected by the sodium loading and impregnation solvent. Catalytic
oxidation of NH3 and NO experiments were then performed over all the studied samples.
The ammonia oxidation by oxygen is not expected since it induces an undesired reductant consumption, but it also accounts for ammonia activation. NO oxidation is mainly involved in Standard-SCR
condition to promote the Fast-SCR stoichiometry. Experiments were performed from 300◦C up to
500◦C for ammonia oxidation and from 350◦C up to 500◦C for NO oxidation, but only data recorded at 450◦C are reported in Figure3as representative results.
Catalysts 2018, 8, 3 7 of 20 Catalysts 2018, 8, 3 7 of 19
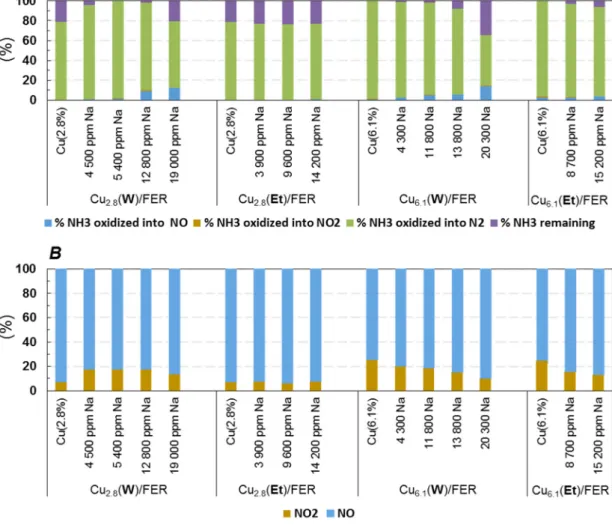
Figure 3. Effect of Na loading on NH3 (A) and NO (B) oxidation activities at 450 °C over Cu2.8/FER
and Cu6.1/FER, depending on the Na loading impregnated in water (W) or ethanol (Et). The NO oxidation rates recorded at 450 °C depending on the sodium loading are depicted Figure 3B. Whatever the test, the NO oxidation rate remained low, with a maximum of 30% recorded with sodium free Cu6.1/FER. Indeed, as expected, the highest NO oxidation activities were observed for the highest loaded copper catalyst [18,19]. With the sodium free Cu2.8/FER sample, the NO oxidation rate was limited at 7%. Addition of sodium by impregnation in water led first to an improvement of the NO oxidation rate, until 18% for 5400 ppm Na, but the rate then decreased down to 14% for approximately 2% Na. On the contrary, no influence of the Na content was observed when the alkali element was added by impregnation in ethanol. Results differed on Cu6.1/FER catalyst: Na addition
led to a similar decrease in the oxidation behavior whatever the impregnation solvent. Note that the same tendencies were observed at lower temperatures (data not shown). Finally, the sodium impregnation in water or ethanol resulted in similar trends than those observed for NH3 oxidation. Especially, the redox function appeared not affected on the Cu2.8/FER sample when Na was added in ethanol. Concerning the general influence of Na addition in water, in copper‐exchanged zeolite, various assumption can be advanced to explain why NH3 and NO oxidation properties were enhanced over Cu2.8/FER, whereas opposite results emerged over higher copper content material (Cu6.1/FER). Indeed,
the increase in NO oxidation behavior of copper‐exchanged zeolite is commonly attributed to the formation of bulk copper (CuO), whether by thermal aging or copper loading increase [18,19].
In fact, when sodium was added by impregnation in water, the XRD patterns pointed out the appearance of CuO for Cu2.8/FER while the intensity of the CuO peaks significantly increased for
Cu6.1/FER. On the contrary, no evolution of the XRD patterns was observed when sodium was added
Figure 3.Effect of Na loading on NH3(A) and NO (B) oxidation activities at 450◦C over Cu2.8/FER and Cu6.1/FER, depending on the Na loading impregnated in water (W) or ethanol (Et).
With sodium free samples, full ammonia oxidation was observed with the highest loaded copper catalyst (Cu6.1/FER, Figure3A). The ammonia oxidation then appeared fully selective in N2since
neither NOxnor N2O were recorded (detection limits close to 1 ppm for these N-products). To the
opposite, 78% of NH3was converted over Cu2.8/FER sample. These results are in accordance with
SCR tests presented Figure1which illustrate that the competitive reactivity between NH3oxidation
by O2and NOxreduction by NH3at high temperature is more significant over the Cu6.1/FER catalyst.
Both NH3oxidation activity and selectivity were impacted by Na poisoning. Concerning the Cu2.8/FER
catalyst, Na deposits in water (Cu2.8(W)/FER) firstly enhanced the NH3conversion into N2. Increasing
the sodium content at 12,800 ppm led to NO formation which was also associated with a decrease
in the NH3 conversion, especially for 19,000 ppm Na. To the opposite, sodium impregnation in
ethanol (Cu2.8(Et)/FER) did not alter the oxidation of NH3by O2. For Cu6.1/FER sample, both Na
impregnations in water or ethanol led to a deactivation of the catalyst, but in a less extent with ethanol, as illustrated in Figure3A. Interestingly, at 450◦C, the deactivation of NH3oxidation properties was
again associated with the formation of oxidized compounds, mainly NO (no N2O was recorded).
NO was emitted in a lower extent at 400◦C, but similar evolutions of the ammonia conversion were
observed depending on the Na loading, as illustrated in Figure S5 (Supplementary Materials).
The NO oxidation rates recorded at 450◦C depending on the sodium loading are depicted
Figure3B. Whatever the test, the NO oxidation rate remained low, with a maximum of 30% recorded
the highest loaded copper catalyst [18,19]. With the sodium free Cu2.8/FER sample, the NO oxidation
rate was limited at 7%. Addition of sodium by impregnation in water led first to an improvement of the NO oxidation rate, until 18% for 5400 ppm Na, but the rate then decreased down to 14% for approximately 2% Na. On the contrary, no influence of the Na content was observed when the alkali element was added by impregnation in ethanol. Results differed on Cu6.1/FER catalyst: Na addition
led to a similar decrease in the oxidation behavior whatever the impregnation solvent. Note that the same tendencies were observed at lower temperatures (data not shown). Finally, the sodium
impregnation in water or ethanol resulted in similar trends than those observed for NH3oxidation.
Especially, the redox function appeared not affected on the Cu2.8/FER sample when Na was added
in ethanol.
Concerning the general influence of Na addition in water, in copper-exchanged zeolite, various
assumption can be advanced to explain why NH3 and NO oxidation properties were enhanced
over Cu2.8/FER, whereas opposite results emerged over higher copper content material (Cu6.1/FER).
Indeed, the increase in NO oxidation behavior of copper-exchanged zeolite is commonly attributed to the formation of bulk copper (CuO), whether by thermal aging or copper loading increase [18,19].
In fact, when sodium was added by impregnation in water, the XRD patterns pointed out the
appearance of CuO for Cu2.8/FER while the intensity of the CuO peaks significantly increased for
Cu6.1/FER. On the contrary, no evolution of the XRD patterns was observed when sodium was
added in ethanol. Consequently, the increase in oxidation properties after Na addition in water over
Cu2.8/FER could be attributed to the formation of CuO while the observed decrease in oxidation
behavior for Cu6.1/FER could be attributed to CuO sintering. A copper migration from exchange
location to extra-framework, leading to CuO formation can be then suspected. After impregnation in ethanol, only copper sintering of extra-framework copper species can be postulated (after Na addition, samples were hydrothermally aged at 700◦C for 16 h).
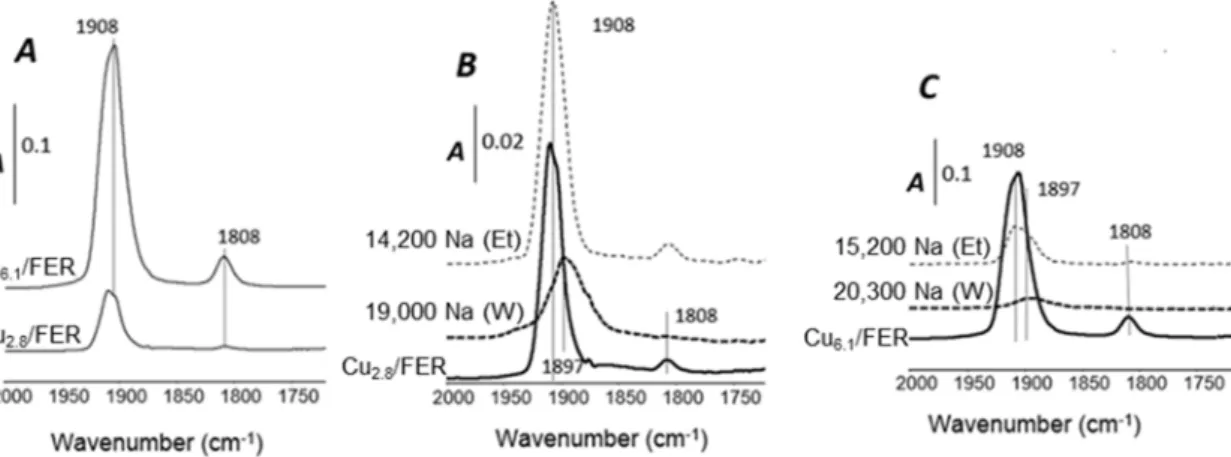
In order to gain more information about of the sodium poisoning effects toward the copper state,
especially depending on the Na solvent, samples were thereafter characterized by H2-TPR and NO
adsorption monitored by FT-IR.
2.3.2. Temperature Programmed Reduction by Hydrogen (H2-TPR)
Generally, for copper-exchanged-based zeolites, two reductions peaks are expected. The first one is attributed to the reduction of Cu2+species to Cu+and the second one at higher temperature corresponds to the reduction of Cu+to Cu0[20]. However, for some zeolites, such as Cu/Faujasite (FAU), two H2consumption peaks related to the reduction of Cu2+to Cu+can be detected, depending
of the location of the copper in the zeolite [21]. In case of extra-framework copper, the direct reduction of CuO species into metallic copper can be observed in the 200–400◦C temperature range [20,22]. In addition, coper aluminate species (CuAl2O4) may be formed if traces of extra-framework aluminum
(EFAL) remains in the zeolite samples, due for instance to dealumination caused by hydrothermal treatments. CuAl2O4reduction by H2should then occurs around 500◦C [23]. Besides, it was reported
that the reduction temperature of exchanged copper species are depending on the zeolite Si/Al ratio, with a decrease in the reduction peak temperature with the increase of the Si/Al ratio [24]. Moreover, the temperatures of copper reduction also decrease with the increase the sodium content as cocation [20,24].
Obviously, no reduction peak was observed for the host Ferrierite zeolite (results not shown).
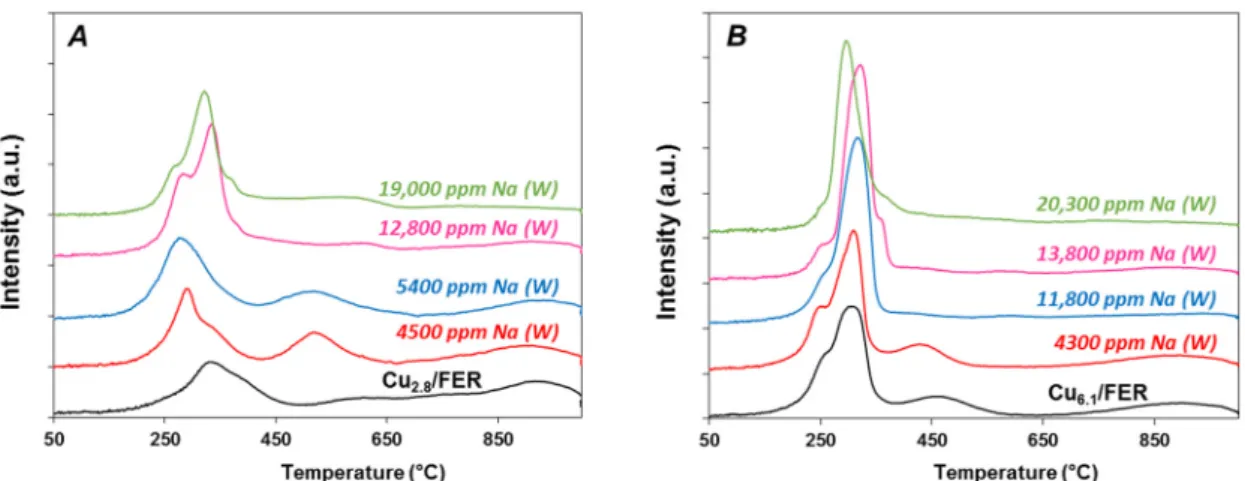
Figure4reports the TPR profiles of Cu2.8/FER and Cu6.1/FER TPR samples depending on the Na
loading for Na addition performed in water. For all catalysts, the measured H2/Cu ratio based on
hydrogen consumption until 1000◦C was always very close to 1 (Table1). It indicates a total Cu2+to Cu0reduction, whatever the copper and sodium loadings. Consequently, there is neither evidence of
copper stabilization in CuIstate nor reduction of other species than Cu2+, such as carbonates associated with Na addition for instance.
Catalysts 2018, 8, 3 9 of 20 Catalysts 2018, 8, 3 8 of 19
in ethanol. Consequently, the increase in oxidation properties after Na addition in water over Cu2.8/FER could be attributed to the formation of CuO while the observed decrease in oxidation
behavior for Cu6.1/FER could be attributed to CuO sintering. A copper migration from exchange
location to extra‐framework, leading to CuO formation can be then suspected. After impregnation in ethanol, only copper sintering of extra‐framework copper species can be postulated (after Na addition, samples were hydrothermally aged at 700 °C for 16 h).
In order to gain more information about of the sodium poisoning effects toward the copper state, especially depending on the Na solvent, samples were thereafter characterized by H2‐TPR and NO
adsorption monitored by FT‐IR.
2.3.2. Temperature Programmed Reduction by Hydrogen (H2‐TPR)
Generally, for copper‐exchanged‐based zeolites, two reductions peaks are expected. The first one is attributed to the reduction of Cu2+ species to Cu+ and the second one at higher temperature
corresponds to the reduction of Cu+ to Cu0 [20]. However, for some zeolites, such as Cu/Faujasite
(FAU), two H2 consumption peaks related to the reduction of Cu2+ to Cu+ can be detected, depending
of the location of the copper in the zeolite [21]. In case of extra‐framework copper, the direct reduction of CuO species into metallic copper can be observed in the 200–400 °C temperature range [20,22]. In addition, coper aluminate species (CuAl2O4) may be formed if traces of extra‐framework aluminum
(EFAL) remains in the zeolite samples, due for instance to dealumination caused by hydrothermal treatments. CuAl2O4 reduction by H2 should then occurs around 500 °C [23]. Besides, it was reported
that the reduction temperature of exchanged copper species are depending on the zeolite Si/Al ratio, with a decrease in the reduction peak temperature with the increase of the Si/Al ratio [24]. Moreover, the temperatures of copper reduction also decrease with the increase the sodium content as cocation [20,24].
Obviously, no reduction peak was observed for the host Ferrierite zeolite (results not shown). Figure 4 reports the TPR profiles of Cu2.8/FER and Cu6.1/FER TPR samples depending on the Na
loading for Na addition performed in water. For all catalysts, the measured H2/Cu ratio based on
hydrogen consumption until 1000 °C was always very close to 1 (Table 1). It indicates a total Cu2+ to
Cu0 reduction, whatever the copper and sodium loadings. Consequently, there is neither evidence of
copper stabilization in CuI state nor reduction of other species than Cu2+, such as carbonates
associated with Na addition for instance.
Figure 4. H2‐TPR profiles: Effect of Na loading impregnated in water (W) on (A) copper‐exchanged
zeolite Cu2.8/FER and (B) on over‐exchanged zeolite Cu6.1/FER.
The Cu2.8/FER reduction profile (Figure 4A) presents two main reduction peaks centered at
330 °C and 950 °C, and a broad reduction peak in the 500–800 °C temperature range. Varying copper loading and calcinations temperature (results not shown), the two main peaks at 330 °C and 950 °C are attributed to the two steps reduction process of exchanged Cu2+ via intermediate formation of Cu+.
The species reduced between 500 °C and 800 °C are assigned to CuAl2O4 (trace of dealumination
Figure 4.H2-TPR profiles: Effect of Na loading impregnated in water (W) on (A) copper-exchanged zeolite Cu2.8/FER and (B) on over-exchanged zeolite Cu6.1/FER.
The Cu2.8/FER reduction profile (Figure4A) presents two main reduction peaks centered at
330◦C and 950◦C, and a broad reduction peak in the 500–800◦C temperature range. Varying copper loading and calcinations temperature (results not shown), the two main peaks at 330◦C and 950◦C
are attributed to the two steps reduction process of exchanged Cu2+via intermediate formation of
Cu+. The species reduced between 500◦C and 800◦C are assigned to CuAl2O4(trace of dealumination
leading to alumina was suggested by IR skeleton T-O-T characterization, Figure S2 in Supplementary
Materials). However, different species of Cu2+ and Cu+ may be also reduced in this temperature
range [23,25].
After addition of 4500 ppm Na by impregnation in water (Cu2.8/FER), the first peak corresponding
to the reduction of exchanged Cu2+to Cu+was shifted to lower temperature, at 290◦C. The reduction
peak assigned to the second-step of Cu+reduction to Cu0is still observed at higher temperature
(T = 950◦C), but the corresponding H2consumption was decreased compared with the sodium free
sample. It became lower than for the reduction peak associated to the first reduction-step. Additionally, reduction peak centered at 520◦C was then well defined in the intermediate temperature range which corresponds to the reduction of CuAl2O4species. Same evolutions were observed with the increase in
the sodium contents, with a continuous decrease in the high temperature peak consumption (950◦C)
in favor of the 250–450◦C region hydrogen consumption. The intermediate reduction peak was more
or less well defined depending on the Na loading.
The Cu6.1/FER sample exhibited TPR profiles with a first reduction-step with two components
(T = 250◦C (shoulder) and 300◦C, Figure4B). Extra-framework copper was expected for these sample since for 100% exchange (Cu/Al = 0.5), the copper loading should be around 4.5 wt. % copper. Then,
the first reduction peak contained Cu2+and CuO reduction. The second peak around 460 ◦C can
be associate with copper aluminate and the last peak at 900◦C corresponds to the second step of
exchanged copper reduction, from Cu+to Cu0. Again, addition of sodium by impregnation in water
led to the disappearance of the high temperature reduction peak while the H2consumption in the
200–300◦C temperature range increased.
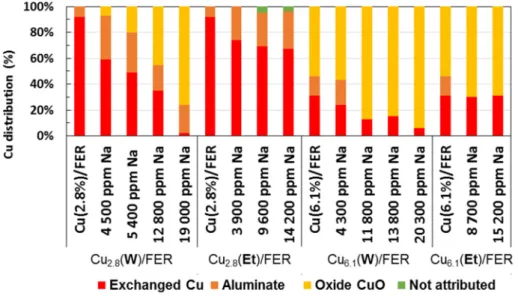
Based on this results and literature data, H2-TPR profiles were deconvoluted to assess to the copper
distribution (Figure S6): the H2consumption related to the peak centered at around 950◦C (attributed
to Cu+in exchanged position) was deduced to the integration of the broad low reduction peak(s).
The remaining H2consumption was attributed to the one step bulk CuO reduction. In accordance with
the XRD characterizations, H2consumptions attributed to CuO species increased with the sodium
loadings. The intermediate temperature range reduction was attributed to copper aluminates reduction.