HAL Id: hal-03007981
https://hal.archives-ouvertes.fr/hal-03007981
Submitted on 1 Dec 2020
HAL is a multi-disciplinary open access
archive for the deposit and dissemination of sci-entific research documents, whether they are pub-lished or not. The documents may come from teaching and research institutions in France or abroad, or from public or private research centers.
L’archive ouverte pluridisciplinaire HAL, est destinée au dépôt et à la diffusion de documents scientifiques de niveau recherche, publiés ou non, émanant des établissements d’enseignement et de recherche français ou étrangers, des laboratoires publics ou privés.
Action spectroscopy of spin forbidden states in the gas
phase: A powerful probe for large non-luminescent
molecules
F Grollau, C Pothier, M Gaveau, M. Briant, Niloufar Shafizadeh, B Soep
To cite this version:
F Grollau, C Pothier, M Gaveau, M. Briant, Niloufar Shafizadeh, et al.. Action spectroscopy of spin forbidden states in the gas phase: A powerful probe for large non-luminescent molecules. Journal of Chemical Physics, American Institute of Physics, 2020, 152 (14), pp.144306. �10.1063/5.0002890�. �hal-03007981�
1
Action spectroscopy of spin forbidden states in the gas phase: a
powerful probe for large non luminescent molecules
F. Grollau a, C. Pothier a, M.A. Gaveau a, M. Briant a, N.Shafizadeh b and B.Soep a *
a-Université Paris-Saclay, CEA, CNRS, Laboratoire Interactions, Dynamiques et Lasers, 91191, Gif-sur-Yvette, France.
b- Université Paris-Saclay, CNRS, Institut des Sciences Moléculaires d'Orsay, 91405, Orsay,
France
*benoit.soep@cea.fr
Abstract
Triplet action spectra of two similar copper porphyrins, copper Tetraphenylporphyrin (CuTPP) and copper Octaethylporphyrin (CuOEP) have been studied in the gas phase at low temperatures in absence of external perturbations by a resonant pump and a 193 nm probe ionizing the 3* orbital localized on the porphyrin cycle. The molecules were prepared by laser desorption in a disk source, then cooled in a helium supersonic expansion and finally excited in the Q band system (S1 ← S0). This type of experiment allows the spectroscopic characterization of large non luminescent molecules in absence of solvent perturbations. The two copper porphyrins exhibit a broad electronic origin Q00 absorption spectrum, partly caused by the short lifetime of the excited (S1)state. The two porphyrins differ strongly with a strong Q00 band for CuOEP and a weak one for CuTPP, in agreement with M. Gouterman’s 4 orbital model. Also, the two molecules exhibit different solvent shifts: CuOEP is blue shifted in non polar solvents owing to its alkyl substituents, while CuTPP is red shifted as for regular transitions to * orbitals. The decay dynamics of the triplet state exhibit a collision free lifetime of 70±7 ns for CuTPP atop a microsecond decay. This non exponential decay can be viewed as an evidence of time evolution of two states combining: the state with spin 1 borne by the porphyrin ring and that by the Cu atom, ½. Therefore, this method allows solvent free spectrodynamics of large molecules in the short microsecond time range.
2
Introduction
Determining the electronic absorption spectra of neutral molecules in the gas phase is essential since spectra characterize uniquely the electronic structure of these molecules in the absence of solvent perturbations. While electronic absorption spectroscopy in large molecules is performed routinely in solutions by direct transmission measurements, the equivalent measurements in solvent free large molecules are difficult since these molecules have to be evaporated intact and in sufficient number density to provide absorption. This was nonetheless achieved in large stable molecules at the expense of spectral broadening due to high temperatures maintaining a sufficient number density1. As an indirect method, fluorescence excitation spectroscopy has been extensively demonstrated for large molecular ions2, 3, however for large neutral molecules it is of limited interest, since generally these molecules have a low fluorescence yield due to fast electronic relaxation. Resonance multiphoton ionization stepping on the electronic or vibrational state investigated, is an interesting solution and can be achieved with short lasers whose time and spectral profiles are adapted to the excited state lifetimes and their spectral diffuseness. Many groups have thus studied short lived states 4-7 of molecules or clusters by resonant two photon ionization, yielding resolved electronic or vibrational spectra in vacuo. Another alternative for the investigation of short lived states is action spectroscopy, where the outcome of a tunable excitation is probed as a function of excitation wavelength, revealing the absorption spectrum. This is often practiced in the spectroscopy of molecular ions where the formation of fragment ions monitors the absorption of the parent during a wavelength scan8. The general difficulty is maintaining a constant branching ratio for this dissociation channel to obtain the unperturbed absorption spectrum. This is achieved by adding a weakly interacting atomic or molecular tag that immediately evaporates after excitation9, yielding a quasi-unit dissociation yield at frequencies away from the 0-0 transition, where 1 photon direct dissociation is energetically forbidden. The resulting spectrum is only weakly shifted,
3
especially in the infrared, due to the tagging. The detection of electronic relaxation to metastable states, generally triplet states in organic molecules, is an interesting alternative, since triplet state formation is quite universal among organic molecules and phosphorescence excitation spectra are often used to characterize spectrally large molecules.10 Also this action spectroscopy does not exclude the origin 0-0 transition.
Here, instead of monitoring the long lived phosphorescence of molecules, we detect the formation of a local triplet state by its selective ionization. This has the advantage of instantly probing the desired electronic state without relying on the phosphorescence emission yield and with a linear intensity dependence with the excitation and ionization lasers. This could be called triplet tagging.
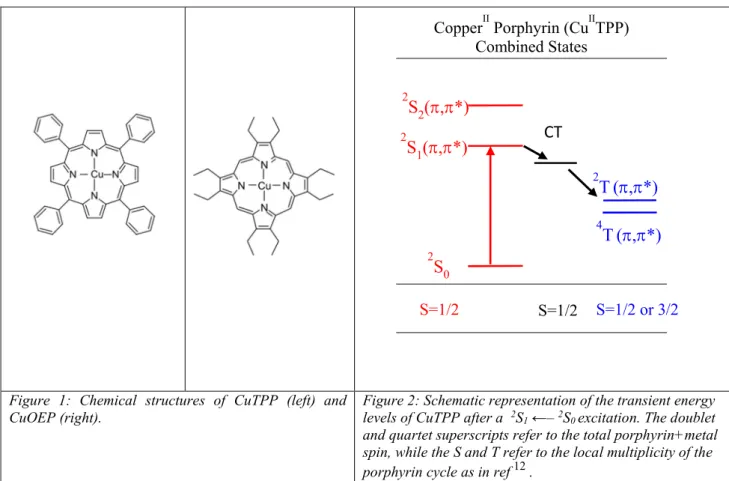
The presence of a transition metal in the porphyrin pocket causes in excited states, an ultrafast electronic relaxation, generally by a charge transfer (CT) process 11. This electronic relaxation flowing electrons through the metal in the CT state leads specifically in copper porphyrins (CuTPP, CuOEP, Figure 1) to a 3* state localized on the porphyrin cycle after the decay of the CT state within picosecond times12,13, an exceptionally short time for intersystem crossing (scheme in Figure 2). This stems from the existence of a spin on the Cu atom (s=1/2) and its coupling with the local electronic spin on the excited porphyrin (s=1) 14. The consideration of
the local spin on the porphyrin ring is essential since the optical absorption of the Cu porphyrin is conditioned by the porphyrin delocalized orbitals, while the electronic dynamics of the porphyrin is powered by the coupling of the porphyrin and the Cu atom. Indeed, fast evolution can occur without change of the total initial spin S=1/2 [Cu(s=1/2); TPP (s=0) ] to the final state S=1/2 [Cu(s=1/2) ; TPP (s=1) ] in copper metalloporphyrins.7 The latter final state is labeled as tripdoublet 2T (T from the local s=1 spin on the porphyrin and doublet from the total spin
S=1/2) 14. Thus, the local spin of the electrons of the cloud of the porphyrin can evolve rapidly
4
This situation applies identically to CuOEP1213, but is in sharp contrast with that of metal free H2TPP where 3* triplet formation occurs within nanoseconds. This slow evolution is due to the need of spin orbit coupling for 1* intersystem crossing 15, 16.
CuTPP, CuOEP have been prepared by laser evaporation in a special source, cooled in a supersonic expansion of helium and excited in their Q band system by a tunable ns laser in the 450-600 nm region. Finally, the excited porphyrin is probed by ionization with an ArF laser at 193 nm. The 6.43 eV photons provided by the ArF laser is at threshold for the ionization of CuTPP (IP =6.49 eV17) and CuOEP in their electronic ground state, while it efficiently ionizes their triplet state. The delay of the ArF laser allows an investigation of the local 3 porphyrin triplet population decay as a function of time on the ns time scale. It yields a solvent free triplet action spectrum at a vibrational temperature of ≈70 K (temperature achieved in the supersonic beam).
Figure 1: Chemical structures of CuTPP (left) and CuOEP (right).
Figure 2: Schematic representation of the transient energy levels of CuTPP after a 2S
1 ←– 2S0 excitation. The doublet and quartet superscripts refer to the total porphyrin+metal spin, while the S and T refer to the local multiplicity of the porphyrin cycle as in ref 12 .
CopperII Porphyrin (CuIITPP) Combined States S=1/2 2 S0 2 S1(,*) 2 S2(,*) 2 T(,*) 4 T(,*) S=1/2 S=1/2 or 3/2 CT
5
Experimental
The source set-up
An improved evaporation source has been used for this experiment, following the original design of Levy and coworkers18. It is constructed from a disk evaporation source associated with a long, 2 cm channel. The latter arrangement has been used mostly for metal ablation and the formation of their dimers or clusters19, 20. The disk source offers a large surface to evaporate thanks to a mechanical asymmetrical rotation system, allowing the complete exploration of its surface, see Figure 3. It ensures a longer average stability of the sample product. The channel design contributes to the mixing and thermalization of the laser-evaporated molecules, before the supersonic expansion. We have used this set-up to evaporate porphyrin molecules and observe their visible spectrum by resonance induced sequential two photon ionization.
The laser evaporation source represented in Figure 3 is very similar in its principle of a rotating - translating disk, to that described in ref 18. The helium gas pulse is created by a solenoid valve with a backing pressure of 2.5 bar (General Valve / Parker) operating at 10 Hz with a Vespel poppet and an opening time of ~170 µs. The valve orifice (0.7 mm) is opened on a channel with a 1 mm diameter and 2 cm long, created just below the surface side of a rectangular block of stainless steel fixed on the pulsed valve. At the end of the cylindrical channel, the gas undergoes supersonic expansion in the source vacuum chamber. An unfocussed 532 nm, frequency doubled Nd:Yag laser (Continuum Minilite) is fired across the gas channel onto the target, a graphite-sample disk (12 mm diameter) placed on the side of the block; this leads to an easy adjustment of this laser.
The disk is pressed from graphite powder (50%) and CuTPP or CuOEP molecules (50%) in a mold under 10 Tons/cm². The assembled disk is gently pressed over the rectangular block surface on its side, as sketched in Figure 3, by a lamellar spring. The ensemble slides on the
6
smooth surface with a rotation translation movement that allows the unfocussed 532 nm laser to scan the whole surface. The mechanical device is composed of a wheel rotating at ~0.5 turn/second fitted with a silicon O-ring, see Figure 3. The wheel axis is off-centered by 3 mm from the center of the disk, this provides a 6 mm total lateral displacement after a rotation of the wheel over. This amplitude corresponds to the graphite disk radius, allowing the coverage of the surface. The impact of the laser on the surface of the disk thus moves along an unclosed cycloidal curve that covers it. The cycloid is generated by the two rotating circles with of non-commensurate dimensions and a radius ratio close to 0.9. The springs ensuring the lateral contact of the two wheels and the contact on the surface are chosen to be as gentle as possible, in order to provide contact but no wobbling of the rotation axis perpendicular to the surface. After the laser hits the surface of the disk, the evaporated molecules are entrained into the gas channel mixing with a synchronous helium gas pulse.
Operation of the source
The evaporation source is installed in a molecular beam machine already described in reference21. In brief, the source chamber is pumped by a 2000 l/s turbomolecular pump at 10-4 mbar and the resulting molecular beam is introduced through a 2 mm skimmer in the second chamber operated at 5.10-7 mbar. Triplet action spectra are performed in a pump probe configuration of two counter propagating lasers: the pump tunable between 450 and 700 nm (nanosecond dye lasers pumped at 355 or 532 nm) and the probe, an ArF (193 nm) laser electronically synchronized with a 5 ns precision. The ionization laser is separated by ~25 cm from the tip of the laser evaporation nozzle.
The ions are detected by either a time of flight mass spectrometer22 on axis with the molecular beam, or by a perpendicular velocity map imaging spectrometer23. This latter device allows the
7
characterization of the cooling within the beam and of the actual group velocity of the porphyrin molecules within the helium beam.
The synchronization of the firing of the valve and the laser pulses is the key adjustment procedure and is achieved by an electronic synchronization module constructed at ISMO (Paris-Saclay University, France). Essentially, the pulsed valve is fired first by a 170 µs width electrical pulse, then the evaporation laser is fired with a delay of 200 µs. The pump and ionization laser have a global delay of ~300±1 µs after the evaporation laser, after the evaporated bunch has arrived within the spectrometer ionization region. They are triggered independently with a final variable delay of -50 to 1000 ns, with a 5 ns precision.
Figure 3 :Sketch of the evaporation source. A cut has been made along AA’ to visualize the gas channel. The bottom wheel actuates with an off axis rotation the sample holder pressed upon it, sliding across the surface represented by a dashed rectangle. Therefore, the evaporation spot in red moves along an unclosed cycloid on this sample surface. The translation and rotation movements of the driving wheel are indicated in green.
Cooling in the expansion
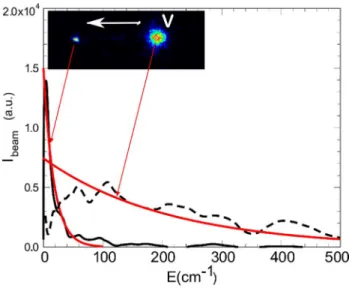
Monitoring the translational cooling of molecules diluted in the expansion is the most direct means of observing and characterizing the freezing of the various degrees of freedom of large molecules seeded in a molecular beam. This can be easily achieved using velocity map imaging. Here CuTPP has been ionized at 532 (I)+ 266 nm (I’), while the background gas is ionized by 2*266 nm photons (I’), as shown in Figure 4. The background gas is at room temperature, its spot gives the velocity origin and reproduces the thermal distribution, while the porphyrins ionized by (I+I’) photons exhibit the narrow velocity distribution of a cooled directed flow. The
8
images of the velocity distributions of the porphyrin and of the background gas are shown in the insert of Figure 4: one observes two spots of ion imaging and the velocity distributions are recovered by inverting the image by the Pbasex method24, i.e. deriving the
Figure 4 :1+1’ REMPI of CuTPP with 532+266 nm, left spot and corresponding translational energy distribution (Ibeam), full
black trace with 20 K Boltzmann fit in red. On the right, a broad spot due to ionization of the background chamber impurities with 2*266 nm distribution shown by the dashed curve, a 300 K Boltzmann fit in red.
velocity distribution of the ions, thus the translational energy distribution of the corresponding neutrals. This reveals two species, since no mass gating has been applied. The broad spot can be assigned to the background gas with a thermal distribution, since it exists in absence of porphyrin evaporation. The narrow spot on the left corresponds to a bunch of CuTPP molecules with an average translational velocity of 900 m/s, from its displacement from the still background molecules. The translational velocity of the porphyrin is acquired by entrainment of the laser-evaporated molecules due to collisions with the expanding helium gas. This large molecule is accelerated along the helium flow and is cooled by heat exchange (collisions) with helium. The measured translational distribution of the porphyrin is fitted to a ~20 K Boltzmann translational energy distribution (red narrow curve in Figure 4). A rather cold distribution can be thus obtained with a moderate nozzle pressure of helium (2.5 bar). The corresponding
vibrational temperature was evaluated as 70 K with the equivalent ZnTPP molecule and
9
The important cooling achieved for a molecule of mass 676 amu (CuTPP) is also apparent through the observation of multimers, easily detected here when the sample concentration is sufficient, i.e. with a larger evaporation laser intensity. These multimers could not exist if the cooling could not dispose of their binding energy.
Results and discussion
Two types of experiments probing the copper porphyrins triplet population are performed: Triplet action spectra: the tunable pump laser scans the Q band absorption spectrum of
the molecule (500-600 nm), while the 193 nm probe laser ionizes selectively triplet CuTPP or CuOEP after ns delay.
Triplet lifetime measurements: The lifetime of this state is measured by varying the delay (-50, +1000 ns) of the probe laser (193 nm) with respect to the tunable pump. Several measurements where performed at different pump wavelengths in the 450-560 nm domain for CuTPP.
Triplet action spectra
CuTPP
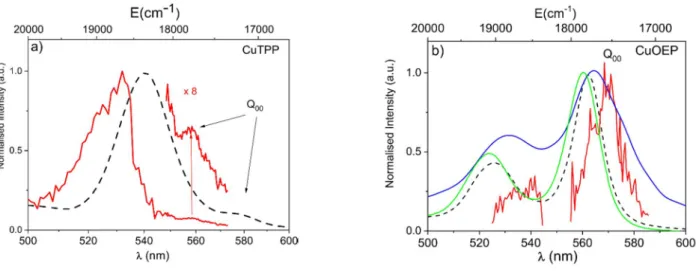
A series of action spectra have been recorded with 3 different dyes (coumarin 503, 540 A and fluorescein 550) in overlapping regions and combined in Figure 5a. In this figure, two regions are distinguished, the Q00 band origin domain at 558 nm and the vertical excitation of the Qv bands at 530 nm. For comparison, a room temperature spectrum of CuTPP dissolved in toluene recorded at ISMO is also represented as a dashed curve. The main maximum of the asymmetric band at 532 nm (18 800 cm-1) is red shifted by ~280 cm-1 in the solution spectrum. Since the corresponding band at 540 nm (18 520 cm-1) is symmetric in solution due to spectral broadening by the solvent, in order to compare with solution data, one can also consider the center to center distance of both bands, 430 cm-1. The reddest band is at 558 nm (17 920 cm-1) and the corresponding band is red shifted in solution by 550 cm-1, this red shift is regular for a *
10
transition and due to the greater solvation of the diffuse excited state. It is noted that the 558 nm band is very weak compared to that at 532 nm and the same is true in solution, as discussed later.
CuOEP
The same type of spectrum is represented in Figure 5b for CuOEP and exhibits a notably different shape as compared to CuTPP, with a broad absorption (16 nm) maximum at 568 nm (17600 cm-1) and a very weak maximum at shorter wavelength. It is compared with the toluene absorption (dashed line) and also with the gas phase absorption at 654 K1 (blue) that is clearly broadened by hot bands. The CuOEP absorption has its maximum on the Q00 band as assigned by Gouterman et al., as the result of many experimental1 and theoretical studies25 .
Gouterman, in a simple model derived from cyclic polyenes and based on Hückel type LCAO combinations (nearest neighbor perturbation) has given principles to rationalize the detailed behavior of B and Q bands. The B bands, at 400 nm, also known as Soret bands, are generally strong and the Q bands such as those here are much weaker. In a simple four conjugated orbital model, the visible Q and near UV B bands of porphyrins have been described as originating from two configurations in D4h symmetry, a1u and a2u -accidentally degenerate in many porphyrins. Electronic excitation from a1u or a2u to a degenerate eg orbital leads in two states of Eu symmetry of configurations a1u eg or a2u eg. Due to configuration interaction, these two configurations are mixed generating two states, the higher energy two electron state corresponding to the symmetric combination of a1u eg and a2u eg, while the lower energy one is due to its antisymmetric combination. These two states exhibit transition moments from the ground state that are symmetric and antisymmetric combinations of two equivalent moments. Thus a strong absorption is obtained for the symmetric combination, sum of the a1u eg and a2u eg
11
moments, while the corresponding difference for the antisymmetric combination has a reduced absorption intensity. This explains the strong B and weak Q bands. However this is resting on symmetry and on the accidental degeneracy of the a1u and a2u configurations. Such is the case for CuTPP. In addition, due to the low intensity of the Q00 transition, vibronic effects are manifest where a more intense Qv band (vibrationally excited) at higher energy borrows intensity to the B state and overwhelms the Q00 transition.
In turn, when the degeneracy of the lower configurations a1u or a2u is diminished, the Q band gains intensity since the configuration mixing is less efficient. Indeed, in CuOEP, the alkyl groups attached to the pyrolle may inject electrons into the adjacent orbitals of the pyrolle ring to the a1u, configuration, thus raising its energy relative to the unaffected a2u26. This lifts the degeneracy of the a1u and a2u configurations, hence changes the sum and differences of the transition moments leading to a less intense B band and a more intense Q band. In this situation, the Q00 transition being augmented, the relative intensity of the Qv band is diminished as observed for CuOEP.
Figure 5a: triplet action spectrum of CuTPP in the Q band region with a tunable pump 490-570 and an ArF 193 nm probe preferentially ionizing 2TCuTPP (red). Dashed line, room temperature toluene solution spectrum. b) triplet action spectrum of
CuOEP in the same conditions (red). Dashed line, absorption in toluene solution, green line absorption in CH2Cl2 solution and
blue line, vapour absorption at 654 K ( adapted from ref 1).
In both CuOEP and CuTPP , the Q00 - Qv distance is ≈1200 cm-1 as for the basic copper porphyrin10.
12
In CuTPP and CuOEP, the Q00 bands at respectively 558 and 568 nm are broad. For CuOEP the breadth is ~390 cm-1 at half maximum (~10 nm) and CuTPP is equally broad. This width is very similar in the toluene solutions of both compounds. Two factors contribute to this width: i) the 70 fs lifetime12 , causing a homogenous width of 80 cm-1 , ii) a spectral congestion at the ~70 K vibrational temperature. In CuTPP, for instance, many low frequency modes are populated, among them phenyl ring torsions identified at 22 and 45 cm-1 in tetraphenyl porphyrins, those are optically active and generate hot band progressions27. Thus they should contribute to the origin Q bandwidth trough Q11 and Q22 torsion sequences (=0) close to Q00, either blue or red shifted depending on their frequency change on excitation. A similar broad and diffuse Q00 band was observed for copper protoporphyrin prepared in similar conditions 28. The temperature evolution of the Q00 transition appears in Figure 5b in blue at 654 K with the vapor absorption spectrum of CuOEP twice as broad as it is at 70 K, and shifted to the blue. This blue shift of the sequence bands results from the low frequencies being higher in the excited state. The CuOEP spectrum in Figure 5b is very similar in position and diffuseness to that of copper protoporphyrin obtained in the gas phase by resonant two photon ionization28.
The latter intense Q00 band of CuOEP appears also in solutions but blue shifted in toluene by ≈300 cm-1. This shift generally identifies n* transitions through their excited state less stabilized in solution by their loss of their non-bonding n electron. The blue shift is however unusual for a * transition such as for the Q transition, showing generally a solvent red shift, as for CuTPP in Figure 5a where the solvent spectrum (dashed line) is red shifted from the red gas phase curve. As can be seen in Table 1 for an ensemble of metalloporphyrins, the Q00 bands of tetraphenylprophyrins and phtalocyanins are red shifted in non coordinating solvents, while those of octaethyl porphyrins are blue shifted like in the case of ZnOEP. The blue solvent shift of Q00 in CuOEP could have the same origin as the ground state configuration splitting, through
13
electron donation from the solvent to the pyrolle orbitals that would stabilize more its ground state relative to excited states. It should be noted that in large nonfluorescent molecules, measuring the solvent shift is difficult by lack of data from gas phase unperturbed molecules, therefore these unexpected values may be more common than observed.
Compound Medium Absorption References
B Q(1,0) Q(0,0)
CuIITPP Molecular beam - 532 558 This work
CuIITPP Vapor T=714K 405 544 - 29
CuIITPP Toluene Solution - 540 578 This work
CuIITPP Benzene Solution 416.3 539 578 29
CuIIOEP Molecular beam - - 568 This work
CuIIOEP Vapor T=654K 387.5 531 566 1, 29
CuIIOEP Toluene Solution 400 525 563 30
CuIIOEP C2H2Cl2 Solution 397 523 560 This work
CuIIPP Molecular Beam - - 565 28 CuIIPP Pyridine solution 387 538 575 31 ZnIITPP Molecular beam He 571.8 27 ZnIITPP Vapor T =718K 406 550 594 29, 32 ZnIITPP Solution benzene 425 550 589 29 ZnIIOEP Vapor T=652K 385 535 572 29,1 ZnIIOEP Solution CH2Cl2 400 530 566.7 1
ZnIIOEP¨ Solution Toluene 404 532 570 30
TPP :TetraPhenyl Porphyrine; OEP: OctaEthylPorphyrine, PP : ProtoPorphyrine ,
14
Triplet lifetime measurements
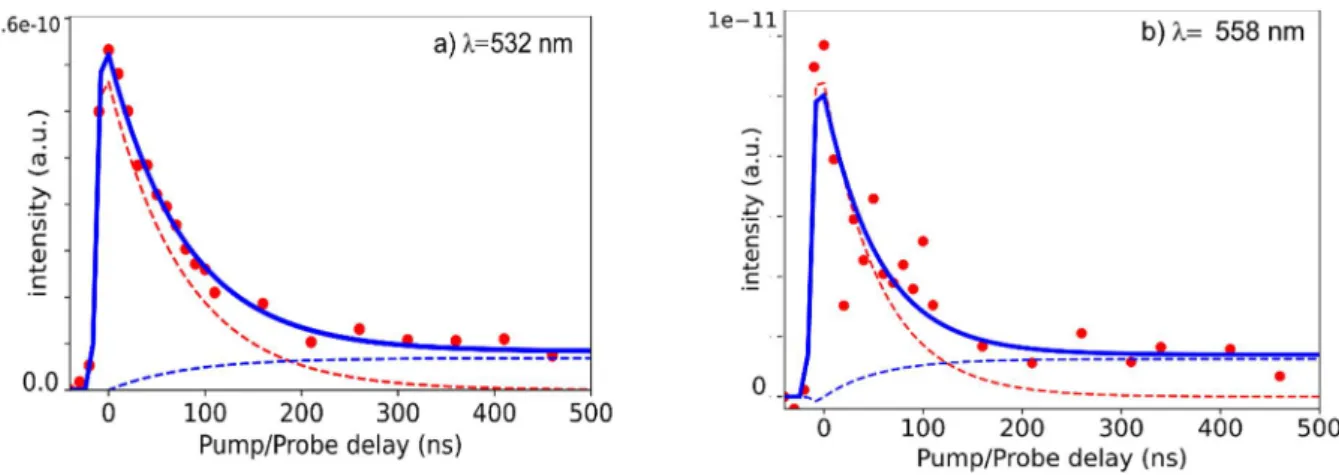
The lifetime of triplet state can be measured by electronically delaying the probe laser (193 nm) with respect to the tunable pump in the 430-560 nm domain. The probe only weakly ionizes CuTPP or CuOEP in absence of the pump since its ionization potential is 6.49 eV 17, therefore the corresponding background is small at negative delays. The triplet decay of CuTPP pumped at 525 nm close to the Qv absorption maximum is represented in Figure 6a. It can be fitted by an exponential lifetime, 70 ±7 ns with a Gaussian convolution of 1/e width=10 ns. This decay is superimposed on a long-lived component, > 5 µs (10%). A series of decays has been recorded from the second maximum at 532 nm to the 558 nm Q00 origin and no increase of the lifetime was detected with decreasing the excess energy, comparing Figure 6 a and b with 532 and 558 nm excitations, and using the same fit parameters (with a lesser precision due to a 10 times smaller signal at 558 nm).
Figure 6 : a) Decay of CuTPP pumped at 532 nm and probed with 193 nm as a function of pump/probe delay. b) Same as a) but CuTPP pumped at 558 nm and probed at 193 nm. The dashed lines indicate the two sequential components, 70 ns in red and >>5µs in blue.
Triplet states of CuTPP refers to electronic states of the porphyrin ring bearing a s=1 spin on a ring centered delocalized 3* orbital. Triplet states are created through an ultrafast process7 with an intermediate CT state conserving the total spin ½12 33. This ultrafast intersystem crossing is mediated by a charge transfer state with a 350 fs lifetime as observed for CuTPP (or CuOEP) following B state excitation7 and equivalently 260 fs in benzene solution13.
15
However, by interaction with the spin on the Cu atom, this state is split in two final states: 2T (S=1/2 ; Cu s=1/2, TPP s=1) directly formed by the above process and 4T (S=3/2 ; Cu s=1/2, TPP s=1) 33. The latter quartet 4T state, which is not formed directly, has been characterized in the case of copper porphyrin CuP by its Zeeman splitting at 4.2 K34. 4T is the lowest state for all studied copper porphyrins and for its total spin change with the ground state, it is expected to exhibit a longer radiative lifetime than 2T. The 2T -4T splitting also differs through the different copper porphyrins: CuOEP (octaethylporphyrin) has a smaller gap ~400 cm-1 than CuTPP, with a 800-1000 cm-1 gap35. It is possible to link the present observation of two decays to that of two states in CuTPP: 2T formed directly by the ultrafast process and decaying with the 70 ns lifetime into 4T that further evolves with the observed longer lifetime >5 µs. On the other hand, CuOEP displays only a single decay time, 300±30 ns. In this case, the 4T decay time may be shorter than this value. Both molecular beam decay values 70 ns (CuTPP) and 300 ns (CuOEP) are in the same range as that of 300 K solutions (100 ns range35), but are very different from those in frozen solutions at 77 K, in the order of 100 µs33, close to the radiative lifetime. The populated 2T state decays either directly or indirectly (via 4T as in CuTPP) to the ground state in a much faster than the radiative decay rate.
Conclusion
We have observed the action spectra of the short lived S1 (Q) excited state of CuOEP and CuTPP in a cooled molecular beam using the triplet tagging method with a pump probe arrangement combining a 500 - 600 nm resonant pump and a 193 nm delayed probe. Solvent free spectra are obtained for these porphyrins bands that accord with the 4 orbital model with respect to the intensities of the origin Q transitions. On the other hand, these solvent free spectra, rather rarely obtained for large neutral molecules, can be compared with solution spectra revealing the nature of the solvent shifts. These gas phase spectra are naturally broad though
16
their short lifetime and are further broadened by sequence bands close to the origin. The triplet decay time measurements confirm the potential of triplet action spectra in the gas phase detected a few ns after excitation by ionization. The ns delay time ensures a good sampling of the triplet population even for weakly emitting systems. The sensitivity of the method could be greatly improved with a suitable choice of the probe, here close to the ionization energy of the system. Using a 4.6 eV (266 nm) probe that ionizes selectively the triplets 2T and 4T should increase by an order of magnitude the detection. This should allow a generalization of this methodology for solvent free measurements.
Acknowledgments:
This work has been financially supported by "Investissements d’Avenir du LabEx PALM (ANR-10-LABX-0039-PALM)"
References
1. L. Edwards, D. H. Dolphin and M. Gouterman, J. Mol. Spectrosc. 35 (1), 90-109 (1970). 2. Y. Wang, C. L. Hendrickson and A. G. Marshall, Chem. Phys. Lett. 334 (1), 69-75
(2001).
3. Q. Bian, M. W. Forbes, F. O. Talbot and R. A. Jockusch, Phys. Chem. Chem. Phys. 12 (11), 2590-2598 (2010).
4. M. R. Dobber, W. J. Buma and C. A. de Lange, J. Chem. Phys. 99 (2), 836-853 (1993). 5. T. Gerbich, H.-C. Schmitt, I. Fischer, J. Petersen, J. Albert and R. Mitrić, J. Phys. Chem.
A. 119 (23), 6006-6016 (2015).
6. T. Ebata, M. Kayano, S. Sato and N. Mikami, J. Phys. Chem. A. 105 (38), 8623-8628 (2001).
7. S.-i. Ishiuchi, M. Sakai, K. Daigoku, T. Ueda, T. Yamanaka, K. Hashimoto and M. Fujii, Chem. Phys. Lett. 347 (1), 87-92 (2001).
8. G. Feraud, M. Broquier, C. Dedonder-Lardeux, G. Gregoire, S. Soorkia and C. Jouvet, Phys. Chem. Chem. Phys. 16 (11), 5250-5259 (2014).
9. G. E. Douberly, R. S. Walters, J. Cui, K. D. Jordan and M. A. Duncan, J. Phys. Chem. A. 114 (13), 4570-4579 (2010).
10. M. Noort, G. Jansen, G. W. Canters and J. H. van der Waals, Spectrochimica Acta Part A: Molecular Spectroscopy 32 (6), 1371-1375 (1976).
11. S. Sorgues, L. Poisson, K. Raffael, L. Krim, B. Soep and N. Shafizadeh, J. Chem. Phys. 124 (11), 114302-114310 (2006).
17
12. M.-H. Ha-Thi, N. Shafizadeh, L. Poisson and B. Soep, J. Phys. Chem. A. 117 (34), 8111-8118 (2013).
13. D. Jeong, D.-g. Kang, T. Joo and S. K. Kim, Scientific Reports 7 (1), 16865 (2017). 14. R. L. Ake and Gouterman.M, Theor. Chim. Acta 15 (1), 20 (1969).
15. V. s. Chirvony, E. Sagun and B. Dzhagarov, J. Appl. Spectrosc. 27, 948-950 (1977). 16. J. S. Baskin, H.-Z. Yu and A. H. Zewail, J. Phys. Chem. A. 106 (42), 9837-9844 (2002). 17. S. C. Khandelwal and J. L. Roebber, Chem. Phys. Lett. 34 (2), 355-359 (1975).
18. J. R. Cable, M. J. Tubergen and D. H. Levy, J. Am. Chem. Soc. 110 (22), 7349-7355 (1988).
19. Z. W. Fu, G. W. Lemire, Y. M. Hamrick, S. Taylor, J. C. Shui and M. D. Morse, J. Chem. Phys. 88 (6), 3524-3531 (1988).
20. S. C. Obrien, Y. Liu, Q. Zhang, J. R. Heath, F. K. Tittel, R. F. Curl and R. E. Smalley, J. Chem. Phys. 84 (7), 4074-4079 (1986).
21. J. M. Mestdagh, F. Spiegelman, E. Gloaguen, M. Collier, F. Lepetit, M. A. Gaveau, C. Sanz Sanz and B. Soep, J. Phys. Chem. A 110 (23), 7355-7363 (2006).
22. W. C. Wiley and I. H. McLaren, Rev. Sci. Instrum. 26 (12), 1150-1157 (1955). 23. A. T. J. B. Eppink and D. H. Parker, Rev. Sci. Instrum. 68 (9), 3477-3484 (1997). 24. G. A. Garcia, L. Nahon and I. Powis, Rev. Sci. Instrum. 75 (11), 4989-4996 (2004). 25. M. Gouterman, G. H. Wagnière and L. C. Snyder, J. Mol. Spectrosc. 11 (1), 108-127
(1963).
26. M. Gouterman, J. Mol. Spectrosc. 6, 138-163 (1961).
27. U. Even, J. Magen, J. Jortner, J. Friedman and H. Levanon, J. Chem. Phys. 77 (9), 4374-4383 (1982).
28. J. M. Beames, A. J. Hudson, T. D. Vaden and J. P. Simons, Phys. Chem. Chem. Phys. 12 (42), 14076-14081 (2010).
29. M. Gouterman, in The Porphyrins, vol III, edited by D. H. Dolphin (Academic Press, New-York, 1978), Vol. III, pp. 1.
30. M. Taniguchi and J. S. Lindsey, Photochem. Photobiol. 94 (2), 290-327 (2018). 31. K. Alston and C. B. Storm, Biochemistry 18 (20), 4292-4300 (1979).
32. L. Edwards, D. H. Dolphin, M. Gouterman and A. D. Adler, J. Mol. Spectrosc. 38 (1), 16-32 (1971).
33. D. Eastwood and M. Gouterman, J. Mol. Spectrosc. 30 (1–3), 437-458 (1969).
34. W. G. van Dorp, G. W. Canters and J. H. van der Waals, Chem. Phys. Lett. 35 (4), 450-456 (1975).