HAL Id: halshs-01359159
https://halshs.archives-ouvertes.fr/halshs-01359159
Submitted on 22 Dec 2020HAL is a multi-disciplinary open access archive for the deposit and dissemination of sci-entific research documents, whether they are pub-lished or not. The documents may come from teaching and research institutions in France or abroad, or from public or private research centers.
L’archive ouverte pluridisciplinaire HAL, est destinée au dépôt et à la diffusion de documents scientifiques de niveau recherche, publiés ou non, émanant des établissements d’enseignement et de recherche français ou étrangers, des laboratoires publics ou privés.
Peripherality in the global container shipping network :
The case of the Southern African container port system
Darren Fraser, Theo Notteboom, César Ducruet
To cite this version:
Darren Fraser, Theo Notteboom, César Ducruet. Peripherality in the global container shipping net-work : The case of the Southern African container port system. GeoJournal, Springer Verlag, 2016, 81 (1), pp.139-151. �10.1007/s10708-014-9610-6�. �halshs-01359159�
1
PERIPHERALITY IN THE GLOBAL CONTAINER SHIPPING
NETWORK: THE CASE OF THE SOUTHERN AFRICAN CONTAINER
PORT SYSTEM
Darren FRASERa1, Theo NOTTEBOOMb and César DUCRUET c
a Institute of Transport Maritime Management Antwerp (ITMMA), University of Antwerp, Antwerp,
Belgium, [email protected]
b Institute of Transport Maritime Management Antwerp (ITMMA), University of Antwerp and
Antwerp Maritime Academy, Belgium, [email protected]
c French National Centre for Scientific Research (CNRS), UMR 8504 Géographie-Cités, Paris, France, [email protected]
Pre-final version of the article published in Geojournal (2016), 81(1): 139-151
ABSTRACT
The past two decades have brought significant growth at, and competition between regional gateway and intermediate hub container ports in Southern Africa. Regional trade co-operation, economic growth and greater political stability have enabled increased container throughput and container port capacity development. Earlier academic work (Notteboom, 2010; Notteboom, 2012) has indicated that the functional position of this port region in the global maritime network might be shifting from a remote region in the periphery of the network to an intermediate region playing an essential role in accommodating South-South trades between Asia, South America East Coast and West and East Africa.
This paper aims to analyze the changing level of peripherality and remoteness of the Southern African container port system as part of the global container shipping network. The central hypothesis is that Southern Africa has moved from a remote shipping region to a slightly more central shipping region in the global network. The methodology consists of the calculation of network measures for Southern African ports such as betweenness centrality (i.e. position on shortest paths over the global network of container flows), maritime degree (i.e. number of connections to other ports in the network) and eccentricity measures. The changing geographical distribution of flows among the main container ports in South Africa, Namibia, Mozambique, Mauritius and Madagascar will also be explored in terms of their respective shipping services, port calling patterns, market structure in terms of the number of active carriers and the upgrading of vessel sizes and port capacity. It is demonstrated that these factors are strongly linked to the level of peripherality. The overall result is a mapped port hierarchical structure with a clear indication of the shifted maritime centrality of Southern African ports from 1996 to the present decade. The rise of the Cape of Good Hope as a sailing route alternative to the Suez Canal and the influence of growing trade between the BRICS countries are identified as the major sustainable drivers of the increased traffic volumes and the downward pressure on peripherality.
Key Words: periphery, global container shipping network, Southern Africa, container port
1 Corresponding Author
2 1. Introduction
The age of containerization has spurred on globalisation by gradually enabling new forms of trade relationships between regions and directly influencing industry by exerting pressure on transport costs and driving vertical and horizontal integration among players in the supply chain. In light of these developments, South African ports are challenged to serve as critical logistical entities allowing for vital maritime links between the Southern African Development Community (SADC), its neighbouring countries, and the rest of the world. In the last twenty years, Southern African countries have experienced significant political and economic changes which have directly impacted the growth of container traffic to the region. In 2005, Southern Africa’s container traffic accounted for 40% of the continent’s volumes, measured in twenty-foot equivalent units (TEU) (World Bank, 2010). This result was a close second to West Africa’s 41% container market share on the continent. Durban, the largest container port of Southern Africa, realized an average container growth of 8% during the period 1985 to 2010 and currently has a market share of 53% in the region. Maputo (Mozambique), thanks to its recent political and economic reforms, is however becoming a significant competitor in Southern Africa. Namibia, located on the west coast north of South Africa, facilitates trade along the Walvis Bay corridors. The Walvis Bay corridor represents an important corridor for the landlocked countries of Southern Africa such as Botswana, the land locked regions of South Africa such as the Northern Cape. Mauritius and Madagascar, although not a land based part of the Southern African region, both islands have an important role being strategically positioned at the crossroad of vital trade routes between Europe and Asia, Africa and Australia. Mauritius too has experienced significant growth of 8% during 1985 to 2010 (Fraser and Notteboom, 2012).
In a remote/distant setting like Southern Africa however, what effect has container shipping had on ports on the periphery (such as the Southern African variety) on the global container shipping network? This paper aims to analyze the changing level of peripherality and remoteness of the Southern African container port system as part of the global container shipping network. The central hypothesis is that Southern Africa has moved from a remote shipping region to a slightly more central shipping region in the global network. The methodology consists of the calculation of network measures for Southern African ports such as betweenness centrality (i.e. position on shortest paths over the global network of container flows), maritime degree (i.e. number of connections to other ports in the network) and eccentricity measures. The changing geographical distribution of flows among the main container ports in South Africa, Namibia, Mozambique, Mauritius and Madagascar will also be explored in terms of their respective shipping services, port calling patterns, market structure in terms of the number of active carriers and the upgrading of vessel sizes and port capacity. It is demonstrated that these factors are strongly linked to the level of peripherality. This paper is arranged as follows. First a literature overview introduces graph theory, the peripherality problem and the dynamics in port hierarchy. This is followed by a discussion of the Southern African maritime reach within the global maritime network and thereafter the disclosure of the data collection process and research methodology. The paper concludes with a discussion of the research findings, recommendations and scope for further research.
3 2. Literature Study
2.1 The problem of peripherality
According to Ball (1996), peripherality is typically quantified by some variant of a market accessibility model and is generally interpreted as indicative of remoteness or inaccessibility. Peripheral locations are also viewed (on account of their distance/remoteness) as being disadvantaged in terms of the high transport and production costs they typically attract. Swyngedouw (1992) advocates location and the particular pattern of the spatial configuration in which the individual capital (in this case a port) is embedded (through location), and which enhances the ‘productivity’ of the deployed capital. Ball (1995) recommends overcoming the notion of being remote or peripheral by using the ‘peripheral factor’ as an opportunity to motivate for infrastructure projects to policy makers and authorities for developments to overcome the problem. Other schools of thought such as the New Economic Geography (NEG) have questioned the direct causality between peripherality and economic disadvantage (Behrens et al., 2006), since high transport costs caused by remoteness may in turn create advantages in the form of reduced competition from outside. Besides general discussions on the role of transport costs in enticing agglomeration or dispersion of economic activities across space in the core-periphery model (Lafourcade and Thisse, 2011), certain NEG scholars in the case of ports have even proposed that the transport link between the core and the periphery should deteriorate (instead of improving it) so as to foster port-related growth at coastal cities (Fujita and Mori, 1996; see also Ducruet et al., 2009).. Such ideas confirmed earlier works concerning the developmental effects of remotely located gateways on their surrounding regions, often harmed by the "urban shadow" exerted by the core economic (especially, inland) region (Stern and Hayuth, 1984; see also Merk, 2013). Most of these works however, have viewed peripherality from a landside perspective.
Rare studies have, however, adopted a maritime view of this phenomenon and such studies followed a more conceptual or descriptive analysis. While discussing port development, Slack and Wang (2002) and Notteboom and Rodrigue (2005) emphasise the idea that the challenge of being on the periphery of a port system is spurred on by the proliferation of new ports, and the consolidation of emerging port areas and regions. More recently, Feng and Notteboom (2013) demonstrated that medium-sized peripheral ports in Northeast China are successfully challenging the large established gateways. Aligned to this, Fleming and Hayuth (1994) have also noted how centrality and intermediacy (the opposite of periphery) create strategic locations based mainly on situational factors which can change. Therefore a change in an economic or geo-political situation could theoretically transform a distant/ peripheral location to a more central or intermediate one. A three-phase model of hub dependence was proposed by Ducruet (2008) demonstrating how ports can become more central or more remote in the maritime network depending on their ability to attract direct calls and transhipment activities from shipping lines. For instance, Shenzhen ports have become less "hub-dependent" on Hong Kong over time, while North Korean ports have increasingly been polarized by the South Korean hub - the latter trend being largely due to a lack of investment in port infrastructure and facilities as well channel accessibility improvements on account of the profound economic crisis. Yet in some cases, efforts to palliate remoteness to foster port
4
development had limited outcomes. This was exemplified by the case of the port of Darwin (Australia), a port equally distant from Singapore and Sydney. Darwin endured negative effects to its port following the commissioning of a new transcontinental railway in 2005 (Wu, 2011). Remoteness can also be considered as business risk by shipping lines and port operators. For example, Chen et al. (2013) provide evidence of overcharging practices by shipping lines on the Far East-South African sailing route. Reasons cited for the overcharge relate to vessel imbalance factors, load factors (particularly the inability to exploit new generation vessel capacity) and, most importantly, the business risk associated with this underdeveloped and distant location. Shipping lines would typically refer to the element of risk to justify higher than average freight rates to this more remote region.
The novelty presented in this paper is that we do not analyse peripherality/remoteness of individual ports within a port system or port region. Instead, the analysis is primarily directed towards the level of remoteness/peripherality of an entire port system (i.e. the Southern African container port system) as well as the individual ports thereof in the global shipping network.
2.2 Factors affecting port hierarchy and peripherality
According to Fagerholt (2004), port hierarchy in the container business is intrinsically linked to shipping lines design of liner service variables such as frequency, vessel capacity, fleet mix, vessel speed and the number of port calls. Ducruet and Notteboom (2012) state that shipping lines’ decisions on the desired port hierarchy are guided by strategic, commercial and operational considerations. Both these views of port hierarchy are however focused primarily on the maritime dimension (notably one of the most direct factors). Other factors, (perhaps more indirect) however also influence and impact the port hierarchy in a given port system. Table 1, identifies four salient factors which influence port hierarchy. Geographical (directly linked to the extent of peripherality), market based factors, strategic and geopolitical factors are four dominant variables identified by various scholars as influencing port hierarchy in a given port system. This study focuses primarily on factor (1- Geographical), analyzing the changing level of peripherality and remoteness of the Southern African container port system as part of the global container shipping network.
Excluded in these factors influencing port hierarchy however, is the influence/impact of transshipment cargo. According to Rodrigue and Notteboom (2010), in the last few decades, extensive hub-feeder container systems and short-sea shipping networks came into existence to cope with increasing container volumes and to better facilitate connectivity between port ranges. Consequently the economics of transhipment and relay/interlining have resulted in the establishment of intermediate hubs further impacting port hierarchy. The growth of transshipment activities has a twofold impact on the remoteness of individual ports in the global shipping network. On the one hand, a port can become less remote in a global perspective in cases where the transshipment hub enables the port to gain maritime access (via indirect feeder/mainline services) to overseas markets. On the other hand, a mainland port which has direct liner services to overseas markets can become more remote in case a transshipment hub is inserted in the network, thereby luring direct calls away from the
5
mainland port. The overall net effect of both phenomena typically leads to a more complex liner service network with lower operational costs to shipping lines and more favorable freight rates and sailing frequencies for shippers.
Table 1: Salient factors influencing port hierarchy Factors influencing Port Hierarchy
(1) Geographical factors (Extent of Peripherality) Proximity to main shipping trade routes
Peripheral locations are also viewed (on account of their distance/remoteness) as being disadvantaged in terms of the high transport and production costs they typically attract.
Measuring the extend of a ports global coverage.
De Langen and van der Lugt, (2002); Ball (1996); Slack and Wang (2002) and Notteboom (2005); Parola and Veenstra (2008) Corridors & proximity hinterland
Ports with established corridors to inland intermodal hubs enable containers to be shipped across longer distances.
Song (2003) De Langen and van der Lugt (2002) Notteboom and Rodrigue (2005) (2) Market factors Port profile Demand Factors
Flow orientation and geographical specialization, port scale and growth, frequency of vessel visits and connectivity. Notteboom, (2009) Ducruet and Notteboom, (2012) Port Profile Supply Factors
Port capacity, cost, quality and reliability of services, nautical access, terminal operations and hinterland access. Lee et al (2008) Ducruet and Notteboom, (2012) (3) Strategic Factors Strategic actions of Port Operators
Vertical integration between operators and shipping lines. The economics of transhipment and relay/interlining have resulted in intermediate hubs with
terminals owned, in whole or in part, by carriers or port operators. Port performance influencing port selection by carriers. Lirn et al, (2004) Rodrigue and Notteboom, (2010), Hall and Jacobs, (2010) Strategic actions of Shipping Lines
Carriers horizontal integration (strategic alliances, operating agreements and slot chartering agreements and consortia) provide more ‘loops’ with among them to reshape their liner shipping networks through the introduction of new types of liner services on the main east–west trade lanes, Scale increases in vessel sizes increased the use of Hubs and
Ducruet and Notteboom, (2012), Fremont (2007)
Hall and Jacobs, (2010);
Robinson (2002)
6 intermediate hubs.
Some shipping lines attain a key and dominant position in a port it selects as a hub so as to secure its port operations in the long term, with, no doubt, the ability
to influence policy within the port as well.
(4) Geopolitical factors
Changing environments have led to changing liner shipping networks and consequently changing port hierarchies. Perceived business risk on account of political transition or instability resulting in higher sea freight rates.
De Langen and van der Lugt, (2002), Jacobs, (2007) Ntibarekerwa, (2010) Ncube et al, (2011); Chen et al. (2013) Source: Own elaboration based on various scholarly insights
Shipping lines have also capitalized on attempting to impact their influence on port hierarchy by (as stipulated in table 2) strategic action, namely investing wholly or in part in port operations with ports having high instances of transshipment cargo. The position of pure transhipment hubs and their influence on port hierarchy can however be criticized. Transhipment cargo is generally more unstable and ‘footloose’ compared with the more captive cargo of pure gateway ports. Once traffic volumes for a newly developed (or refurbished) gateway port with excess capacity are sufficient, hubs are bypassed and might even become redundant (Wilmsmeier and Notteboom, 2010). The location of transshipment hubs though still remains important, because they lower the deviation distance to/from main trunk lines (Zohil and Prijon, 1999). In practice, many ports aim for a subtle combination between centrality (proximity to origin/destination markets) and intermediacy (insertion in carrier networks) (Fleming and Hayuth, 1994). This is exemplified by the case of North Europe where the main transhipment hub ports (Rotterdam, Hamburg, Antwerp, Zeebrugge and Le Havre) are also the main hinterland/gateway ports of the North European Range with a transshipment incidence of ‘only’ 25 to 45% given (see Ng, 2006; Notteboom, 2010b). Given the ‘unfavourable location’ or distance of the Southern African port system, the next sections will elaborate on the level of peripherality of the port system and how peripherality and its negative consequences can be overcome.
3. Volumes, vessel calls and trade orientation in the Southern African Maritime Reach
Positioned at the tip of the African continent, Southern African ports are ideally situated to serve as economically viable commercial ports for both the SADC Western and Eastern seaboards and the landlocked countries in between. Southern Africa port development has evolved in three phases, (1) colonial, (2) independence and (3) global integration phase. From as early as the late 17th century (colonial phase) Southern Africa served as an important
7
maritime space mainly as a halfway refreshment station to service Dutch2 vessels en route to the east. The second phase (independence phase) was a period of ports being managed by the newly independent states establishing their authority in the management of the port state assets. Finally, in the current global integration phase 3 ports face increased pressure on port capacity arising from the impact of globalisation on trade as well port institutional changes (ownership structure changes) which in some cases were necessary in order to obtain alternate funding for port investments. The current phase 3 sees Durban positioned as one of the top 503 ports in the world and the region as having viable east-west trade hubs and, potentially, an alternative sailing route to the Suez Canal route for north-east trade (Notteboom, 2012).
Figure 1 shows the Southern African ports together with each port’s respective handling capacities. The container port system incorporates countries such as South Africa, Mozambique, Namibia and the islands of Madagascar and Mauritius. This region is considered remote to the main network however is served by global container carriers such as Maersk Line, MSC, MOL, Evergreen and CMA CGM.
Figure 1: Ports of the Southern African container port system Source: Fraser & Notteboom (2012)
There are no hub-and-spoke and relay/interlining operations in the region comparable to the ones found along the global beltway (Notteboom 2010;2012). Various internal and external factors however are driving traffic to the region (Ntibarekerwa, 2010). Internally these factors include increased investments in port accessibility and port terminal infrastructure, improved shipping links with Asia and increased terminal productivity (for example, container dwell time in Durban averages three days, one of the lowest on the continent, Raballand et al, 2012). Externally, the strong GDP growth outlook, integration of regional economies with
2 In 1652 the Dutch East India company (VOC) sent a group of Dutchmen under the command of Jan van Riebeeck establish a refreshment station and to provide facilities for crew who had fallen ill to diseases such as scurvy on the journeys between Holland and East Asia.
8
Asian suppliers and greater regional political stability and the increase/ emergence in the middle class (Ncube et al, 2011) have also spurred on maritime traffic growth to Southern Africa. Growth of the emerging market economies (like South American and African) is forecasted at 5.5% in 2013, as IMF forecasts in the World Economy Outlook (IMF, 2012).
Apart from captive cargo, transshipment container cargo traffic has also increased amongst hub ports in the region particularly among the ports of Ncgura and Port Louis. The Port of Ncqura was strategically positioned as a deep water transshipment hub from the investment planning stage of the project. Port Louis, since 2002 has realized a significant increase in transshipment over gateway cargo. Transshipment cargo surpassed gateway cargo at Port Louis from 2005 continuing to 2009. By 2009, transshipment cargo in Port Louis constituted 53% of total port volumes. (Fraser and Notteboom, 2012).
Annual growth rates recorded in respect of exports and imports of our case study are disclosed in table 2.
Table 2: Annual average growth rates of exports and imports by country (%)
2010 2011 Madagascar 2.7 47.2 Mauritius 16.7 17 Mozambique 4.5 60.7 Namibia 29.3 8.8 South Africa 28.8 20
Source: Date obtained from UNCTAD 2012 Handbook of statistics
The average annual growth rates remained positive for all the countries in this study. Notably, the less politically stable states (Mozambique and Madagascar) show the biggest fluctuations in the two years of observation while South Africa and Mauritius show a more stable trend in growth. The strong upward trend in general trade together with the cargo throughput volumes (figure 2) demonstrates the vitality of the African economy and the potential for Sub-Saharan ports. In the midst of the ongoing international economic crisis, this potential future growth can be sustained by the continued robustness of the BRICS economies. The last BRICS summit resulted in many pragmatic initiatives for the members such as a BRICS development bank. If implemented, these initiatives could sustain growth in trade between the member states (South-South & Far East Trade) and potentially alleviate the developing world dependence on northern developed countries for the financing of infrastructure projects.
9 Figure 2: Total Southern African Container Terminal Throughput
Source: Authors, data obtained from Port Authorities
Figure 3: Number of Vessel calls to Durban Container Terminal, 2000-2012 Source: Authors adaptation from Transnet Port Terminals data
0 500000 1000000 1500000 2000000 2500000 3000000 3500000 4000000 4500000 5000000 Toamasina Port Loius Maputo Durban Port Elizabeth Ncqura Cape Town Walvis Bay 0 250 500 750 1000 1250 N u mb er of V essel C alls b y V essel Siz e
Number of calls by Vessel Size 2000-2011
Cellular >200 200>250m Early Container Fully Cellular 250>290 Panamax & Panamax max 290>300 Post Panamax + PostPanamax Plus 300>366 New Panamax A B
10
Growing trade volumes are impacting on the container liner services calling at Southern African ports and the receiving containers terminals. For example, Figure 3 provides more detail on vessel calls by vessel size to the port of Durban4 between 2000 and 2012. The past 13 years has seen a complete shift in the composition of vessel types/sizes calling this port. The dominance of smaller vessels (>200m and >250m vessels) between 2000 and 2005 endured a complete downward trend during the years following 2005. The first vessels of 295 meters starting calling at the port of Durban (around 14 visits) in 2005 following a significant capital expansion program which involved widening and dredging the port entrance channel and berths (refer ‘A’ figure 3 for the movement). The upward trend of bigger vessel calls was further enabled through additional expansion projects such as the commissioning of a new two berth container terminal in 2007/8 (Pier 1), the reconfiguration of the existing terminal stack and further dredging of the of the channel and harbor. This culminated in the highest number of post-panamax vessel calls to the region in 2011 with 78 of the 251 vessels of that class having a length between 320 and 349 meters.
A supply side illustration is provided in figure 4, i.e. the Container fleet for selected years between 2002 to 2012. The upwards trend of the larger vessels 8000-9999 and 10 000+ vessel fleet is fairly consistent with port calls of vessels within this range to the continents busiest container port. The similar upward trend between the demand and supply end demonstrates the commitment from the port of Durban to meet the nautical requirements of the ever increasing number of larger container vessels in fleet. On the other hand, smaller, feeder vessels have had a reduction in calls at Durban, the trend of these vessels in the world fleet has remained upwards. This fact confirms Durban’s focus as being position as a regional gateway port. The upscaling of vessel sizes calling Southern African ports in line with the upscaling of the global container fleet might provide a first indication that the Southern African container port system is not becoming more peripheral/remote in the liner service networks of shipping lines. However, it does not provide clear empirical evidence the port system is becoming less remote/peripheral in the global container network.
The level of peripherality is affected by the geographical distribution of traffic flows to overseas markets. Figure 5 illustrates the market share of container trade (export and import) between South Africa to the rest of the world for the financial period 2013. The data is the total sum of TEU throughput from the four container ports in South Africa. These ports hold a 77%5 container market share of Southern African container ports in this study. More than half of the containers traded between South Africa and the rest of the world (52%) was with the Far east. The EU (Med and North Europe) follow second at 22% and the Middle East 14% third. Interestingly container trade with east Africa (7%) is marginally greater than with the US (6%). These figures provide a first indication that Southern Africa’s links to the Asian market are more developed than to many other overseas markets.
A closer examination of the vessel movement data between the different port (nodes) (whether direct or pendulum linkages) in section 5) will provide further insight into the
4 The port of Durban has a 55% market share in the region and has undergone the most port capacity changes (project scale and project cost) from 2000 to 2012.
11
validity of the first preliminary indications presented above. The methodology used is explained in the next section.
Figure 4: World Container Vessel fleet Source: Author, data obtained from Drewry International and the Clarkson Register
Figure 5: South African Container trade with the rest of the World (Ports of Durban, Cape Town, Port Elizabeth) 2013
-200 0 200 400 600 800 1000 1200 1400 2002 2004 2005 2006 2007 2010 2011 2012 Less 1000 1000-1999 2000-2999 3000-4999 5000-7999 8000-9999 10000+ Linéaire (Less 1000) Linéaire (1000-1999) Linéaire (2000-2999) Linéaire (3000-4999) Linéaire (5000-7999) Linéaire (8000-9999) 7% 52% 13% 14% 6% 9% 2% 1% EAST AFRICA FAR EAST MED MIDDLE EAST NORTH AMERICA NORTH EUROPE SOUTH AMERICA WEST AFRICA
12 4. Methodology
The objective of this paper is to analyze the changing level of peripherality and remoteness of the Southern African container port system as part of the global container shipping network. The central hypothesis of our study is that Southern Africa has moved from a remote shipping
region to a slightly more central shipping region in the global network. The methodology used in this research is based on the application of measurement instruments defined in graph theory. All of the positions or nodes, and all of vessel movements from one node (port) to another in the network provide the basis with which calculated measures for Southern African ports ‘remoteness’ can be assessed. The findings of the measurement instruments will be used in order to confirm or refute our hypothesis.
According to Ducruet and Notteboom (2012) the impact of a liner shipping network’s operation on container ports is often analysed in terms of throughput, arguably the most widely available indicator of port performance in official statistics (Twenty feet Equivalent Unit, TEU). Connectivity indicators obtained from graph theory, however, are more accurate to depict the situation of ports in a maritime network. For instance, maritime degree is, for a given port, the number of links to other ports which is also highly correlated to the capacity of each port (Laxe et al., 2012). Betweenness centrality counts the number of positions of a node on possible shortest paths among all nodes in the entire network (Ducruet and Lugo, 2013). It is therefore a more global measure of centrality than degree, which is more local. Degree and betweenness have, nevertheless, much in common in many networks, especially in the maritime network where most central ports globally are often those with the highest number of links (Kaluza et al., 2010). Other complementary measures can be used. Eccentricity measures to what extent a (port) node lies topologically far or close to other (port) nodes, while the clustering coefficient is the average probability that a port's adjacent neighbours are connected with each other. It is quite common that in a hub-and-spoke configuration for instance, feeder ports will have few transversal connections between them, while the hub ports will connect most of them (a star-shaped network). Thus, ports with a low clustering coefficient are likely to be dominant hub ports towards their immediate neighbours/competitors.
These measures are calculated based on a binary port-to-port matrix of inter-port links (i.e. presence or absence of links between two given ports). Ducruet and Notteboom (2012) detect interesting anomalies in the centrality of certain world ports. Large North American and Japanese ports are not positioned among the top ranking ports in terms of network centrality despite their traffic volume. The most central ports in the network are the Suez and Panama Canals (as gateway passages), Shanghai (due to the large number of ship calls) and ports like Antwerp (due to its high number of connections to a broad range of overseas markets). Cargo traffic flows through ports are a physical outcome of route and port selection by the relevant actors in the maritime chain. Route choice is (simplistically) predominantly determined by cargo end destinations (whether import or export). Bundling and hub-and-spoke networks rationalise the coverage of ports and shipping routes. However, this results in greater network complexity.
13
In this study the visualization will be based on container vessel movement data for a period of one month in May 1996, 2006, and 2011. Data were obtained from Lloyd's Maritime Intelligence Unit (LMIU), a world leader in maritime insurance and shipping information. The dataset contained information on daily vessel movements between ports of the world for the entire world container fleet. An extraction of the database was performed for the months of May 1996, 2006 and 2011. The database is periodically updated with vessel activity and includes the vessel: capacity, port of call, and inter-port link. One limitation is that not every vessel port call is necessarily related with cargo handling, but also bunkering. The ratio of bunkering to cargo vessel movements is highly negligible. As such this occurrence has an insignificant impact to the results.
An alternative means of assessing if the South African maritime reach has become less distant/remote could be achieved (albeit indirectly) through annual comparisons of regional container slot carrying capacity allocations6 in terms of regional concentration. Gini coefficient concentration measures have been applied in the maritime industry for instance Parola and Veenstra (2008) and Notteboom (1997). In our case, a data set of total container (slot) carrying capacity allocations (ship capacity deployments) from the top 5 shipping lines across all the major geographical areas could be disclosed in terms of each respective annual Gini coefficient value per geographical area. Comparison of the Gini values over the period of observation can provide maritime reach changes. If slot capacity allocations/ship capacity deployments are becoming more or less concentrated in the Southern African region compared to other regions in the world. The pitfalls of this approach are that
• the primary data is too aggregated. Vessel slot per port allocation is in a sense the aggregation of service patters, ship capacity, the number of vessels deployed and service frequency.
• Double counting due to vessel sharing agreements is possible.
• Due to the aggregation it is only possible to obtain the measures on a regional and not individual port level.
• The results would be indirect. Actual vessel movements to individual ports are more precise.
• The results will not provide an indication on the changes in connectivity and the evolution in the number of connections to each region over time.
Graph theory is thus selected as the most appropriate method to assess the changing levels of peripherality and remoteness of the Southern African container port system as part of the global container shipping network.
6 Refer Parola and Veenstra (2008) for application of spatial coverage of shipping lines in 27 global regions.
14 5. The changing position of South African ports in liner shipping networks
5.1 Regional network evolution
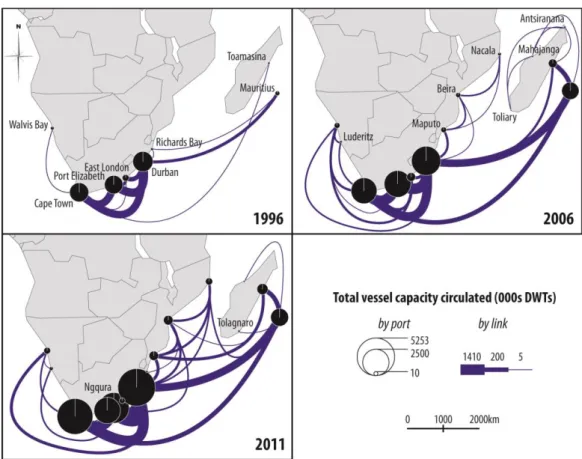
Mapping the flows at a regional (Southern African) level provides the first evidence of the changing configuration of inter-port maritime linkages (Figure 6). Although the map does not represent extra-regional flows, it provides a good indication of the manner in which Southern African ports connect each other and highlights which ports have seen their position evolving over a given period.
A review of the results reveals firstly an indication concerning the nature of this regional port system; rather stable according to the main traffic flows within the region. This is concentrated between the South African ports principally, the connections of Durban-Cape Town, Durban-Port Elizabeth, and Port Elizabeth-Cape Town. The link with Mauritius (especially with Durban, and Cape Town) has become quite voluminous since 2006, and extended towards Toamasina. The newcomer Ngqura in 2011 has not modified this structure profoundly but rather, reinforced it by consolidating in some way the position of the wider Port Elizabeth port complex which would otherwise have lost traffic to other established ports.
Secondly, it is evident that there is an ongoing densification and increased complexity in the network. New links and new nodes have emerged over time, especially in the neighboring countries of South Africa namely Mozambique and Namibia. This network expansion however must not hide the fact that in parallel, the number of links has reduced in relation to Namibia and Madagascar. So it is mostly Mozambique ports that benefitted from this increase in recent years. We also observe that South African ports play a pivotal role in the regional system, because all those secondary ports are primarily connected to them, thereby allowing few (and often minor) transversal linkages by passing them. In fact, South African ports have handled 96.6, 82.3, and 85.4% of the region's circulated vessel capacity each year. The latter increase is by no means attributed to the emergence of Ngqura port, which occupied no less than 18% of total regional vessel capacity in 2011.
The evolution of the regional port system rests upon concentration (1996-2011) and de-concentration (2006-2011) as seen in Table 3 both in terms of ports and of links. The density of links (Beta index) has evolved very similarly to the concentration coefficients. One specific evolution to be noted is the one of connectivity. The gradual decrease of the Gamma index (measure of network completeness compared with an "optimal", fully connected situation) underlines a growing rationalization of the network, as its observed connectivity is getting lower compared to its maximum possible connectivity. Losses in terms of ports and links are thus not compensated by gains. On the contrary, the network is evolving towards a more centralized configuration locally, as a few ports concentrate links to other ports.
15 Figure 6: Total Southern African mapped container vessel circulation capacity for the years 1996, 2006 and 2011
Source: Authors, data obtained from Lloyd's List Intelligence
Table 3: Structure of the Southern African port system
1996 2006 2011
No. ports 8 14 15
No. links 11 26 26
Beta index (link density) 1.38 1.86 1.73
Gamma index (link connectivity) 0.39 0.29 0.25
Concentration on nodes (Gini) 0.579 0.694 0.677
Concentration on links (Gini) 0.635 0.756 0.680
5.2 Global connectivity
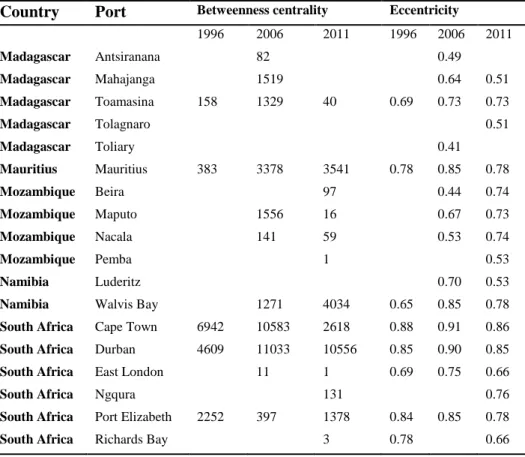
On the level of the global liner shipping network, southern African ports can be compared with each other based on the aforementioned measures of centrality and eccentricity (Table 4). Firstly, eccentricity as a whole is in accordance with the previous results: there has been an increase (1996-2006) and a decrease (2006-2011) of this score for most of the ports of the region. The evolution is somewhat similar to the one of concentration indices seen previously. Only secondary ports such as Beira, Maputo, and Nacala have witnessed an increase of their proximity to other ports between 2006 and 2011. In terms of betweenness centrality, the conclusion is more contrasted. Some ports have gone through rapid increase
16
and then stability (Mauritius, Durban), rapid increase and decline (Toamasina, Maputo, Cape Town), but also decline and subsequent growth (Port Elizabeth). When only two adjacent years are included one could also observe drastic decline (Maputo), moderate decline (Nacala), and recent growth (Walvis Bay).
When considered in relative rather than absolute terms, we also can observe a general reduction of the relative centrality (table 5). The maximum score of Singapore was used as a basis for generating relative scores given the port’s leading position in the global container network expressed in betweenness centrality and maritime degree (see Ducruet and Notteboom, 2012). Only Port Elizabeth has experienced an increase of its relative score in the 2006-2011 period, i.e. from 0.03 to 0.08, but this remained rather low compared with the 2.82 of the year 1996. Durban remains the most "relatively central" port of the region, but its relative score has declined from 5.78 to 0.87 and 0.63. Perhaps, long-distance shipping across the BRIC countries (e.g. China-Brazil) in direct calls could explain such a counterintuitive evolution (Ducruet, 2012). This would mean that southern African ports are losing centrality - whatever the measure - compared with what happened elsewhere in the world during the same period of time, namely the China effect and the reinforcement of established hub ports in other regions.
Table 4: The Southern African Port system connectivity in the global network - absolute figures
Country Port Betweenness centrality Eccentricity
1996 2006 2011 1996 2006 2011 Madagascar Antsiranana 82 0.49 Madagascar Mahajanga 1519 0.64 0.51 Madagascar Toamasina 158 1329 40 0.69 0.73 0.73 Madagascar Tolagnaro 0.51 Madagascar Toliary 0.41 Mauritius Mauritius 383 3378 3541 0.78 0.85 0.78 Mozambique Beira 97 0.44 0.74 Mozambique Maputo 1556 16 0.67 0.73 Mozambique Nacala 141 59 0.53 0.74 Mozambique Pemba 1 0.53 Namibia Luderitz 0.70 0.53
Namibia Walvis Bay 1271 4034 0.65 0.85 0.78
South Africa Cape Town 6942 10583 2618 0.88 0.91 0.86
South Africa Durban 4609 11033 10556 0.85 0.90 0.85
South Africa East London 11 1 0.69 0.75 0.66
South Africa Ngqura 131 0.76
South Africa Port Elizabeth 2252 397 1378 0.84 0.85 0.78
17
Table 5: The Southern African Port system connectivity in the global network - in relative terms compared to global leader Singapore
Betweenness centrality (relative to Singapore)
1996 2006 2011 Madagascar Antsiranana 0,01 Madagascar Mahajanga 0,12 Madagascar Toamasina 0,20 0,11 0,00 Madagascar Tolagnaro Madagascar Toliary Mauritius Mauritius 0,48 0,27 0,21 Mozambique Beira 0,01 Mozambique Maputo 0,12 0,00 Mozambique Nacala 0,01 0,00 Mozambique Pemba 0,00 Namibia Luderitz
Namibia Walvis Bay 0,10 0,24
Reunion Reunion 0,08 0,03 0,05
South Africa Cape Town 8,70 0,84 0,16
South Africa Durban 5,78 0,87 0,63
South Africa East London 0,00 0,00
South Africa Ngqura 0,01
South Africa Port Elizabeth 2,82 0,03 0,08
South Africa Richards Bay 0,00
6. Discussion and Conclusion
This article provided an analysis of the evolution of the Southern African container port system in the global maritime shipping network over the period 1996 and 2006 and 2011. Given the significant and rapid political and economic changes in the region during this period, coupled with significant changes globally in port hierarchies and liner service configurations, our central hypothesis was that Southern Africa has moved from a remote shipping region to a slightly more central shipping region in the global network.
In order to test our hypothesis, we first examined existing literature on factors influencing port hierarchy and in doing so developed a theoretical framework on the (four) most salient factors. Given that our focus was principally aligned to geographical factors (peripherality) our investigation to confirm or refute our hypothesis was based on graph theory and network analysis. Applying the graph measures on the regional port system we note an increasing complexity and densification of the network (with the emergence of new regional ports). In terms of regional evolution, however, the concentration and then subsequent deconcentration on nodes and links indicate that the network is evolving towards a more centralized configuration locally. With respect to global connectivity, results from the graph theory indicators refute our hypothesis. Despite the robust increases in container throughput, the
18
upward trend in vessel sizes calling at the ports, significant port infrastructural investments and a generally more stable political environment, Southern African ports have become more distant in the global network. There are in effect less direct connections to the region (global direct links). This was most evident in the betweenness centrality results of the Southern African ports, relative to the port of Singapore over the three periods of observation. Such results somewhat recall earlier ones obtained from similar methods applied to the Northeast Asian liner shipping network, where Chinese ports experience rapid and tremendous traffic growth but with no equivalent increase of their centrality in the network (Ducruet et al., 2010), mostly due to their domestic role of gateways or sea-river transhipment hubs connecting the hinterland, while Busan or Hong Kong maintained their polarization as established hubs.
In principle, continued political stability and a stronger impact of free trade agreements such as the EU trade liberalization schedules and India-Brazil-South Africa (IBSA), should translate into incremental container volumes7 as well as increased direct vessel calls to the region. These mainly demand driven initiatives are however ongoing. As such the impact has not been completely realized. In addition, these demand side initiatives need to be complemented with supply side commitment from Southern African ports. Such commitments include more competitive tariffs and greater service efficiencies in order to entice a higher number of direct calls and adjust Southern Africa’s position in the global port hierarchy (see ‘Market factors’ in the framework on factors influencing port hierarchy). In the last quarter of 2013, Namibian, South African and Mozambique (Maputo) ports entered into co-operation agreements whereby these ports would work more closely together in order to lift the operational performances of the continent’s ports. This is indeed a stepping stone towards regionally aligned operational improvements which could entice shipping lines to make more direct calls. The impact of such co-operation on other competitive factors such as port tariffs (for example) however is unclear. Will extensive co-operation between Southern African ports render them less competitive and in effect perpetuate the regions peripherally? Further research in this field could focused on the effect of regional port co-operation agreements on the region’s ports position in the global network.
Bibliography
Lloyd's List Intelligence. (2013, July 10). Retrieved December 27, 2013, from Lloyd's List
Containerisation International:
http://www.lloydslist.com/ll/sector/containers/article425888.ece
Africa, B. D. (2013, December 24). The fifth BRICS summit . Retrieved December 24, 2013, from Background: http://www.brics5.co.za/
Ball, R. (1996). Local sensitivities and the represenation of peripherality. Journal of Transport
Geography Vol 4 no 1, 27-36.
Behrens, K., Gaigne, C., Gottaviano, G., & Thisse, J. (2006). Is remoteness a locational disadvantage? Journal of Economic Geography, Vol. 6 , 347-368.
19 Brandes, U. (2001). A Faster Algorithm for Betweenness Centrality. The Journal of Mathematical
Sociology 25, 163-177.
Chen, T., Lee, P., & Notteboom, T. (2013). Shipping line dominance and freight rate practices on trade routes: the case of the Far East-South Africa trade. Int. J. Shipping and Transport
Logistics, Vol. 5, No. 2, 155-173.
De Langen, P., & Van der Lugt, L. (2007). Governance structures of Port Authorities in the Netherlands. Research in Transport Economics 17, 109-137.
Ducruet, C. (2008). Hub dependence in constrained economies: The case of North Korea.
Maritime Policy and Management, 35(4), 374-388.
Ducruet, C. (2012) The polarization of global container flows by interoceanic canals, Paper presented at the International Conference on Interoceanic Canals and World Seaborne
Trade: Past, Present, and Future, Royal Academy for Overseas Sciences, Brussels, June
7-8.
Ducruet, C. & Lugo, I. (2013) Structure and dynamics of transportation networks: Models, concepts, and applications. In J.P. Rodrigue, T. Notteboom & J. Shaw, The SAGE Handbook
of Transport Studies (pp. 347-364), SAGE Publications Ltd.
Ducruet, C., Notteboom, T. & De Langen, P. (2009) Revisiting inter-port relationships under the New Economic Geography research framework. In T. Notteboom, C. Ducruet & P. De Langen, Ports in Proximity: Competition and Coordination among Adjacent Seaports (pp. 11-27), Aldershot: Ashgate.
Ducruet, C., & Notteboom, T. (2012). Developing Liner Service Networks in Container Shipping. In D. Song, & P. Panayides, Maritime Logistics: A complete guide to effective shipping and
port management (pp. 77-100). Londen: Kogan Page.
Ducruet, C., Lee, S.W., & Ng, A.K.Y. (2010). Centrality and vulnerability in liner shipping networks: Revisiting the Northeast Asian port hierarchy. Maritime Policy and
Management 37, 17–36.
Fagerholt, K. (2004). Designing optimal routes in a liner shipping problem. Maritime Policy and
Management 31(4), 259-268.
Feng, L., & Notteboom, T. (2013). Peripheral challenge by Small and Medium Sized Ports (SMPs) in Multi-Port Gateway Regions: the case study of northeast of China. Polish Maritime
Research 20, 55-66.
Fleming, Y., & Hayuth, Y. (1994). Spatial Characteristics of Transportation Hubs: Centrality and Intermediacy. Journal of Transport Geography, 2(1), 3-18.
Fraser, D., & Notteboom, T. (2012). Gateway and hinterland dynamics: The case of the Southern African Port System. African Journal of Business Management Vol.6 (44), 10807-10825. Fremont, A. (2007). Global maritime networks The case of Maersk. Journal of Transport
20 Fujita, M. & Mori, T. (1996). The role of ports in the making of major cities: Self-agglomeration
and hub-effect. Journal of Development Economics 49, 93–120.
Hall, P., & Jacobs, W. (2010). Shifting Proximities: The Maritime Ports Sector. Regional Studies,
Vol. 44.9, 1103–1115.
Jacobs, W. (2007, September 11). Political Economy of Port Competition: Institutional Analyses of Rotterdam, Southern California and Dubai. Political Economy of Port Competition. Nijmegen, The Netherlands: Academic Press Europe - Nijmegen.
Kaluza, P., Kolzsch, A., Gastner, M., & Blasius, B. (2010). The Complex Network of Global Cargo Ship Movements. Journal of the Royal Society Interface 7(48), , 1093-1103.
Lafourcade, M. & Thisse, J.F. (2011). New Economic Geography: The role of transport costs, in De Palma, A., Lindsey, R., Quinet, E. & Vickerman, R. (eds.), Handbook of Transport Economics, Cheltenham: Edward Elgar Publishing Ltd., pp. 67-96.
Laxe, F., Seoane, M., & Montes, C. (2012). Maritime degree, centrality and vulnerability: port hierarchies and emerging areas in containerized transport (2008–2010). Journal of
Transport Geography 24, 33–44.
Lee, S., Song, D., & Ducreuet, C. (2008). The spatial evolution in global hubport cities. Geoforum, 372-385.
Lirn, T., Thanopoulou, H., Beynon, M., & Beresford, A. (2004). An application of AHP on transhipment port selection: A global perspective. . Maritime Economics and Logistics,
6(1), 70–91.
Merk, O. (2013) The competitiveness of global port-cities. Synthesis Report, Paris: OECD. Ncube, M., Lufumpa, C., & Kayizzi-Mugerwa, S. (2011, April 20). The Middle of the
Pyramid:Dynamics of the Middle Class in Africa. Market Brief, African Development Bank, pp. 1-24.
Ng, A. (2006). Assessing the attractiveness of ports in the North European container transhipment market: An agenda for future research in port competition. Maritime
Economics and Logistics, 8(3), 234-250.
Notteboom, T. (1997). Concentration and load centre Development in the European container Port System. Journal of Trompon Geography Vol. 5, No. 2, 99- 115.
Notteboom, T. (2009). Path Dependency and Contingency in the Development of Multi-Port Gateway Regions and Multi-Port Hub Regions. In C. Ducreuet, N. T, & d. L. P, Ports in
Proximity: Competition and co-ordination among adjacent seaports. (pp. 55-72). Surrey:
Ashgate.
Notteboom, T. (2010a). From multi-porting to a hub port configuration: the South African container port system in transition. International Journal of Shipping and Transport
21 Notteboom, T. (2010b). Concentration and the formation of multi-port gateway regions: An
update. Journal of Transport Geography 18, 567-583.
Notteboom, T. (2012). Towards a new intermediate hub region in container shipping? Relay and interlining via the Cape route vs. the Suez route. Journal of Transport Geography 22 , 164–178.
Notteboom, T., & Rodrigue, J. (2005). Port regionalization: towards a new phase in Port Development. Maritime Policy & Management, 297-313.
Ntibarekerwa, J. (2010, April 28). www.mcli.co.za/mcli-web/events/2010/28apr2010/011.pdf. Retrieved August 26, 2013, from www.mcli.co.za: http://www.mcli.co.za/mcli-web/events/2010/28apr2010/011.pdf
Parola, F., & Veenstra, A. (2008). The spatial coverage of shipping lines and container terminal operators. Journal of Transport Geography 16, 292–299.
Raballand, G., Refas, S., Beuran, M., & Isik, G. (2012). Why Does Cargo Spend Weeks in
Sub-Saharan African Ports? Washington DC: Worldbank.
Robinson, R. (2002). Ports as elements in value-driven chain systems: the new paradigm.
Maritime Policy and Management 29, 241-255.
Rodrigue, J., & Notteboom, T. (2010). Foreland-based regionalization: Integrating intermediate hubs with port Hinterlands. Research in Transport Economics 27, 19-29.
Slack, B. J. (2002). The challenge of peripheral ports: an Asian perspective. GeoJournal Volume
56, 159–166.
Song, D. (2003). Port Co-operation in Concept and Practice. Maritime Policy and Management
30(1), 29-44.
Stern E. & Hayuth Y. (1984) Developmental effects of geopolitically located ports. in Hoyle B.S., Hilling D. (eds.) Seaport Systems and Spatial Change (Chichester: Wiley), pp. 239-249. Swyngedouw, E. (1992). Territorial organization and the space/technology nexus. Transactions
of the Institute of British Geographers, 17, , 417-433.
UNCTAD. (2012). UNCTAD Handbook of Statistics 2012. New York: United Nations Publications. Wilmsmeier, G., & Notteboom, T. (2010). Determinants of liner shipping network configuration:
a two region comparison. Geojournal, 76 (3), 213–28.
Wu, & J. (2011). Between the Centre and the Periphery: the development of port trade in Darwin, Australia . Australian Geographer, 42(3), 273-288.
Zohil, J., & Prijon, M. (1999). The MED rule: the interdependence of container throughput and transhipment volumes in the Mediterranean ports. Maritime Policy and Management, 26