HAL Id: cea-02509736
https://hal-cea.archives-ouvertes.fr/cea-02509736
Submitted on 17 Mar 2020
HAL is a multi-disciplinary open access
archive for the deposit and dissemination of sci-entific research documents, whether they are pub-lished or not. The documents may come from teaching and research institutions in France or abroad, or from public or private research centers.
L’archive ouverte pluridisciplinaire HAL, est destinée au dépôt et à la diffusion de documents scientifiques de niveau recherche, publiés ou non, émanant des établissements d’enseignement et de recherche français ou étrangers, des laboratoires publics ou privés.
Preliminary Analysis of The FLUOLE-2 Experiment
S. Bourganel, J. Di-Salvo, A. Gruel, B. Geslot, N. Thiollay, M. Soldevila
To cite this version:
S. Bourganel, J. Di-Salvo, A. Gruel, B. Geslot, N. Thiollay, et al.. Preliminary Analysis of The FLUOLE-2 Experiment. NENE2015 - 24th International Conference Nuclear Energy for New Europe, Sep 2015, Portoroz, Slovenia. �cea-02509736�
Preliminary Analysis of The FLUOLE-2 Experiment
Stéphane Bourganel
DEN/DANS/DM2S/SERMA – CEA Saclay Bâtiment 470 – PC 57
91191 Gif sur Yvette Cedex, France [email protected]
Jacques Di-Salvo, Adrien Gruel, Benoît Geslot, Nicolas Thiollay DEN/CAD/DER/SPEx – CEA Cadarache
Bâtiment 238
13108 Saint Paul lez Durance Cedex, France [email protected], [email protected]
Michel Soldevila
DEN/DANS/DM2S/SERMA – CEA Saclay Bâtiment 470 – PC 57
91191 Gif sur Yvette Cedex, France [email protected]
ABSTRACT
The purpose of this paper is to present a general overview of the FLUOLE-2 experiment as well as a preliminary analysis. The calculation scheme used to carry out this work is described. It is based on the TRIPOLI-4® 3D Monte Carlo code, and the DARWIN/PEPIN2 depletion code. TRIPOLI-4® is used to calculate the neutron source distribution in the core, the neutron propagation through the different structures, and the fission rate values inside fission chambers. The DARWIN/PEPIN2 code is dedicated to dosimeter activation calculations.
The experimental database is provided by gamma scanning analysis as well as dosimeter activity measurements and fission chamber results. The gamma scanning was carried out on 176 fuel rods (UOX and MOX). It leads to the validation of the neutron source in the core. Dosimeter activity measurements provide information concerning the neutron attenuation in the different parts of the experimental device. And fission chamber data consist of fission rate measurements. Results concerning these three kinds of measurements are presented and discussed in this paper.
1 INTRODUCTION
The FLUOLE-2 [1] program is a benchmark-type experiment dedicated to neutron attenuation analysis with the aim of improving the TRIPOLI-4® [2] Monte Carlo code validation. This two-year program has been developed by CEA (Commissariat à l’Energie Atomique et aux Energies Alternatives) to be representative of 900 and 1450 MWe Pressurized Water Reactors. For that purpose, different stainless steel structures have been designed and appropriately positioned inside the EOLE facility [3].
404.2
Proceedings of the International Conference Nuclear Energy for New Europe, Portorož, Slovenia, September 14 ̶ 17, 2015
EOLE is a pool type zero power reactor, composed of a cylindrical aluminum vessel with an over structure of stainless steel, able to contain various types of core and related structures. This critical mock-up is located at Cadarache CEA center.
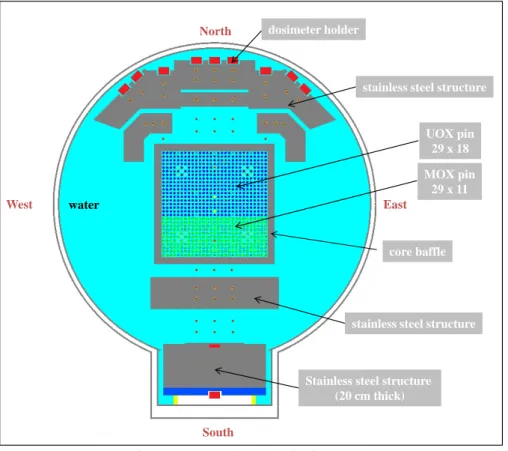
To carry out the FLUOLE-2 experiment, the core has been designed as a 29×29 pins square lattice with 29×18 UOX fuel rods in the North, and 29×11 MOX fuel rods in the South, as shown in Figure 1. This configuration represents the first stage of the FLUOLE-2 experiment. In a second stage, UOX and MOX fuel rods will be reversed so that UOX fuel rods will be in the South, and MOX fuel rods in the North. Therefore, North structures as well as South structures will be irradiated by neutrons from both UOX and MOX fuel.
Figure 1: FLUOLE-2 device
Different kinds of dosimeters (cobalt, gold, tin, rhodium, indium, iron, nickel, titanium, aluminum, and vanadium) as well as different kinds of fission chambers (uranium 235, 238, and neptunium 237) were irradiated inside and outside the core.
This article presents some analyses linked to the first stage of the FLUOLE-2 experiment. After a description of the calculation scheme used to carry out this work, the validation of the calculated neutron sources in the core is presented. Then, dosimetry and fission chamber studies are analyzed.
2 CALCULATION SCHEME
The calculation scheme is based on the TRIPOLI-4® 3D Monte Carlo code, and the
DARWIN/PEPIN2 depletion code.
TRIPOLI-4® [2] is a 3D transport code using full pointwise cross section data. It is dedicated to radiation protection and shielding, nuclear criticality safety, fission and fusion reactor design, and nuclear instrumentation. It is used as a reference tool by CEA, EDF, and several other industrial or institutional partners. In this study, TRIPOLI-4® is used to calculate
dosimeter holder
stainless steel structure
UOX pin 29 x 18
stainless steel structure
Stainless steel structure (20 cm thick) North South East West core baffle MOX pin 29 x 11 water
the neutron source distribution in the core, the neutron propagation through the different structures, and the fission rate values inside fission chambers.
DARWIN/PEPIN2 [4] solves Bateman’s generalized differential equations governing the time dependence of isotope concentrations. This code may be coupled with the TRIPOLI-4® code. In this analysis, the DARWIN/PEPIN2 code is dedicated to dosimeter activation
calculations.
All simulation tools used to carry out the FLUOLE-2 analysis presented in this article are developed by CEA, with financial support of EDF (Electricité De France) and AREVA. Nuclear data used by these codes are common, with an international reputation. They are based upon the JEFF3.1.1 [5] and the IRDF2002 [6] cross section libraries to provide a uniform and consistent set of computational codes.
3 NEUTRON SOURCE DISTRIBUTION IN THE CORE
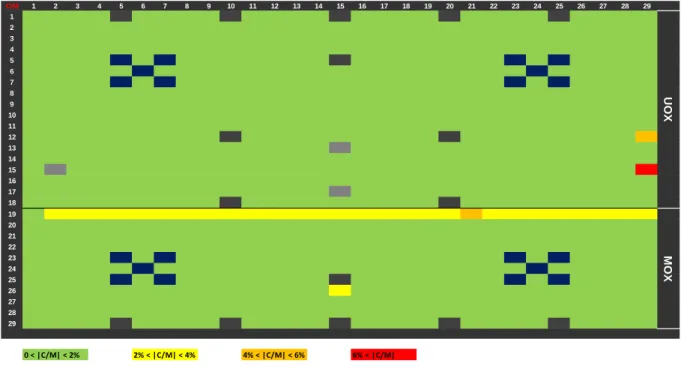
The spatial distribution of neutron sources in the core is calculated using a TRIPOLI-4® simulation: neutron production (𝜈𝜈 Σ𝑓𝑓 𝜙𝜙) is calculated axially and radially for each fuel rod (UOX and MOX), and for each fissile isotope. Various parameters are taken into account such as the boron concentration in water, the MOX composition, and the control rod position. The validation of the calculated spatial distribution of the neutron sources is based on a comparison with experimental measurements. For that purpose, gamma scanning measurements were carried out for 176 fuel rods (106 UOX and 70 MOX fuel rods). Figure 2 presents the order of magnitude of the ratio between these experimental results and calculated results.
Figure 2: neutron source distribution validation
The majority of C/E ratio (in green in Figure 2) remains between 0.98 and 1.02. In other words, these ratios are lowers than two standard-deviations (uncertainty associated to C/E ratios is 1% for one standard-deviation). A couple of C/E ratio is slightly greater than two standard-deviations. These results are mostly located on the UOX/MOX interface. Finally, only one C/E ratio is very low (0.78). It is located in the East, in the immediate vicinity of the
C/M 1 2 3 4 5 6 7 8 9 10 11 12 13 14 15 16 17 18 19 20 21 22 23 24 25 26 27 28 29 1 2 3 4 5 6 7 8 9 10 11 12 13 14 15 16 17 18 19 20 21 22 23 24 25 26 27 28 29 0 < |C/M| < 2% 2% < |C/M| < 4% 4% < |C/M| < 6% 6% < |C/M| U OX M OX
404.4
Proceedings of the International Conference Nuclear Energy for New Europe, Portorož, Slovenia, September 14 ̶ 17, 2015
control rod. The movement of the control rod during the irradiation is not taken into account in the simulation. That explains this result.
The neutron source distribution calculated in the core is validated by the gamma scanning measurements, in UOX fuel rods as well as in MOX fuel rods.
4 DOSIMETRY ANALYSIS
To validate the calculation of neutron attenuation through water and stainless steel structures, a large number of dosimeters was located and irradiated in the overall FLUOLE-2 device. Activity dosimeters were measured thanks to high efficiency HPGe detectors equipping the MADERE platform at CEA/Cadarache [7]. Some results concerning dosimetry analysis from the FLUOLE-2 experiment are presented and discussed in this chapter. Results are divided into two distinctive categories: dosimeters irradiated in-core and dosimeters irradiated ex-core.
4.1 In-core dosimeters
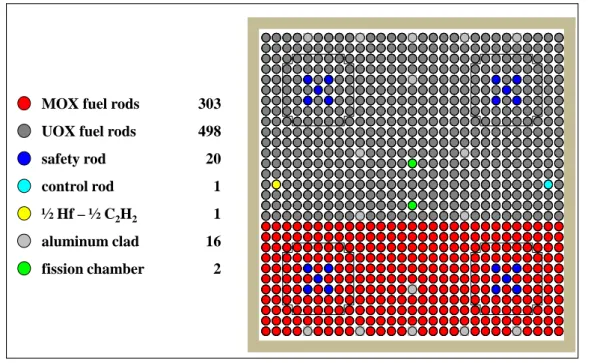
The core loading is presented in Figure 3. Dosimeters were located inside the aluminum clads (in light grey), at mid-core. These sixteen positions were arranged to be symmetrical with respect to the East/West axis.
Figure 3: in-core dosimeters
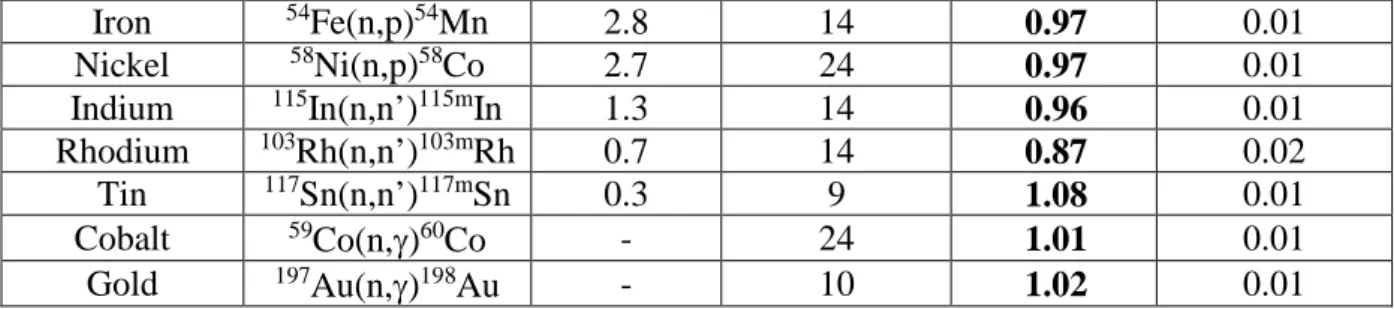
Dosimeter activation was organized into three irradiations. Each time, the irradiation power was approximately 200 Watt during four hours. The C/E results are gathered in Table 1. The comparison is based on activity values.
Table 1: C/E results for in-core dosimeters
Dosimeter Reaction Threshold
(MeV)
Number of
measures Mean C/E
Statistical dispersion Vanadium 51V(n,α)48Sc 11.0 15 0.97 0.03 Aluminum 27Al(n,α)24Na 7.3 15 1.00 0.01 Iron 56Fe(n,p)56Mn 6.1 14 0.99 0.01 Titanium 46Ti(n,p)46Sc 4.4 15 0.98 0.02
MOX fuel rods 303
UOX fuel rods 498
safety rod 20
control rod 1
½ Hf – ½ C2H2 1
aluminum clad 16
Iron 54Fe(n,p)54Mn 2.8 14 0.97 0.01 Nickel 58Ni(n,p)58Co 2.7 24 0.97 0.01 Indium 115In(n,n’)115mIn 1.3 14 0.96 0.01 Rhodium 103Rh(n,n’)103mRh 0.7 14 0.87 0.02 Tin 117Sn(n,n’)117mSn 0.3 9 1.08 0.01 Cobalt 59Co(n,γ)60Co - 24 1.01 0.01 Gold 197Au(n,γ)198Au - 10 1.02 0.01
C/E results are close to 1.00 which confirms the calculated neutron source distribution in the core. However, rhodium and tin dosimeters are exception to this trend.
Measured activities for rhodium dosimeters are subject to some uncertainties: X-rays (around 20 keV) emitted by 103mRh are largely absorbed by the dosimeter itself though it is very thin (50 µm). This involves significant corrective factors. Furthermore, the X-rays emission probabilities are known with an uncertainty of 7%. The difference between measurement and calculation for rhodium dosimeters is mostly explained by these two reasons.
As regards tin dosimeters, the activity measurement doesn't have a particular technical difficulty. But the inelastic scattering cross section for 117Sn is probably not well known. These data are available neither in the International Reactor Dosimetry File (IRDF2002) nor in the new Dosimetry library IRDFF [8] because the use of tin dosimeters is fairly new. For the FLUOLE-2 analysis, inelastic scattering cross section data for 117Sn come from the
JENDL/A-96 nuclear library which performs a little better than other libraries (EAF, JEFF).
4.2 Ex-core dosimeters
Ex-core dosimeters were irradiated during one single cycle in the North and South sectors. The dosimeter locations are presented by red dots and red elements in Figure 1. The irradiation power was approximately 800 Watt during five hours. The C/E results are gathered in Table 2.
Table 2: C/E results for ex-core dosimeters
Dosimeters Reaction Threshold
(MeV)
Number of
measures Mean C/E
Statistical dispersion Vanadium 51V(n,α)48Sc 11.0 2 0.98 0.00 Aluminum 27Al(n,α)24Na 7.3 2 1.03 0.04 Titanium 46Ti(n,p)46Sc 4.4 2 1.00 0.02 Iron 54Fe(n,p)54Mn 2.8 59 1.03 0.04 Nickel 58Ni(n,p)58Co 2.7 67 1.03 0.02 Indium 115In(n,n’)115mIn 1.3 15 0.99 0.02 Rhodium 103Rh(n,n’)103mRh 0.7 2 0.88 0.02 Tin 117Sn(n,n’)117mSn 0.3 2 1.07 0.02 Cobalt 59Co(n,γ)60Co - 2 1.02 0.02
C/E results are similar to those obtained with in-core dosimeters: C/E values are close to 1.00 excepted for rhodium and tin dosimeters. The reasons for these two exceptions are explained at the end of section 4.1.
4.3 Synthesis
404.6
Proceedings of the International Conference Nuclear Energy for New Europe, Portorož, Slovenia, September 14 ̶ 17, 2015
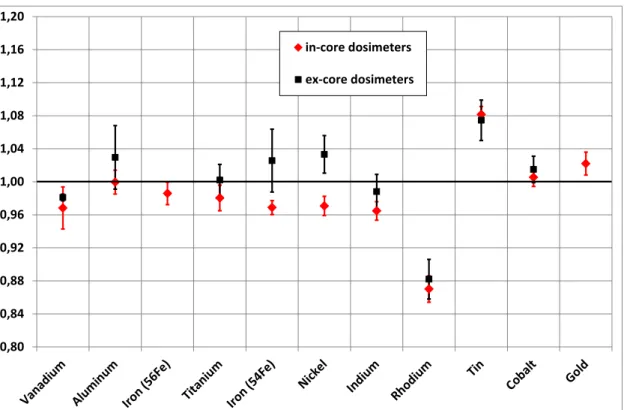
Figure 4: dosimeter analysis: synthesis
Generally, C/E values are close to 1.00 excepted for rhodium and tin dosimeters. It is worth noting that the mean uncertainty associated to C/E values is about 3.4%.
C/E values are slightly higher for ex-core dosimeters, but the gap remains low. The attenuation of neutron through water and stainless steel structures is thus validated. We still do not have enough information to understand this gap. Verification shall be made to check if this trend continues with the second stage of the FLUOLE-2 experiment.
5 FISSION CHAMBER ANALYSIS
A fission chamber analysis is presented in this chapter. A set of four fission chambers was inserted in the core, into four locations as shown in Figure 5. During four irradiations, each fission chamber was irradiated in the four possible locations.
Figure 5: fission chamber loading 0,80 0,84 0,88 0,92 0,96 1,00 1,04 1,08 1,12 1,16 1,20 in-core dosimeters ex-core dosimeters C05-15 C25-15 C01-15 C29-15
Three kinds of fission chamber were used in this study: • 235U (1 fission chamber)
• 238U (1 fission chamber)
• 237Np (2 fission chambers)
The aim of this study is to compare the calculated fission rate for each fission chamber versus measured fission rate. Pulse mode acquisitions were performed with irradiations of 30 Watt during 10 minutes. Experimental and calculated results are given relative to the “C05-15” location (see Figure 5). Results are presented in Table 3. The uncertainty associated to measurements is 1%, and the statistical uncertainty (TRIPOLI-4®) is about 0.1%. When using
238U fission chambers, a part of the signal is due to impurities of 235U. This part is subtracted
by calculation knowing the isotopic composition of the sensor.
Table 3: (C-E)/E results for fission chambers
Fission chambers Threshold C01-15 C05-15 C25-15 C29-15
235U - -2.2% 0.0% 1.3% 5.5%
238U 1.4 MeV 0.2% 0.0% 2.4% 2.3%
237Np (mean values) 0.6 MeV 1.0% 0.0% 2.5% 1.8%
Good results are obtained for this fission chamber analysis. In particular, 238U and 237Np fission chamber (high energy) give similar results. A gap is more pronounced for the 235U fission chamber but it remains satisfactory. This could be due to an uncertainty on different parameters such as the boron concentration in water. This issue will be investigated when the two stages of FLUOLE-2 experiment is completed.
6 CONCLUSION
A preliminary analysis of the FLUOLE-2 experiment is presented in this article. Very satisfactory results have been obtained with the different analysis conducted. A rigorous preparation and a strong control of uncertainties and manufactory tolerances explain the quality of the results.
The neutron source distribution calculated in the core with the TRIPOLI-4® code is confirmed by the gamma scanning measurements, in UOX fuel rods as well as in MOX fuel rods.
The attenuation of neutron through water and stainless steel structures is validated by the dosimetry used in the FLUOLE-2 experiment. Small deviations have been observed between results associated to in-core and ex-core dosimeters. The achievement of the second stage of the FLUOLE-2 experiment will show if this trend continues.
ACKNOWLEDGMENTS
The authors acknowledge EDF for the support to this work, and the team in charge of the exploitation and experimentation at the EOLE facility.
REFERENCES
[1] N. Thiollay et al, “FLUOLE-2: an Experiment for PWR Pressure Vessel Surveillance”, Fifteenth International Symposium on Reactor Dosimetry (ISRD 15), Aix-en-Provence, France, May 18-23, 2014
404.8
Proceedings of the International Conference Nuclear Energy for New Europe, Portorož, Slovenia, September 14 ̶ 17, 2015
[2] “TRIPOLI-4 version 8.1, 3D general purpose continuous energy Monte Carlo Transport code”, NEA-1716 TRIPOLI-4 VERS. 8.1,
https://www.oecd-nea.org/tools/abstract/detail/nea-1716
[3] JC. Bosq, M. Antony, J. Di-Salvo, J.C. Klein, N. Thiollay, P. Blaise, P. Leconte, “The use of EOLE and MINERVE critical facilities for the Generation 3 light water reactors studies”, Proc. Of ICAPP 2011, Nice, France, May 2-5, 2011
[4] A. Tsilanizara et al, “Experimental validation of the DARWIN2.3 package for fuel cycle applications”, PHYSOR 2012, Knoxville, Tennessee, USA, April 15-20, 2012.
[5] A. Santamarina, D. Bernard, Y. Rugama, “The JEFF-3.1.1 nuclear data library”, JEFF Report 22 OECD/NEA.
[6] “International reactor Dosimetry File 2002 (IRDF2002)”, Technical reports series No. 452, IAEA
[7] V. Sergeyeva, C. Domergue, C. Destouches, J-M. Girard, H. Philibert, J. Bonora, N. Thiollay, “Improvements on low level activity gamma measurements and X-ray spectrometry at the CEA-MADERE measurement platform”, Fifteenth International Symposium on Reactor Dosimetry (ISRD 15), Aix-en-Provence, France, May 18-23, 2014.