HAL Id: cea-02882575
https://hal-cea.archives-ouvertes.fr/cea-02882575
Submitted on 26 Jun 2020
HAL is a multi-disciplinary open access
archive for the deposit and dissemination of
sci-entific research documents, whether they are
pub-lished or not. The documents may come from
teaching and research institutions in France or
abroad, or from public or private research centers.
L’archive ouverte pluridisciplinaire HAL, est
destinée au dépôt et à la diffusion de documents
scientifiques de niveau recherche, publiés ou non,
émanant des établissements d’enseignement et de
recherche français ou étrangers, des laboratoires
publics ou privés.
High-resolution, 3D radiative transfer modelling
S. Viaene, A. Nersesian, J. Fritz, S. Verstocken, M. Baes, S. Bianchi, V.
Casasola, L. Cassarà, C. Clark, J. Davies, et al.
To cite this version:
S. Viaene, A. Nersesian, J. Fritz, S. Verstocken, M. Baes, et al.. High-resolution, 3D radiative transfer
modelling: IV. AGN-powered dust heating in NGC 1068. Astronomy and Astrophysics - A&A, EDP
Sciences, 2020, 638, pp.A150. �10.1051/0004-6361/202037476�. �cea-02882575�
https://doi.org/10.1051/0004-6361/202037476 c ESO 2020
Astronomy
&
Astrophysics
High-resolution, 3D radiative transfer modelling
IV. AGN-powered dust heating in NGC 1068
S. Viaene
1,2, A. Nersesian
3,4,1, J. Fritz
5, S. Verstocken
1, M. Baes
1, S. Bianchi
6, V. Casasola
7,6, L. Cassarà
8,3,
C. Clark
9, J. Davies
10, I. De Looze
1,11, P. De Vis
10, W. Dobbels
1, M. Galametz
12, F. Galliano
12, A. Jones
13,
S. Madden
12, A. Mosenkov
14,15, A. Trcka
1, E. M. Xilouris
3, and N. Ysard
131 Sterrenkundig Observatorium, Universiteit Gent, Krijgslaan 281, 9000 Gent, Belgium
e-mail: [email protected]
2 Centre for Astrophysics Research, University of Hertfordshire, College Lane, Hatfield AL10 9AB, UK
3 National Observatory of Athens, Institute for Astronomy, Astrophysics, Space Applications and Remote Sensing, Ioannou Metaxa
and Vasileos Pavlou GR-15236, Athens, Greece
4 Department of Astrophysics, Astronomy & Mechanics, Faculty of Physics, University of Athens, Panepistimiopolis, GR15784
Zografos, Athens, Greece
5 Instituto de Radioastronomía y Astrofísica, UNAM, Campus Morelia, A.P. 3-72, 58089 Morelia, Mexico 6 INAF – Osservatorio Astrofisico di Arcetri, Largo E. Fermi 5, 50125 Firenze, Italy
7 INAF – Istituto di Radioastronomia, Via P. Gobetti 101, 40129 Bologna, Italy
8 INAF – Istituto di Astrofisica Spaziale e Fisica cosmica, Via A. Corti 12, 20133 Milano, Italy 9 Space Telescope Science Institute, 3700 San Martin Drive, Baltimore, Maryland 21218, USA 10 School of Physics and Astronomy, Cardiff University, The Parade, Cardiff CF24 3AA, UK
11 Department of Physics and Astronomy, University College London, Gower Street, London WC1E 6BT, UK
12 Laboratoire AIM, CEA/DSM – CNRS – Université Paris Diderot, IRFU/Service d’Astrophysique, CEA Saclay, 91191
Gif-sur-Yvette, France
13 Institut d’Astrophysique Spatiale, CNRS, Univ. Paris-Sud, Université Paris-Saclay, Bât. 121, 91405 Orsay Cedex, France 14 Central Astronomical Observatory of RAS, Pulkovskoye Chaussee 65/1, 196140 St. Petersburg, Russia
15 St. Petersburg State University, Universitetskij Pr. 28, 198504 St. Petersburg, Stary Peterhof, Russia
Received 10 January 2020/ Accepted 30 April 2020
ABSTRACT
The star formation rate and the mass of interstellar medium (ISM) have a high predictive power for the future evolution of a galaxy. Nevertheless, deriving such properties is not straightforward. Dust emission, an important diagnostic of star formation and ISM mass throughout the Universe, can be powered by sources unrelated to ongoing star formation. In the framework of the DustPedia project we set out to disentangle the radiation of the ongoing star formation from that of the older stellar populations. This is done through detailed 3D radiative transfer simulations of face-on spiral galaxies. We take special care in modelling the morphological features present for each source of radiation. In this particular study, we focus on NGC 1068, which in addition contains an active galactic nucleus (AGN). The effect of diffuse dust heating by an AGN (beyond the torus) has so far only been investigated for quasars. This additional dust heating source further contaminates the broadband fluxes that are used by classic galaxy modelling tools to derive physical properties. We aim to fit a realistic model to the observations of NGC 1068 and quantify the contribution of the several dust-heating sources. Our model is able to reproduce the global spectral energy distribution of the galaxy. It matches the resolved optical and infrared images fairly well, but deviates in the UV and the submillimetre (submm). This is partly due to beam smearing effects, but also because the input dust distribution is not sufficiently peaked in the centre. We find that AGN contamination of the broadband fluxes has a strong dependency on wavelength. It peaks in the mid-infrared, drops in the far-infrared, and then rises again at submm wavelengths. We quantify the contribution of the dust-heating sources in each 3D dust cell and find a median value of 83% for the star formation component. The AGN contribution is measurable at the percentage level in the disc, but quickly increases in the inner few hundred parsecs, peaking above 90%. This is the first time the phenomenon of an AGN heating the diffuse dust beyond its torus is quantified in a nearby star-forming galaxy. NGC 1068 only contains a weak AGN, meaning this effect could be stronger in galaxies with a more luminous AGN. This could significantly impact the derived star formation rates and ISM masses for such systems.
Key words. galaxies: individual: NGC 1068 – galaxies: ISM – dust, extinction
1. Introduction
Dust can be found in all star-forming galaxies, and even in a sig-nificant fraction of early-type galaxies (De Looze et al. 2010;
Smith et al. 2012a;di Serego Alighieri et al. 2013). Dust grains play a vital role in the formation of stars by regulating the gas tem-perature, catalysing the creation of molecules such as H2and CO,
and subsequently shielding them. Due to this close connection
with both stars and gas, dust is increasingly used as a tool to study the evolution of galaxies through time (seeGalliano et al. 2018, for a review). Dust and gas are strongly intertwined in the inter-stellar medium (ISM) and usually follow a metallicity-dependent gas-to-dust ratio (Lisenfeld & Ferrara 1998; Sandstrom et al. 2013;Rémy-Ruyer et al. 2014;De Vis et al. 2019;Casasola et al. 2020). As such, dust emission can not only be used to trace its own mass, but also the total mass of the ISM (Eales et al. 2012;
Scoville et al. 2014;Hughes et al. 2017). Accurate measurements of dust mass are an important extra metric for evolutionary stud-ies of ISM in galaxstud-ies, as neutral gas is hard to detect beyond the local Universe, and molecular gas tracers rely on empirical con-version factors (Bolatto et al. 2013). The most obvious effect of dust is of course its capacity to absorb and scatter UV and opti-cal light. In the loopti-cal Universe, roughly one-third of starlight is absorbed by dust grains (Skibba et al. 2011;Viaene et al. 2016;
Bianchi et al. 2018). This absorbed energy is re-emitted again at mid-infrared (MIR) to millimetre (mm) wavelengths where it can even be observed up to high redshifts with telescopes such as ALMA and Herschel. Dust is therefore also a popular star for-mation tracer across cosmic time (see e.g.da Cunha et al. 2010;
Madau & Dickinson 2014;Casey et al. 2014;Scoville et al. 2015). A big caveat of using dust as a tracer of either ISM mass or the star formation rate (SFR), is the assumed (often linear) con-version of far-infrared (FIR) to submillimetre (submm) emission into either of these quantities. At this point, it becomes impor-tant to understand how dust grains are heated to their equilib-rium temperature. In practice, the most common assumption is that of a single heating source (e.g. star formation) producing a single radiation field, which is then parametrised with a single– average–temperature component. Dust masses can then be esti-mated from a modified blackbody function (Hildebrand 1983;
Bianchi 2013) or a dust emission template (e.g.Dale et al. 2001;
Draine et al. 2014;Jones et al. 2017). However, in reality, dust in galaxies is a mix of grain types and sizes, with multiple temper-atures, and multiple heating sources. A more accurate determi-nation of dust masses (and thus total ISM masses) requires more complex models for the dust emission. Such models also benefit the determination of the SFR from dust emission. In this case, it is important to only count the absorbed energy from new stars that is re-emitted by dust.
The main dust heating sources in galaxies have been quali-tatively derived from correlations of dust emission with SFR or stellar mass tracers (Galametz et al. 2010;Boquien et al. 2011;
Smith et al. 2012b;Bendo et al. 2012;Foyle et al. 2013;Hughes et al. 2014) or from panchromatic models for a galaxy’s spectral energy distribution (SED;Groves et al. 2012;Aniano et al. 2012;
Dale et al. 2012;Mentuch Cooper et al. 2012;Ciesla et al. 2014;
Rémy-Ruyer et al. 2015;Boquien et al. 2016;Viaene et al. 2016). The broadest of such studies was performed byNersesian et al.
(2019) as they modelled the global SED of 814 nearby galaxies of different morphologies.Nersesian et al.(2019) found a wide variety in the individual contributions of dust heating sources, with a significant and sometimes dominant contribution of the old stellar populations. In a dedicated resolved study,Bendo et al.
(2015) mapped the dust heating sources for 24 nearby face-on spiral galaxies, and found that in some galaxies the dust is pre-dominantly heated by the ongoing star formation, while some are heated by the old stellar population. However, most galax-ies again show a mixed heating pattern with energy from both young and older stars contributing to the dust emission.
In a pioneering study by De Looze et al. (2014), high-resolution 3D radiative transfer simulations were used to model the dust heating in M 51. The novelty in this study was to infer realistic, non-axisymmetric distributions for both stars and dust from observed broadband images. De Looze et al.(2014) found strong changes in the dust heating fractions for varying FIR/submm wavelengths, with an overall contribution of 37% from the old stellar populations. A similar model was created for the Andromeda galaxy (M 31) by Viaene et al. (2017), who found that the old stellar populations dominate the dust heating (91% globally), even in the main star-forming ring of
M 31. This effect was attributed to the large and old bulge of Andromeda. Most recently, M33 was also modelled in this way, finding old population heating contributions between 50% and 80% (Williams et al. 2019). In the context of the DustPedia project (Davies et al. 2017), we set up a best-practice frame-work for such radiative transfer modelling and applied it to M 81 (Verstocken et al. 2020) and to a set of nearby barred star-forming spirals (M 83, M 95, M 100 and NGC 1365;Nersesian et al. 2020).
All these studies assume a stellar origin for the energy absorbed by dust. In the radiative transfer models, three stel-lar populations are needed to match the observed panchromatic SED and images: an old (5–12 Gyr) stellar component, a non-ionising (∼100 Myr) component, and a population of ongoing obscured star formation. While this is acceptable for many star-forming spiral galaxies, there is evidence for other sources of dust heating. Dust grains can gain energy by capturing hot elec-trons, protons, or even ions (Jones et al. 2004). In the latter two cases this can also partially destroy a grain (a process called sput-tering). As such, cosmic rays produced by recent supernovae may be a secondary dust heating mechanism following recent star formation. In a similar way, hot gas can produce a flux of energetic electrons which directly heat the dust grains (Bocchio et al. 2013).
Another potential dust heating source is the accretion disc around supermassive black holes. In galaxies hosting an AGN, the accretion disc certainly heats the dusty torus surround-ing it and produces strong MIR emission (see e.g. Fritz et al. 2006). However, higher dust temperatures and anomalously bright nuclear FIR emission are also found for galaxies host-ing an AGN (Wu et al. 2007; Bendo et al. 2012; Kirkpatrick et al. 2012,2015;Verstappen et al. 2013;Roebuck et al. 2016). This circumstantial evidence suggests that the accretion disc may be powerful enough to heat ISM dust beyond the torus.
Schneider et al.(2015) andDuras et al.(2017) investigated this phenomenon using radiative transfer simulations of quasars, and found that the AGN may contribute 30−70% to the heating of diffuse dust. This phenomenon was confirmed through analy-sis of observations of a sample of QSOs bySymeonidis et al.
(2016),Symeonidis(2017). While this may be an extreme case, it shows that AGN can contribute to the FIR-submm SED in galaxies. This effect influences the total mass and SFR estimates of galaxies hosting an AGN, but is not taken into account by SED-fitting models.
The goal of this paper is to address the question of AGN-powered dust heating in the local Universe. We choose to take a quantitative approach to separate the contributions from star formation, old stellar populations, and the AGN. Therefore, we focus on a single galaxy, but construct a detailed model based on 3D radiative transfer simulations. This is the fourth paper in a series of radiative transfer studies on individual galaxies. Within the DustPedia framework, the method was homogenised as much as possible to allow comparisons between the mod-els. Paper I presents a radiative transfer model and dust heating analysis in the grand-design spiral M51 (De Looze et al. 2014). Paper II (Verstocken et al. 2020) is focussed on a streamlined modelling pipeline and its application to the spiral galaxy M81. A sample of barred galaxies was subsequently studied in Paper III (Nersesian et al. 2020). There have been two spin-offs stud-ies targeting the large Local Group galaxstud-ies M31 (Viaene et al. 2017), and M33 (Williams et al. 2019). In the future we will also test this method on simulated galaxies to gain further insight into the dust-heating mechanisms and identify opportunities to improve our method.
This paper focuses on NGC 1068 (M 77), a nearby (D = 10.1 Mpc) Seyfert 2 SAb galaxy (Osterbrock & Martel 1993). This AGN has no broad-line emission features, despite being a nearly face-on (i= 28.1◦) disc galaxy. Instead, optical polarime-try reveals broad reflection lines (Antonucci & Miller 1985). These observations suggest that the accretion disc is obscured by the torus for an observer on Earth (see alsoMarin 2018). Very-long-baseline interferometry (VLBI) measurements of a H2O
megamaser (Greenhill et al. 1996) confirm that the torus is in fact seen edge-on. Recent ALMA observations of the core of NGC 1068 reveal a complex ISM, with the torus being inclined at only 34−66◦at larger radii (García-Burillo et al. 2016). The
orientation of the torus suggests that the accretion disc is in effect beaming its radiation straight into the galactic disc, which makes NGC 1068 a well-suited target to study AGN-powered dust heat-ing. In addition, the galaxy is actively forming stars in its inner regions and hosts a relatively quiescent outer disc (D’Agostino et al. 2018). We can therefore also compare the relative impor-tance of stellar heating mechanisms to each other, and to the AGN contribution.
In Sect.2we describe DustPedia’s panchromatic dataset for NGC 1068. The model preparation based on these data is out-lined in Sect.3. We describe our fitting process in Sect.4and the best-fit high-resolution model in Sect.5. The dust heating in NGC 1068 is analysed in Sect. 6. We finally discuss and sum-marise our findings in Sect.7.
2. Data
This investigation relies mostly on broad-band imaging from the DustPedia1 database (Davies et al. 2017). This comprehensive
database contains the 875 nearby (<40 Mpc) galaxies that were observed by the Herschel Space Observatory. It includes uni-formly reduced PACS (Poglitsch et al. 2010) and SPIRE (Griffin et al. 2010) maps, and broad-band images from major ground and space-based survey telescopes up to the UV. In addition, aperture-matched photometry in the UV-mm is available. For more details on the image processing and photometry we refer toClark et al.(2018).
In particular, for NGC 1068, we make use of UV maps from GALEX (Martin et al. 2005), optical images from SDSS (York et al. 2000), MIR observations from WISE (Wright et al. 2010), and submm data from Herschel (Pilbratt et al. 2010). We do not rely on the standard photometry of DustPedia in this case, as our model focuses on a smaller aperture. We therefore recomputed the photometry measurements based on these new apertures (see Sect.3). The AGN in NGC 1068 is especially bright in the MIR. Images from 3.4 µm till 24 µm are severely distorted by the PSF signature of their respective instruments. This renders any mor-phological study almost impossible in this wavelength domain. We note that the images are not over-exposed in the MIR, mean-ing the integrated flux measurements are still useful and serve as the most important constraint on the AGN model.
There are only two Spitzer-IRAC bands (3.6 µm and 4.5 µm) for NGC 1068 in DustPedia. They unfortunately have strong blooming artefacts and do show signs of an over-exposed centre. We therefore prefer the WISE images, which are of compara-tively much better quality in this case, and cover a wider wave-length range (3.3 µm–22 µm). The Spitzer-MIPS bands do not have artefacts, but are still heavily PSF dominated (especially at 24 µm). Moreover, the PACS bands surpass them in spatial
reso-1 http://dustpedia.astro.noa.gr
lution. For these reasons, we do not include any Spitzer observa-tions in our dataset.
The 2MASS observations (also in the DustPedia database) turned out to be too shallow to capture the entire disc of NGC 1068. We instead use the UKIDSS (Lawrence et al. 2007) Hand K band observations which are deeper and of higher spa-tial resolution. Most importantly, the H band is the reddest band without a significant PSF signature and is vital to determining the spatial distribution of the old stellar populations. For a simi-lar reason, we also use the narrow-band Hα map of NGC 1068 (Knapen et al. 2004). The map is an important constraint on the spatial distribution of the ongoing star formation in the absence of useable 22 µm or 24 µm images. We discuss this in more detail in the following section.
3. Model preparation
Our modelling strategy closely follows the prescriptions outlined inVerstocken et al. (2020), which, in turn were based on the work byDe Looze et al.(2014). The requirements for a panchro-matic, 3D, and resolved radiative transfer fit are three stellar components and one dust component. Here, we limit ourselves to a brief description at each modelling step and highlight where we deviate fromVerstocken et al.(2020).
3.1. Dust component
The dust component requires a 3D geometry plus the choice of a dust mix with associated optical properties. While similar studies in the literature mostly used analytical density profiles as input geometries, it is now possible to derive them from observa-tions directly. This allows the use of non-axisymmetric and more clumpy distributions for stars and dust, leading to more realistic models.
The most obvious way to trace the dust morphology is through a map of the dust mass surface density. However, this requires resolved SED fitting up to the SPIRE 350 µm band and drastically limits the working resolution. However, the input dust distribution does not need to be normalised as the total dust mass will be a free parameter. We therefore construct a map of FUV attenuation, which also traces the dust distribution but impor-tantly attains higher spatial resolution (De Looze et al. 2014). The per-pixel determination of AFUV is the same for all
galax-ies studied in this sergalax-ies. It relgalax-ies on the calibrations ofCortese et al.(2008). These latter authors derive the attenuation based on the total infrared-to-FUV ratio (TIR/FUV) with second-order adjustments based on the observed FUV − r colour. The AFUV
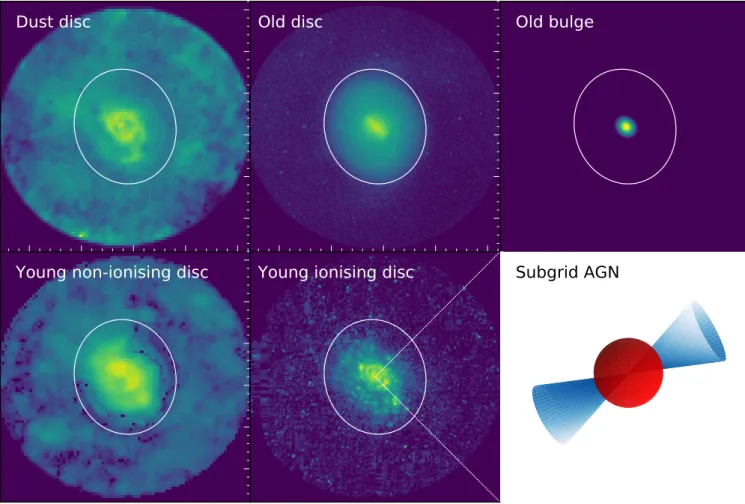
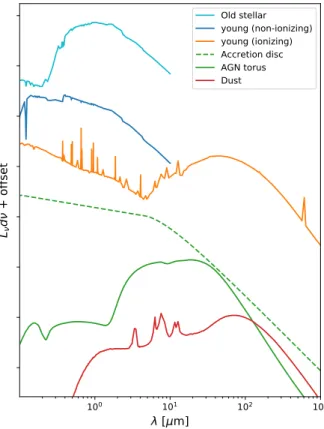
map is shown in Fig.1(top left panel) labelled as the dust disc. To convert this to a 3D density distribution, we deproject the 2D image along the minor axis and stretch the emission in each deprojected pixel out into the vertical (z-axis) direction accord-ing to an exponential profile. We set the scale height of this expo-nential profile to 76 pc, which is half that of the old stellar scale height as suggested byDe Geyter et al.(2014). For the spectral properties of dust absorption, scattering, and emission we adopt the THEMIS dust model for diffuse Milky Way dust (Ysard et al. 2015;Jones et al. 2017), in line with other DustPedia studies. A typical emission SED of this dust model is shown in Fig.2. 3.2. Stellar components
Each of the stellar components has a 3D spatial distribution asso-ciated with it, and a template shape for its SED. The templates
Dust disc
Old disc
Old bulge
Young non-ionising disc
Young ionising disc
Subgrid AGN
Fig. 1.Two-dimensional representations (on the plane of the sky) used as input morphologies for the 3D geometries for the model of NGC 1068. The old bulge and AGN model are based on analytical prescriptions while the other morphologies are derived from observed imagery. The model χ2is only evaluated within the white ellipse to ensure a sufficient signal-to-noise ratio. The ellipse has a semi-major axis of 83 arcsec or 4 kpc. The
AGN cone orientation in the bottom right panel is arbitrary and is for display purposes only.
are simple stellar populations taken from theBruzual & Charlot
(2003) library assuming aChabrier(2003) initial mass function (IMF; see the blue lines in Fig.2). We split the stellar compo-nents into three age groups. The old stellar population contains stars that are much older than 100 Myr and therefore no longer contribute to the classic SFR tracers (Kennicutt & Evans 2012). Typically, one can trace this component best with either WISE 3.4 µm or IRAC 3.6 µm observations. However, in the case of NGC 1068, these images are dominated by the PSF shape and do not provide clear morphological information. We therefore rely on the UKIDSS H band to trace the old stellar component. The additional advantage of using this shorter waveband is that the AGN contamination in the centre is minimal. We perform a bulge/disc decomposition on the H band image to further split the geometry into a Sérsic bulge and a disc. The bulge model (the only analytical density profile) is already three-dimensional by construction. The disc is deprojected in the same way as the dust map, but now given an exponential scale height of 151 pc, which is 1/8.26 of the scale length as suggested byDe Geyter et al. (2014). The second stellar component is a young non-ionising stellar population with average age of 100 Myr and is based on the attenuation-corrected GALEX-FUV map. This map was deprojected and given an exponential scale height equal to the dust scale height.
The third stellar component models the ongoing star forma-tion in the form of young (10 Myr) ionising stars still in their birth clouds. The MAPPINGS III (Groves et al. 2008) model
of stars and dust in a birth cloud with this average age was used as SED template for this component (see Fig.2). To trace the ongoing star formation, we use the narrow-band continuum-subtracted Hα emission. This image still has an unusually bright nucleus. D’Agostino et al. (2018) showed that the AGN is responsible for 25% of the Hα emission in the galaxy, and for 42% of the [NII] line emission. Both emission lines fall within the narrowband filter image used here. To mitigate the contami-nation, we mask out the nuclear Hα peak in the inner 350 pc or 7 arcsec (see alsoCasasola et al. 2015, for a similar approach). The astropy routine interpolate_replace_nans2was used
to infer the Hα emission from the surrounding disc. We note that this procedure preserves the exponential flux profile of the Hα disc. The total flux in the image is reduced by 41% after this correction, which is at the high end of the range estimated by
D’Agostino et al. (2018). The resulting image is converted to a 3D geometry by deprojecting it and assuming an exponential scale height of 38 pc, which is half that of the dust scale height and represents the embedded nature of the star-forming regions. 3.3. The AGN component
An important novelty is the addition of an AGN in our model. Radiative transfer simulations of accretion discs surrounded by a dusty torus have been executed in the past (see e.g.
100 101 102 103
[ m]
L
d
+
of
fse
t
Old stellar young (non-ionizing) young (ionizing) Accretion disc AGN torus DustFig. 2.Overview of the different SED templates adopted in the model.
Templates are scaled for improved visualisation.
Nenkova et al. 2008;Stalevski et al. 2012). However, given the enormous difference in scale between the torus and the galactic disc, it is not necessary to solve the transfer of radiation in the same simulation. As such, we construct a subgrid model for the AGN in NGC 1068. The two AGN emission components (the accretion disc and the dusty torus) are both modelled as point-like sources located at the centre of the galaxy.
The accretion disc spectrum is modelled as a composition of power laws with indexes varying as a function of wavelength. We used theSchartmann et al.(2005) prescription, which com-bines observed and theoretical evidence and is commonly used as a heating source in radiative transfer models for dusty tori in AGNs (Fig. 2). Its emission peaks at UV–optical wavelengths and its normalisation is tied to the total torus luminosity. A part of the radiation of the accretion disc is blocked locally by dust within the torus. We implemented this as an anisotropic (cone-shaped) emission profile with an opening angle of 20◦ around
the polar direction (see Fig.1, bottom right panel). This simple geometrical implementation mimics the same internal absorp-tion fracabsorp-tion as our preferred choice of torus model (see below): only 6% of the accretion disc light escapes the torus. The orien-tation of the accretion disc is such that it beams directly into the galactic disc, along the minor axis (inclination i = 0◦, azimuth φ = 90◦), with the obscured part pointing to the observer, as
expected for a Type-2 Seyfert galaxy with a hidden Type-1 core like NGC 1068 (Marin 2018).
We assume the torus emission to be isotropic, which is a fair approximation given our limited spatial resolution (44 pc) and the fact that its MIR radiation is far more optically thin than the obscured accretion disc (see also Fig.1, bottom right panel). To choose an emission model from the dusty torus, we performed a fit to the photometric points used by Lopez-Rodriguez et al.
(2018), using the upgraded model grid ofFritz et al.(2006)
pre-sented inFeltre et al.(2012). The former is a collection of spa-tially resolved data that are dominated by the torus emission and include crucial features such as the near-infrared (NIR) emission and the 9.7 µm silicate feature, observed in slight absorption for this AGN (Fig.2). The model that provides a good fit to these points has a dust full-opening angle of 140◦, and an outer-to-inner radius of 30. The equatorial optical depth is 6 measured at λ = 9.7 µm, and the dust density ρ(r, θ) varies within the torus according to:
ρ(r, θ) = αrβe−γ| cos(θ)|, (1)
where α is directly related to the value of the equatorial dust opti-cal depth, and the two parameters β and γ regulate the radial and height density profile (see Eq. (3) inFritz et al.(2006) for further details, where the authors assume the value of 0 and 4, respec-tively, for the best fit model). The AGN model is normalised by the 4.6 µm luminosity since this wavelength is particularly sensitive to the presence of very hot dust. It is not the goal of this paper to further constrain the torus or accretion disc prop-erties. We simply require a realistic subgrid implementation for the AGN. As such, the total luminosity is the only free parame-ter of the AGN component (with a fixed ratio between accretion disc and torus luminosity).
4. Radiative transfer SED fitting
The different components described in the previous section define the framework for our model of NGC 1068. Radiative transfer simulations are computationally demanding, and so the free parameters in this model need to be limited. We therefore rely on well-informed estimates for the spatial and spectral dis-tribution of each component as outlined above. For the dust den-sity distribution the only free parameter is the total dust mass, Mdust. For the other components, the free parameters are the
nor-malisation luminosities in certain wavebands: The spatial and spectral distribution of the young non-ionising (yni) and young ionising (yi) stellar populations are normalised by their FUV luminosity: LyniFUV and LyiFUV, respectively. The old stellar com-ponents are normalised together (assuming a fixed bulge-to-disc ratio) by their total luminosity in the H band: Lold
H . Finally, the
subgrid AGN SED is normalised by the total emission of accre-tion disc and torus at 4.6 µm: LAGN
4.6 . Here again the ratio between
disc and torus luminosity is fixed to guarantee the internal energy balance. In total, the model therefore has five free parameters.
We make use of SKIRT (Baes et al. 2011; Camps & Baes 2015) to perform the radiative transfer calculations in the 3D simulation space. The stellar and AGN components serve as sources of radiation. The dust component acts as a sink of UV– optical–NIR radiation, which is then reprocessed and emitted at longer wavelengths. Light is also anisotropically scattered by the dust grains. SKIRT can perform these simulations in a highly efficient way thanks to multiple optimisation techniques for the transfer of radiation towards the observer (Baes et al. 2011), effective quantisation of the dust density distribution using a binary tree dust grid (Saftly et al. 2014), and support for vari-ous types of parallel computing (Verstocken et al. 2017).
Our goal is to find the optimal combination of free param-eters that reproduce the observations. Despite the efficiency of SKIRT, this is not a trivial task. We therefore run a suite of low-resolution simulations and use the global broadband SED of NGC 1068 as an observational constraint since it is efficient to generate the synthetic line-of-sight model fluxes. The radiation transfer is evaluated in a set of 3D dust cells of variable volume,
Table 1. Overview of the free parameters of our model setup together with their initial guess values.
Parameter Initial guess Batch 1 (50th pct) Batch 2 (50th pct) Best fit log(Mdust/M ) 7.23 7.43+0.15−0.19 7.40+0.11−0.12 7.31
log(Lold H /W µm
−1) 36.65 36.64+0.17
−0.25 36.54+0.15−0.19 36.44
log(LFUVyni /W µm−1) 37.56 37.85+0.22
−0.32 37.65+0.21−0.28 37.58 log(LFUVyi /W µm−1) 37.46 37.76+0.22 −0.33 37.59+0.23−0.31 37.50 log(LAGN 4.6 /W µm −1) 35.47 35.63+0.30 −0.32 35.41+0.16−0.24 35.41
Notes. After each fitting batch, the 50th percentile corresponds to the median value for that fit. The uncertainties on the 50th percentiles reflect the width of the corresponding bin. The last column lists the parameter values for the model with the lowest overall χ2.
6.8 7.0 7.2 7.4 7.6 log(Mdust/M ) 0.0 0.1 0.2 0.3 0.4 0.5 0.6 Probabilit y 50th percentile Best fit 35.5 36.0 36.5 37.0 log(Lold H) [W/µm] 36.0 36.5 37.0 37.5 38.0 log(LyniF U V) [W/µm] 36.0 36.5 37.0 37.5 38.0 log(LyiF U V) [W/µm] 34.5 35.0 35.5 36.0 36.5 log(LAGN 4.5 ) [W/µm]
Fig. 3.Probability density distributions for the free parameters in our model configuration. The spacing between bars represents the spacing of the parameter grid. The width of the bars is set so they do not overlap due to the unequal spacing. The blue distribution corresponds to the first batch of models. The parameter grid was refined based on this batch. After the second fit iteration, the red distributions are found. The median values of the second batch are indicated with vertical dashed lines. The solid vertical lines indicate the values for the model with the lowest overall χ2.
but roughly equal in mass. With a dust grid of 1.3 × 10⁶ cells, we reach an effective resolution of 44 pc in each dimension. In each simulation, the model is evaluated in 134 wavelength bins by 1 × 10⁶ photon packages per wavelength. Doing so, each set
of parameters can be evaluated in under one hour (on average) on a 16 CPU node.
With each point in the 5D parameter space taking 16 CPU hours, it becomes impractical to run a classic non-linear fitting algorithm. We therefore adopt the same two-step fitting approach as for the other DustPedia-modelled galaxies (Verstocken et al. 2020;Nersesian et al. 2020). In a first run, we explore a wide parameter space, sparsely sampled around a well-motivated ini-tial guess (see below). For each parameter set, the observed and model broadband SED is compared by summing the χ2 metric. The fluxes are measured in 2D (sky projection) images inside an elliptical aperture with semi-major axis of 4 kpc (see Fig.1). Each wavelength regime (UV, optical, NIR, MIR, FIR and submm) is given equal weight to the total squared sum (see
Verstocken et al. 2020, for a detailed description). The parameter values for each fit can then be weighted by exp(−χ2/2) to sample
the probability density distribution.
As an initial guess, we use the global properties derived by
Nersesian et al.(2019) which are based on SED modelling with CIGALE (Boquien et al. 2019).Nersesian et al.(2019) find MCIGALEdust = (1.71 ± 0.23) × 107M SFRCIGALE= 13.4 ± 3.6 M yr−1 ACIGALE FUV = 3.64 ± 0.31. (2)
This dust mass can directly be used as an initial guess. From the SFR, we compute an initial guess for the UV luminosity of
the ionising stellar populations. The AFUV can be used to
de-redden the observed FUV luminosity, which we assume here for simplicity to be the sum of the ionising and non-ionising stellar components. Furthermore, we use the observed H band lumi-nosity as an initial guess for the total (bulge+disc) old stellar populations as this band is relatively free from other contribu-tions. For the AGN torus, our initial guess normalisation was set at 2.50 × 1035Wµm−1and tied to this an accretion disc luminos-ity 0.15 × 1035Wµm−1. These luminosities provide the best fit
of our model to the estimated fluxes of the central 20 pc from
Lopez-Rodriguez et al.(2018). The initial parameter set for the model is listed in Table1.
For galaxies without a strong AGN, radiative transfer fits with three parameters (Mdust, L
yni FUVand L
yi
FUV) are sufficient. The
challenge of adding an AGN is that the MIR SED becomes even more convoluted and difficult to disentangle into separate contri-butions. To deal with this added complexity, we first introduce LAGN
4.6 as a free parameter to scale the AGN template SED.
Sec-ondly, we also allow the old stellar population template SED to scale up and down. This is set by Lold
H since the H band is a
good tracer of this stellar population and the contamination of the AGN is expected to be minor. An adequate coverage of this parameter space therefore requires many more sample points. We build a sparse but wide 5D Cartesian parameter grid around our initial guesses. The grid spans more than one order of magni-tude in Mdust, LAGN4.6 , and LoldH , and more than two orders of
mag-nitude in LyniFUVand LyiFUV. Each dimension is uniformly sampled in log space with five points during this first run, which already amounts to 3125 simulations.
The resulting probability distributions of the first batch are shown in Fig.3by the blue histograms. These have a clear peak for all free parameters, which importantly does not occur at the edge of the sampled space. This means that we are already able
1034 1035 1036 1037
L
d
[W
]
AGNAGN diffuse dust Best fit 100 101 102 103
[ m]
Old stellar Young stellar Best fit CIGALE CIGALE old CIGALE young CIGALE young (unatt)101 100 101 102 103
[ m]
0.5 0.0 0.5res[dex]
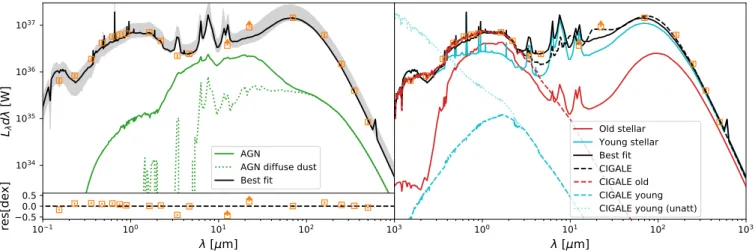
Fig. 4.Spectral energy distributions from the best-fit model for NGC 1068. Left: global SED (black line) fits to the observed (orange) broadband fluxes. The grey shading indicates the 16th to 84th percentile area around the fit. Triangles indicate lower limits. The corresponding residuals are shown in the bottom panel. The solid green line shows the total emission for a model with only the AGN+ dust component. The dotted green line then corresponds to the light reprocessed by the diffuse dust only in this simulation. Right: same best-fit SED and data points. The solid blue and red lines correspond to simulations where only one component (young or old, respectively) is present alongside the dust. A CIGALE model is also shown (dashed black line). This model can be decomposed into young and old populations (blue and red dashed lines, respectively). The intrinsic young population (blue dotted line) of the CIGALE fit is also shown.
to put coarse constraints on all parameters. The median values (50th percentile of the PDFs) are summarised in Table1.
Based on the distributions of the first batch, we can narrow the parameter space significantly and adopt a finer sampling. We ensure that over 90% of the probability is captured in the param-eter space for the second batch. We again use five sample points per parameter, but now uniformly distributed in linear space. The probability distributions for this second batch of 3125 simula-tions are also shown in Fig.3(red histograms). Each distribution shows a clear peak, with the exception of LyiFUV. It seems we are reaching the limit of precision by which we can constrain this parameter. The PDF for LAGN
4.6 is also rather broad for the second
batch. The parameter values for the best-fitting model (lowest χ2) lie close to the median parameters (50th percentile values)
and are listed together in Table1. These values also correspond well with our initial guess. We explore the 2D probability distri-butions in AppendixAand find no strong degeneracies or suspi-cious features in these figures. We conclude that at this point the free parameters of our model are reasonably constrained. Adding another iteration would again require significant computational resources and would not significantly reduce the uncertainties. In the following section, we analyse the best-fitting model in further detail.
5. A 3D high-resolution model for NGC 1068
5.1. Comparison of SEDs
The best-fit model obtained in the previous section forms the basis for our dust heating analysis. We first produce a higher quality version of the best-fit model by shooting five times as many photons per wavelength (5 × 10⁶), and almost twice the number of wavelength points (252). This increases the spectral sampling and reduces the inherent Monte Carlo noise in the dust cells and in the resulting images. To separate the contributions of each source of radiation, each simulation is run again with the same dust distribution, but only one source component each time: the old (bulge and disc), young (non-ionising and ionising discs), and AGN (accretion disc and torus) components, respec-tively. This process takes another 1280 CPU hours. The resulting
SED, along with its uncertainty levels, is shown in Fig.4 (left panel, black line).
Globally, our model follows the observed SED fairly well. The main stellar and dust peak match the datapoints closely and within the uncertainties. However, there are points of discrep-ancy. First, the FUV point is overestimated by the model, while the NUV point is underestimated. This issue has been noted before in galaxies with a significant contribution of the young ionising templates (De Looze et al. 2014;Verstocken et al. 2020;
Nersesian et al. 2020). This signature in the template for ionising stellar populations is amplified by a broad bump in the THEMIS attenuation curve.Nersesian et al. (2020) compared the atten-uation curve (normalised to AV) of our model to their galaxies
and found that NGC 1068 exhibits the flattest attenuation curve of the sample. It also lies closest to the extinction curve corre-sponding to the THEMIS diffuse Milky Way dust model, which is also used here in our radiative transfer simulations.
Also driven by the dust model are the strong aromatic peaks in the MIR SED in Fig.4. The adopted emission model was cal-ibrated on diffuse dust in the Milky Way. The strength of MIR emission features is often reduced in AGNs compared to star-forming galaxies (see e.g.Sales et al. 2010) although this may be attributed to dilution by the bright MIR continuum ( Alonso-Herrero et al. 2014). Mid-infrared spectra of NGC 1068 do reveal line emission even close to the nucleus (Mason et al. 2006;Howell et al. 2007) due to ongoing star formation there. Environmental changes in dust composition and grain mixture are capable of significantly changing the dust emission profile (Köhler et al. 2015) but this is currently not possible in our model. Destruction of the smallest amorphous hydrocarbon (a-C) grains would for example reduce the 3 µm−13 µm emission band intensities. At the same time, a lack of a-C grains would also reduce the UV bump and provide a better match to the GALEX data points. This underlines the need to allow for dust evolution in the next generation of radiative transfer codes. A framework for such simulations is currently being developed (Camps, in prep.). We did not wish to skew our model by fit-ting to wavebands that contain MIR emission peaks and there-fore do not include the WISE 3.4 µm and 12 µm flux in the χ2
As already mentioned in Sect.2, good-quality maps of the main disc of NGC 1068 are lacking in the MIR. Particularly at 12 µm and 22 µm, the PSF signature (a blend of the disc and AGN emission) is larger that the field of view we consider. We therefore treat these two points as lower limits. The most dis-crepant point is the WISE 22 µm flux, which is underestimated by the model. We looked into models with a stronger AGN con-tribution, but these lift the MIR continuum at the same time. Changing the ratio between the stellar components also did not improve the fit without introducing discrepancies at other wave-lengths. The observed WISE 22 µm flux in our aperture is higher than the MIPS 24 µm flux (not shown and also suffering from strong PSF signatures). Part of this discrepancy could therefore be attributed to the observational uncertainty, but still our model seems unable to capture the exact SED shape in the MIR. This may partly be due to the subgrid implementation of the torus. A non-isotropic torus model or a more clumpy one could boost the emission at 22 µm in the AGN SED (seeFeltre et al. 2012). However, as indicated earlier, it is not the goal of this paper to further constrain the torus properties themselves, but instead we focus on how radiation escaping the AGN affects the host galaxy. Alternatively, changing one of the stellar emission templates could bridge the discrepancy. The MIR emission in particu-lar can be boosted by tweaking the young ionising component template. The covering factor used in theGroves et al.(2008) template library can be increased to boost the emission from warm dust surrounding star-forming regions, while at the same time keeping the escaping UV radiation relatively low. Unfortu-nately, introducing yet another free parameter in the optimisa-tion procedure would be computaoptimisa-tionally difficult. In addition, one of the main goals of this paper series is to provide a suite of radiative transfer models for different galaxies with a consis-tent set of fixed parameters (Verstocken et al. 2020). Only the template luminosities and dust mass are considered free param-eters, which allows us to investigate heating mechanisms across the sample (Nersesian et al. 2020).
We also run separate simulations containing only one emis-sion component: the young (non-ionising+ionising) stellar pop-ulations, the old (bulge+disc) stellar populations, and the AGN. All of these simulations still contain the dust component and are simply re-runs of the best-fit simulation with fewer emission sources. The diffuse dust is now heated solely by the components that are present in the simulation. We note that the sum of these SEDs will not add up to the global SED (with all components) as dust emission is a non-linear effect.
In the left panel of Fig. 4we plot the SED of the simula-tion with the AGN (accresimula-tion disc+torus) + dust only. The AGN only contributes significantly to the MIR, but does not dominate the global SED in any regime. However, an important observa-tion here is the broad tail of the AGN SED in the submm. This is not direct emission from the AGN, but light reprocessed by the diffuse dust in the galaxy (see green dotted line in Fig. 4). This already indicates that the AGN radiation is influencing the surrounding ISM. Nevertheless, the effect is rather small as the dust emission lies typically one order of magnitude below the emission generated by the old or young components. We com-pute a bolometric luminosity Lbol
AGN = 0.4 × 10
37W, compared to
Lboldust = 2.7 × 1037W. For the total observed SED, the bolomet-ric luminosity is Lbol
tot = 4.3 × 1037W. FollowingBianchi et al.
(2018), we can compute fabs = Lboldust/(L bol
tot − LbolAGN) = 0.69 the
fraction of light that is reprocessed into dust emission. Our esti-mate corresponds well with the 0.68 found by these latter authors from a CIGALE model of the global SED.
The SEDs of the old+dust and young+dust simulations are plotted in the right-hand panel of Fig.4. The dominance of the young+dust simulation (blue line) is immediately clear. Its SED lies well above the SED of the other simulations in the UV, MIR, and FIR regimes. This is already an indication that the FIR flux is powered by ongoing star formation. The second-most-luminous SED comes from the old+dust simulation, although it only really dominates in the NIR. Still it seems to contribute some energy to the submm emission.
We can compare our model and subcomponents with 1D SED models like the ones fitted by CIGALE. This method is well suited for fast modelling of statistical samples, but as a trade-off it lacks 3D information and radiative transfer effects. We adopt the modelling method ofNersesian et al.(2019) and apply this to the fluxes of NGC 1068 in the ellipse region under consideration (see Fig.1). The resulting SEDs of the total and subcomponents of the CIGALE model are shown as dashed lines in Fig.4. The global SED fits the observed data very well. The number of free parameters (and their priors) in CIGALE is sufficient to alleviate the discrepancies present in our radiative transfer model. Espe-cially interesting is the emergence of a second peak in the MIR to match the 22 µm point. This does seem to be at the cost of a lower continuum at shorter wavelengths, underestimating the 4.6 µm point.
A breakup of the CIGALE model into subcomponents pro-vides more insight into the global fit. Figure4 shows that the observed SED model is dominated by the old component. This can be compared to the old stellar component of the radiative transfer model, bearing in mind that the latter SED also con-tains dust emission. The CIGALE subcomponents shown here do not include dust emission. Similarly, we can compare the young components and find a vast discrepancy between the mod-els. The CIGALE young component has a negligible contribu-tion to the observed SED. To inspect this mode closely we also plot the unattenuated SED of the young component (blue dotted line). The unattenuated SED is much more luminous pointing towards extreme levels of attenuation. This is likely related to the emission peak at 22 µm. As CIGALE tries to fit this data point, it needs to boost the continuum and PAH luminosity, which requires strong attenuation of UV and optical light. It is impor-tant to note that this model does not contain an AGN. Additional freedom of the AGN component could help to fit the MIR with-out skewing the attenuation for the young population.
From this comparison we conclude that 1D SED fitting tools can provide good fits to the global fluxes of galaxies hosting an AGN. However, caution is needed in interpreting these models. In large samples it is a priori not clear which galaxies require a low-luminosity AGN component (like NGC 1068) in the model. Looking at the subcomponents provides useful insight into this case. Standard CIGALE fits with an extremely attenuated young stellar component and a double IR bump can identify AGNs in a sample of galaxies. This initial result motivates more compar-isons between 3D RT SED fits and 1D tools to highlight defi-ciencies in both methods and act upon them.
5.2. Image comparison
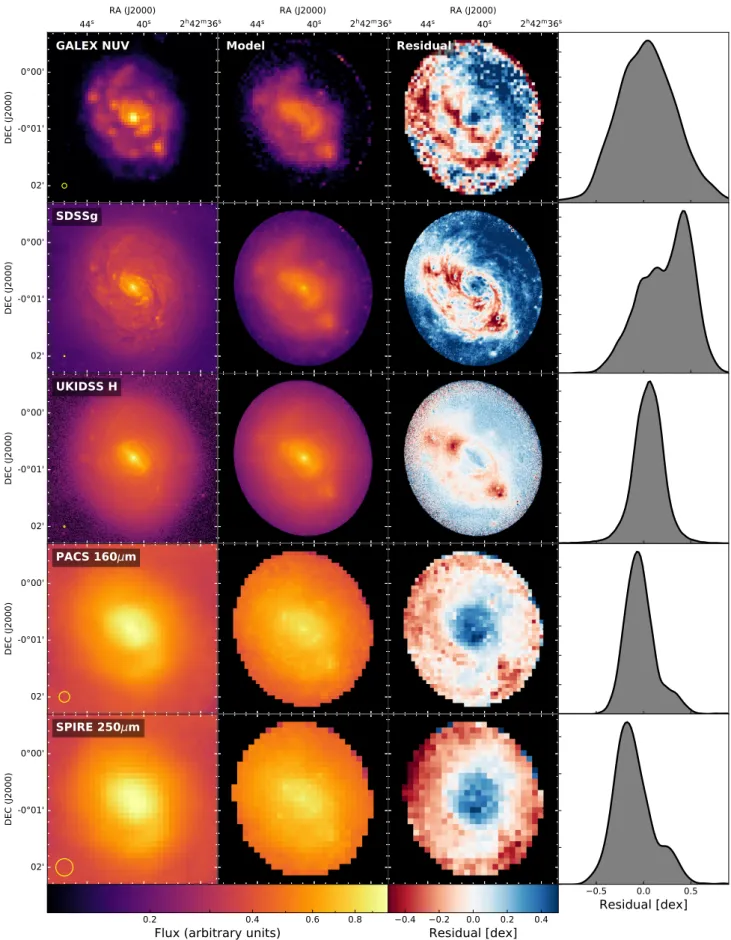
We generate synthetic images to further assess the quality of our model. We convolve the 3D datacube produced by SKIRT using the spectral response curves of five representative broadband fil-ters across the SED. We do not convolve the images with a cor-responding PSF as it is difficult to determine the model kernel. The PSFs of the images that were used to extract the input den-sity distributions, as well as the resolution of the dust grid, result
in a complex effective PSF of the model image. As such we sim-ply compare the spectrally convolved model images with their observed counterparts in Fig.5and indicate the instrument PSF as a yellow circle. We also produce residual maps in dex units as log10(observation) − log10(model), and plot the kernel den-sity estimates (KDEs) for the pixel distributions in these residual maps.
The model images reproduce the observed counterparts within 0.5 dex. Visually, the correspondence is quite good in the UV, optical, and NIR maps. However, the residuals reveal sig-nificant asymmetries corresponding to the spiral arms. This is due in part to the deprojection of 2D input images to create a 3D density distribution, where light is smeared out in the verti-cal direction. On top of that, we do not resolve the dust extinc-tion at sufficient resolution, which introduces residual features at smaller scales. The effect is worst in the SDSS g band image, where the spatial resolution is the highest. In this band the flux is also systematically underestimated by the model as highlighted by the KDE plot. In the NIR, there are two strong positive resid-ual features on opposite sides of the galaxy. These correspond to star-forming regions which are over-luminous in the model (rep-resented by the ionising component). However, globally, the NIR regime shows the best correspondence with the observations.
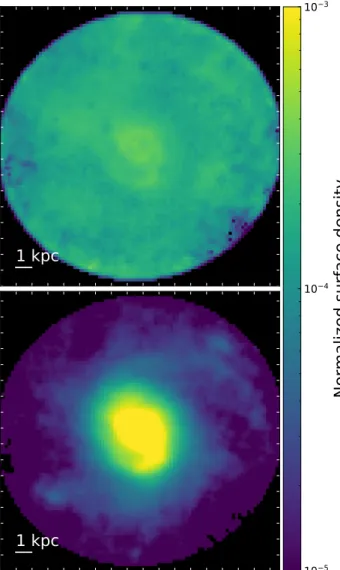
The model FIR images do not show the bright central area, but the PACS map does peak sharply in the nucleus. This can mainly be attributed to the difference in PSF, but the model also underestimates the flux in the centre (while matching the total flux in the FIR regime). We speculate that this may be due to an insufficient central dust density in the input map. The current dust geometry map is based on pixel-by-pixel determinations of AFUV. This relies on the calibrations of Cortese et al.(2008),
which derive the stellar age bin from the FUV−r colour. It is pos-sible that the AGN emission in NGC 1068 can locally skew these age estimates, resulting in a less reliable AFUV estimate in the
centre of the galaxy. We have tried to fit a model where the dust geometry followed the PACS 70 µm map more closely. This dust map is more centrally peaked than the current one based on AFUV
and is presented in AppendixB. However, this alternative map causes severe attenuation in the UV and optical bands, too much dust emission in the FIR, and a less favourable fit to the observed global fluxes. We therefore did not analyse this model further and stick to the model based on the AFUV dust map. Knowing
the qualities and caveats to the best-fitting model, we analyse the dust heating sources and energy balance in NGC 1068 in the following section.
5.3. Light fractions
The global SED of our model further allows us to estimate the light contamination of sources unrelated to star formation in NGC 1068. We therefore compute, in each band, the emis-sion ratio between the AGN-only and the total simulation (still including the same dust component), FλAGN, and similarly for the old stellar population: FλOld. It is useful to quantify these con-tributions since several broadband colours or luminosities are used to directly derive physical properties of galaxies. An ade-quate correction for star-forming galaxies containing an AGN is necessary before applying such recipes. Likewise, a correction for light coming from older stellar populations can improve esti-mates of star-formation and attenuation curves (see e.g.Roebuck et al. 2019).
Figure6(top panel) shows FAGN
λ for all bands in our dataset,
and for several concentric elliptical apertures. As expected, there is a general increase in the AGN light ratio towards the innermost
regions of the galaxy. FλAGNaverages to only 0.12 inside a 4 kpc major axis radius and across the wavelength range. In the inner-most aperture (0.5 kpc), this average increases to 0.32. Along the wavelength axis, all apertures exhibit the same behaviour. There is virtually no AGN contamination in the UV bands and only a minor contamination in the optical bands (FλAGN= 0.01 − 0.05). There is a strong increase in the NIR and the peak FAGNλ is reached in the WISE 4.6 µm band and varies from 0.50 within 4 kpc to 0.83 within the inner 0.5 kpc. The peak actually extends well into the MIR, but drops off quickly towards the PACS 70 µm band. In the FIR, an interesting positive slope points to an increasing contribution with increasing wavelength. The intrinsic AGN (disc+torus) emission model does not have this behaviour, as is evident from the right panel in Fig.4. This is actually an indirect effect as AGN light is reprocessed by the diffuse dust. It is important to realise that even SPIRE bands can therefore be contaminated by the AGN.
The radial and spectral variation in FOldλ is displayed in the bottom panel of Fig.6. There is less variation between the dif-ferent apertures than for the AGN light fraction. Still a similar pattern emerges: the highest fractions are found in the centre and can be attributed to the bulge population of older stars. Interest-ingly, there are two peaks along the spectral axis. The first peak around 1 µm is expected and corresponds to the peak of direct emission of the old component. The second peak lies around 350 µm where FOld
λ still reaches 0.5. This can be attributed to
reprocessed light from the old stellar populations by the diffuse dust. We note that this number does not suggest a dust heating fraction of 50% because the conversion of dust emission SED to the input energy is non-linear. We study the input energies fur-ther in the following section but the light fractions already qual-itatively confirm that both old stellar populations and the AGN affect the total dust emission in this galaxy.
6. Dust-heating sources
The main advantage of 3D radiative transfer simulations is the inherent information on the energy balance in every dust cell. Our model, based on NGC 1068, contains the absorbed energy in each cell and thus summarises how the dust in that cell is heated before re-emitting this energy at longer wavelengths. In line with our previous work (Verstocken et al. 2020;Nersesian et al. 2020), we make use of the total (wavelength-integrated) absorbed energy per stellar component and per volume element (dust cell). We derive three quantities: fyoung, the combined
heat-ing fraction of the young (non-ionisheat-ing+ ionising) component, fold the heating fraction of the old stellar component, and fAGN,
the AGN heating fraction. These reflect dust heating through ongoing star formation, the general radiation field, and through AGN emission, respectively, and are defined as
fyoung=
Labsyni+ Labsyi Labs tot , fold = Labs old Labstot, (3) fAGN= LabsAGN Labs tot , where the Labs
k refers to the absorbed luminosity for component k.
These quantities are computed per dust cell. The total absorbed luminosity is the sum of all components per dust cell: Labs
tot = Labs yni+ L abs yi + L abs AGN+ L abs old.
2h42m36s 40s 44s 0°00' -0°01' 02' RA (J2000) DEC (J2000)
GALEX NUV
2h42m36s 40s 44s RA (J2000)Model
2h42m36s 40s 44s RA (J2000)Residual
0.5 0.0 0.5 0.0 0.2 0.4 0.6 0.8 1.0 1.2 0°00' -0°01' 02' DEC (J2000)SDSSg
0.5 0.0 0.5 0.0 0.2 0.4 0.6 0.8 1.0 1.2 1.4 1.6 0°00' -0°01' 02' DEC (J2000)UKIDSS H
0.5 0.0 0.5 0.0 0.5 1.0 1.5 2.0 2.5 0°00' -0°01' 02' DEC (J2000)PACS 160 m
0.5 0.0 0.5Residual [dex]
0.0 0.5 1.0 1.5 2.0 2.5 0°00' -0°01' 02' DEC (J2000)SPIRE 250 m
0.5 0.0 0.5Residual [dex]
0.0 0.5 1.0 1.5 2.0 0.2 0.4 0.6 0.8Flux (arbitrary units)
0.4Residual [dex]
0.2 0.0 0.2 0.4Fig. 5.Spatial comparison of our best-fit model to observed broad-band images (left column). The second column contains the model images. We note that the model images are not convolved by any PSF and only hold the intrinsic model PSF (a composite of the input images). Residual images are shown in the third column. Corresponding residual distributions are represented by KDE plots in the right column. The area under the KDE curves is normalized to 1.
0.0 0.2 0.4 0.6 0.8 1.0 FAGN 0.5 kpc 1.0 kpc 2.0 kpc 3.0 kpc 4.0 kpc 100 101 102 λ[µm] 0.0 0.2 0.4 0.6 0.8 1.0 FOld
Fig. 6.Fraction of emission originating from the AGN component to the total emission per band, FAGN(top panel) and from the old component
FOld(bottom panel). Different lines correspond to different concentric
elliptical apertures. The light fractions are derived from the integrated light within the full aperture.
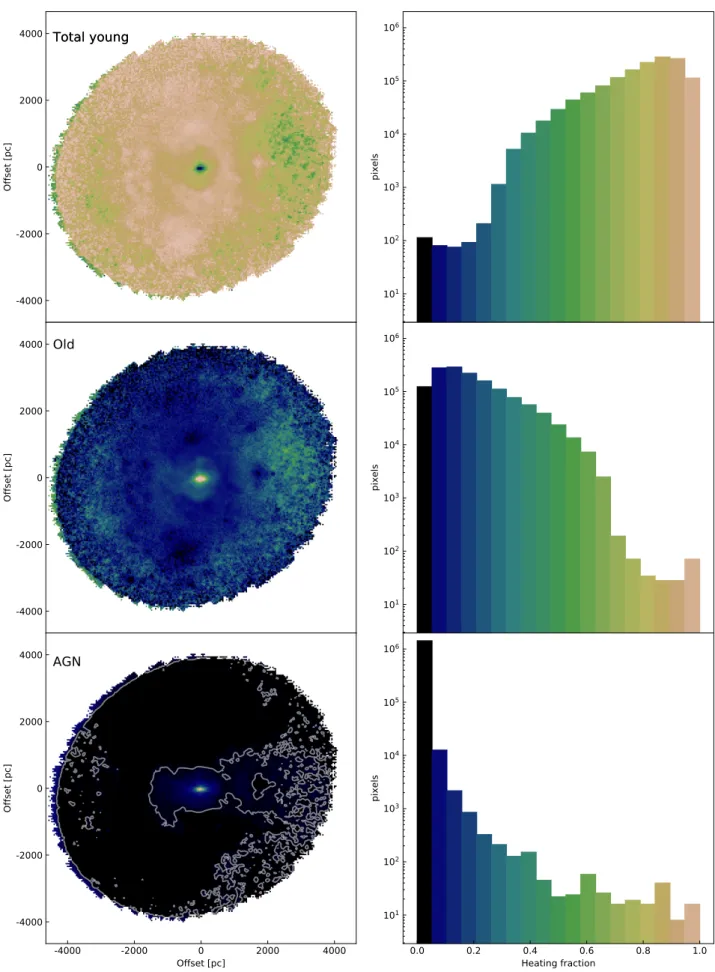
Figure7summarises the dust heating fraction of each com-ponent. The left panels show a cut through the mid-plane of dust cells in a face-on view of the galaxy model. In this view, the direction of the AGN beam is aligned with the horizontal axis of the figure. The colour coding is set by the histograms on the right. The histograms contain all dust cells (including the ones above and below the mid-plane). Globally, a median fyoung= 0.83 was found, which underlines the dominance of star
formation as a heating source in this galaxy model. In contrast, the old stellar populations have a median fyoung = 0.16 and the
AGN effect is minor with a median fAGN = 0.006.
More detail is visible on a local level in Fig.7. The young component peaks in a ring around the centre, and in two zones above and below it. These structures can also be distinguished in optical images of NGC 1068 and are associated with enhanced star formation (see the ionising disc map in the bottom middle panel of Fig. 1 or the NUV map in Fig.5). The base level of fyoungremains high across the disc, but drops below 0.5 in some
patches at larger radii. This is where the ongoing star forma-tion fades and the radiaforma-tion field created by the old stellar pop-ulation takes over in heating the dust. In many ways, the map of fold appears complementary to the fyoungmap. This indicates
that stars (young or old) are still very much the dominant heating sources in this galaxy.
Quite remarkable is the central dip in fyoung, which cannot be
fully explained by the peak in folddue to the bulge. This central
dip spatially correlates with the peak in fAGNin the bottom left
panel of Fig.7. The central ∼0.5 kpc is the main zone of influ-ence of the AGN. Here, the AGN-powered dust heating even dominates that of the surrounding star-forming disc. The fAGN
map also shows a clear directional preference for the AGN heat-ing (roughly along the horizontal axis of Fig.7). The main direc-tion is guided by our implementadirec-tion of the AGN accredirec-tion disc, beaming straight into the disc with a conical opening angle of 20◦ (see Sect.3). The map also shows a slight left-right
asym-metry (highlighted by the white contour), where the AGN heat-ing can be noted further out towards the right side of the map. The star-forming disc fades off more quickly in that direction, leaving room for the AGN to increase its contribution to the dust heating.
To further quantify the AGN-powered dust heating, we plot the radial profiles of fAGN and fyoungin Fig.8. The same trend
as in Fig. 7 arises. The ongoing star formation dominates the dust heating in most of the dust cells in the disc with fractions between 60 and 95% and with appreciable scatter at every radius. The radial distribution for fAGN exhibits a steep decline from
the centre towards the outskirts. We can approximate the radial decline of the AGN heating fraction quite well with a power law: fAGN= 0.0117 R kpc !−1.19 . (4)
In the above fit we excluded data points inside the inner 50 pc to avoid limited sampling and our spatial resolution limit. We also excluded the points beyond 3000 pc to avoid edge effects. The power law thus only holds within these radial limits. Fur-ther models of galaxies hosting an AGN are required to ver-ify whether or not this power-law behaviour is universal. Our analysis suggests that AGN-powered dust heating is appreciable (>5%) inside the inner few hundred parsecs, and remains at the percentage level throughout the galaxy.
7. Discussion and summary
We created a radiative transfer model based on observed imagery of NGC 1068. This galaxy contains an extended old disc and bulge, and a smaller star-forming disc with spiral arms. NGC 1068 also bears an AGN and its accretion disc appears to be edge-on while the galaxy is roughly face-on. As such the accretion disc beams directly into the star-forming disc. This par-ticular configuration makes the galaxy an ideal target to inves-tigate a scenario where the AGN heats diffuse dust beyond its torus. While there is circumstantial evidence for such AGN-powered dust heating in the Local Universe (Wu et al. 2007;
Bendo et al. 2012; Kirkpatrick et al. 2012, 2015; Verstappen et al. 2013;Roebuck et al. 2016), the phenomenon has thus far only been simulated for quasars (Schneider et al. 2015; Duras et al. 2017). For such objects, observational evidence suggests that the AGN heating fraction is at least 5−10% (Symeonidis et al. 2016; Symeonidis 2017). However, QSOs are extreme environments with AGNs that are orders of magnitude more luminous that in the Local Universe. To our knowledge, we present the first full 3D radiative transfer fit to a local star-forming galaxy with an AGN.
The complex geometry of structure of NGC 1068 makes it difficult to disentangle the main components of our model. We used linear combinations of observed broad- and narrow-band images to obtain the purest possible 2D maps of old, non-ionising, and ionising stellar populations. The main challenge
-4000 -2000 0 2000 4000 Offset [pc] 101 102 103 104 105 106 pixels -4000 -2000 0 2000 4000 Offset [pc] 101 102 103 104 105 106 pixels -4000 -2000 0 2000 4000 Offset [pc] -4000 -2000 0 2000 4000 Offset [pc] 0.0 0.2 0.4 0.6 0.8 1.0 Heating fraction 101 102 103 104 105 106 pixels
Total young
Total young
Old
AGN
Fig. 7.Dust heating fractions in a slice through the mid-plane of the face-on view of our model (left panels). The direction of the AGN beam is aligned with the horizontal axis of the figure. The colour code is set on the histograms on the right. The histograms contain all dust cells (including the ones above and below the midplane). Top row corresponds to fyoung, middle row to fold, and bottom row to fAGN. The white contour corresponds
10
210
3R [pc]
10
410
310
210
110
0Heating fraction
AGN fit: = -1.190
20
40
60
80
100
Number of dust cells
Fig. 8.Scatter density plots showing the radial profiles of the dust heat-ing fraction. The colour bar corresponds to the density in points of fyoung. The red points correspond to fAGN. The power-law fit of Eq. (4)
is shown as a black line.
was to construct a dust mass map at a workable resolution. We deviated from the standard recipes provided byVerstocken et al. (2020) as we could not use bands that are dominated by the instrumental PSF signature (notably the MIR). Our model can reproduce the global SED of NGC 1068 and many of the resolved features (see Figs.4and5). However, it is less success-ful in retrieving the FIR wavebands due to a slight shortage of dust mass towards the centre. Adding more dust in these areas would increase the heating fraction of the AGN and would pro-duce a less favourable fit to the global SED. With these caveats in mind, our model should be seen as a representation of a star-forming galaxy based on NGC 1068. The subsequent dust heat-ing results are therefore still realistic.
Our best-fit radiative transfer model has a dust mass and an SFR (derived from young stellar luminosities), which are in line with a classic CIGALE SED fit (Table 1 andNersesian et al. 2019). However, major differences are found between the rel-ative importance of the attenuated stellar components. In the CIGALE model, the young stellar population is extremely atten-uated in order to boost the MIR emission and compensate for the lack of an AGN in the model. When modelling larger samples of galaxy SEDs it is therefore worthwhile to check the subcompo-nents of 1D SED models. Signatures similar to the one found here could point to a low-luminosity AGN which requires more tailored SED models. This is an example of how 3D RT models can inform 1D SED models of large samples even though it is not efficient to perform a RT fit for each individual galaxy.
The AGN in our model has a bolometric luminosity of LAGNbol = 3.97 × 1043erg s−1, which is somewhat lower than pre-vious AGN models for NGC 1068 (e.g.Lopez-Rodriguez et al. 2018). This could in part be due to our assumption of an isotropic point source for the subgrid implementation of the AGN torus. The AGN in NGC 1068 is in any case quite weak for Seyfert 2 galaxies (see e.g. Lusso et al. 2012). It is therefore possible that the reported AGN dust heating fractions are on the low end of the potential spectrum. Still, even for this relatively weak AGN, we find percentage-level dust heating out to 4 kpc from the centre. The AGN heating fraction declines radially following a powerlaw with index −1.19. In the inner 500 pc, the heating
fraction rises quickly above 10% and peaks above 90% in the inner resolution element of our simulation (40 pc). This is also reflected in the contribution of AGN light to each broadband flux in NGC 1068 (Fig.6). Even in the SPIRE bands there is contam-ination in the emission due to reprocessed AGN energy.
Globally, we find that most of the dust in the NGC 1068 model is heated by ongoing star formation. The median of this fraction is 83% when all dust cells are considered. This corre-sponds to a reduction of the Ldust-derived SFR from 11.7 M yr−1
in the full model to 8.4 M yr−1in the model where only young
(non-ionising and ionising) stellar populations heat the dust. These estimates were obtained using the Kennicutt & Evans
(2012) conversion from Ldustto SFR, which adopts the IMF from Kroupa & Weidner(2003). Relatively speaking, this is a fairly small correction as NGC 1068 is the galaxy with the highest fyoung in our project sample (containing M 81 and four barred
spirals M 83, M 95, M 100 and NGC 1365). This is clearly shown already in Fig. 8 ofNersesian et al. (2020), where we plotted fyoung as a function of sSFR (the SFR divided by stellar
mass). The dust cells of our model lie in line with the general increasing trend that other star-forming galaxies exhibit. Here, SFR and stellar mass were computed per dust cell, already tak-ing into account the fact that not all dust emission arises from the young stellar populations.
Most of the additional energy to heat the dust actually comes from the old stellar populations ∼16% in our model, with only a negligible part from the AGN (on global scales). This is also in line with the global energy balance study of the DustPedia sample (Bianchi et al. 2018), where AGN do not stand out from the rest of this sample of local galaxies. However, Fig.7clearly shows that there are significant local differences. In the extreme case, considering the dust cells in the inner 100 pc, the median heating fractions average out at 34% and 28% for the young and AGN heating sources, respectively. The remaining energy can be attributed to the small bulge of old stars. FIR-based SFR indica-tors or dust mass estimates which include this part of the galaxy are therefore susceptible to significant bias due to both the AGN and the radiation field generated by the old stellar populations.
This study is the third in a series after Verstocken et al.
(2020) andNersesian et al. (2020) where we investigated the effect of dust heating in face-on large galaxies in the DustPedia database. The novelty of this study is that we added an AGN in the model as a source of radiation. We have pushed our mod-els to the limit by requiring high-resolution images from FUV to submm wavelengths, and by fitting 3D radiative transfer simula-tions to these data. We are thus for the first time able to quantify the dust heating fraction for separate heating sources in a sample of galaxies. Our main conclusion is that star formation alone is inadequate to explain the observed FIR emission. In all cases, a significant contribution from the old stellar population is needed. In the particular case of NGC 1068, a low-luminosity AGN is also required to match the observations. In systems hosting a stronger AGN or in quasars, the AGN-powered heating of the diffuse dust will be even higher. Hence, simply removing a (fit-ted) AGN torus component from the FIR flux will still lead to an overestimation of the SFR of the host galaxy.
These findings, in particular the necessity for multiple heat-ing sources, should be considered when buildheat-ing the next gener-ation of galaxy SED modelling tools.
Acknowledgements. DustPedia is a project funded by the EU (Grant agree-ment number 606847) under the heading “Exploitation of space science and exploration data (FP7-SPACE-2013-1)” and is a collaboration of six European institutes: Cardiff University (UK), National Observatory of Athens (Greece), Instituto Nazionale di Astrofisica (Italy), Universiteit Gent (Belgium), CEA