HAL Id: hal-02322207
https://hal.archives-ouvertes.fr/hal-02322207
Submitted on 27 Oct 2020
HAL is a multi-disciplinary open access
archive for the deposit and dissemination of
sci-entific research documents, whether they are
pub-lished or not. The documents may come from
teaching and research institutions in France or
abroad, or from public or private research centers.
L’archive ouverte pluridisciplinaire HAL, est
destinée au dépôt et à la diffusion de documents
scientifiques de niveau recherche, publiés ou non,
émanant des établissements d’enseignement et de
recherche français ou étrangers, des laboratoires
publics ou privés.
atmospheric simulation chamber SAPHIR
Hendrik Fuchs, Anna Novelli, Michael Rolletter, Andreas Hofzumahaus, Eva
Pfannerstill, Stephan Kessel, Achim Edtbauer, Jonathan Williams, Vincent
Michoud, Sébastien Dusanter, et al.
To cite this version:
Hendrik Fuchs, Anna Novelli, Michael Rolletter, Andreas Hofzumahaus, Eva Pfannerstill, et al..
Com-parison of OH reactivity measurements in the atmospheric simulation chamber SAPHIR. Atmospheric
Measurement Techniques, European Geosciences Union, 2017, 10 (10), pp.4023-4053.
�10.5194/amt-10-4023-2017�. �hal-02322207�
https://doi.org/10.5194/amt-10-4023-2017 © Author(s) 2017. This work is distributed under the Creative Commons Attribution 4.0 License.
Comparison of OH reactivity measurements in the atmospheric
simulation chamber SAPHIR
Hendrik Fuchs1, Anna Novelli1, Michael Rolletter1, Andreas Hofzumahaus1, Eva Y. Pfannerstill2, Stephan Kessel2, Achim Edtbauer2, Jonathan Williams2, Vincent Michoud3,11, Sebastien Dusanter3, Nadine Locoge3, Nora Zannoni4,a, Valerie Gros4, Francois Truong4, Roland Sarda-Esteve4, Danny R. Cryer5, Charlotte A. Brumby5, Lisa K. Whalley5,6, Daniel Stone5, Paul W. Seakins5,6, Dwayne E. Heard5,6, Coralie Schoemaecker7, Marion Blocquet7,b,
Sebastien Coudert7, Sebastien Batut7, Christa Fittschen7, Alexander B. Thames8, William H. Brune8,
Cheryl Ernest2,c, Hartwig Harder2, Jennifer B. A. Muller9, Thomas Elste9, Dagmar Kubistin9, Stefanie Andres1, Birger Bohn1, Thorsten Hohaus1, Frank Holland1, Xin Li1,d, Franz Rohrer1, Astrid Kiendler-Scharr1,
Ralf Tillmann1, Robert Wegener1, Zhujun Yu1, Qi Zou10, and Andreas Wahner1
1Institute of Energy and Climate Research, IEK-8: Troposphere, Forschungszentrum Jülich GmbH, Jülich, Germany 2Air Chemistry Department, Max Planck Institute for Chemistry, Mainz, Germany
3IMT Lille Douai, Université Lille, SAGE – Département Sciences de l’Atmosphère et Génie de l’Environnement, Lille, France
4Laboratoire des Sciences du Climat et de l’Environnement, LSCE/IPSL, CEA-CNRS-UVSQ, Université Paris-Saclay, Gif-sur-Yvette, France
5School of Chemistry, University of Leeds, Leeds, LS2 9JT, UK
6National Centre for Atmospheric Science, University of Leeds, Leeds, LS2 9JT, UK
7Lille, CNRS, UMR8522 – PC2A – Physicochimie des Processus de Combustion et de l’Atmosphère, Lille, Université Lille, Villeneuve d’Ascq, France
8Department of Meteorology, Pennsylvania State University, University Park, PA, USA
9Meteorological Observatory Hohenpeissenberg, German Meteorological Service (DWD), Hohenpeissenberg, Germany 10College of Environmental Sciences and Engineering, Peking University, Beijing, China
11LISA, UMR7583 – CNRS, Universités Paris Est Créteil et Paris Diderot, Institut Pierre Simon Laplace, Paris, France anow at: Air Chemistry Department, Max Planck Institute for Chemistry, Mainz, Germany
bnow at: Institute of Energy and Climate Research, IEK-8: Troposphere, Forschungszentrum Jülich GmbH, Jülich, Germany cnow at: University Medical Center of the Johannes Gutenberg University Mainz, Mainz, Germany
dnow at: College of Environmental Sciences and Engineering, Peking University, Beijing, China
Correspondence to:Hendrik Fuchs (h.fuchs@fz-juelich.de)
Received: 9 July 2017 – Discussion started: 28 July 2017
Revised: 25 September 2017 – Accepted: 25 September 2017 – Published: 27 October 2017
Abstract. Hydroxyl (OH) radical reactivity (kOH) has been measured for 18 years with different measurement tech-niques. In order to compare the performances of instruments deployed in the field, two campaigns were conducted per-forming experiments in the atmospheric simulation chamber SAPHIR at Forschungszentrum Jülich in October 2015 and April 2016. Chemical conditions were chosen either to be representative of the atmosphere or to test potential limita-tions of instruments. All types of instruments that are
cur-rently used for atmospheric measurements were used in one of the two campaigns. The results of these campaigns demon-strate that OH reactivity can be accurately measured for a wide range of atmospherically relevant chemical conditions (e.g. water vapour, nitrogen oxides, various organic com-pounds) by all instruments. The precision of the measure-ments (limit of detection < 1 s−1at a time resolution of 30 s to a few minutes) is higher for instruments directly detecting hydroxyl radicals, whereas the indirect comparative
reactiv-ity method (CRM) has a higher limit of detection of 2 s−1at a time resolution of 10 to 15 min. The performances of the in-struments were systematically tested by stepwise increasing, for example, the concentrations of carbon monoxide (CO), water vapour or nitric oxide (NO). In further experiments, mixtures of organic reactants were injected into the cham-ber to simulate urban and forested environments. Overall, the results show that the instruments are capable of measuring OH reactivity in the presence of CO, alkanes, alkenes and aromatic compounds. The transmission efficiency in Teflon inlet lines could have introduced systematic errors in mea-surements for low-volatile organic compounds in some in-struments. CRM instruments exhibited a larger scatter in the data compared to the other instruments. The largest differ-ences to reference measurements or to calculated reactivity were observed by CRM instruments in the presence of ter-penes and oxygenated organic compounds (mixing ratio of OH reactants were up to 10 ppbv). In some of these experi-ments, only a small fraction of the reactivity is detected. The accuracy of CRM measurements is most likely limited by the corrections that need to be applied to account for known ef-fects of, for example, deviations from pseudo first-order con-ditions, nitrogen oxides or water vapour on the measurement. Methods used to derive these corrections vary among the dif-ferent CRM instruments. Measurements taken with a flow-tube instrument combined with the direct detection of OH by chemical ionisation mass spectrometry (CIMS) show limita-tions in cases of high reactivity and high NO concentralimita-tions but were accurate for low reactivity (< 15 s−1) and low NO (< 5 ppbv) conditions.
1 Introduction
Most gas species in the atmosphere are transformed by their reaction with the hydroxyl radical (OH). These processes lead to the formation of oxidised, secondary pollutants such as ozone and aerosol. Due to the large number of organic OH reactants (Goldstein and Galbally, 2007), several meth-ods have been developed in order to measure OH reactivity (the inverse OH lifetime). OH reactivity (kOH) is the sum of OH reactant concentrations ([X]) weighted by their reaction rate coefficient with OH (kOH+X):
kOH= X
i
kOH+Xi[Xi] . (1)
Predicting trace gas loadings and lifetimes requires a com-prehensive understanding of the atmosphere’s chemical cy-cling and oxidative capacity, which is aided by the measure-ment of total OH reactivity. Measuremeasure-ments can be compared to calculations from OH reactant concentrations in order to quantify unexplained reactivity. In addition, the total loss rate of OH can be calculated if OH concentrations are concur-rently measured in order to analyse the OH budget by
com-paring the total OH loss rate with the sum of OH production rates.
The measurement of OH reactivity has been shown to be extremely useful (Yang et al., 2016). Up to several tens per second unexplained reactivity was identified in biogenic-dominated environments such as in a forest in Michigan (Di Carlo et al., 2004; Hansen et al., 2014), in the Amazo-nian rainforest (Nölscher et al., 2016) and in a boreal for-est in Finland (Nölscher et al., 2012b). The magnitude of missing reactivity appears to be dependent on the biogenic source, time of the day and season (Williams et al., 2016; Nölscher et al., 2016). However, the agreement between mea-sured and calculated reactivity is also a valuable result, be-cause it indicates that all trace gases that are relevant for the photochemistry were measured. This was the case in envi-ronments that were influenced by anthropogenic OH reac-tants as in New York (Ren et al., 2003) and in the North China Plain (Fuchs et al., 2016), in isoprene-dominated envi-ronments during daytime in a Mediterranean forest (Zannoni et al., 2016) and in a chamber study (Nölscher et al., 2014). In addition, the gap between measured and calculated OH re-activity could be closed in some field studies if oxygenated VOCs (volatile organic compounds) derived from model cal-culation were additionally taken into account (e.g. Chatani et al., 2009; Lou et al., 2010; Kaiser et al., 2016; Whalley et al., 2016). First attempts were also made to measure OH reactivity fluxes (Nölscher et al., 2013).
The application of OH reactivity measurements for the analysis of the OH budget also provided new results. A gap in the understanding of OH recycling processes was found in a field study in Nashville in 1999 (Martinez et al., 2003), in China in 2006 (Hofzumahaus et al., 2009), in Borneo in 2008 (Whalley et al., 2011) and in chamber experiments investi-gating the oxidation of isoprene by OH (Fuchs et al., 2013). Because of the close connection between oxidation of or-ganic compounds by OH and ozone production, OH reactiv-ity can help to calculate local ozone production rates (Sinha et al., 2012).
Several methods to measure OH reactivity have been de-veloped since the first measurements were made by Penn State University (PSU) (Kovacs and Brune, 2001). The dif-ferent methods fall into two categories. One method deter-mines the OH reactivity directly from the time-dependent decay of measured OH that is artificially produced. The other method determines kOH indirectly from the concen-tration change of a reference species, which competes with atmospheric reactants in their reaction with artificially pro-duced OH.
In the instrument developed by Kovacs and Brune (2001), the decay of OH is measured in a flow tube through which ambient air is drawn by the direct detection of OH using laser-induced fluorescence. OH is continuously produced by water photolysis. The time-resolved OH decay is measured by varying the reaction time using a movable injector to pro-duce OH. A compact aircraft instrument was later developed
by PSU and deployed for the first time in 2006 (Mao et al., 2009). Similar instruments were built at Indiana University (Hansen et al., 2014) and at the University of Leeds (Ingham et al., 2009). The latter apparatus was recently replaced by an instrument applying a pump-probe technique (see below). In an alternative instrument a flow-tube set-up is combined with a chemical ionisation mass spectrometer (CIMS) which detects sulfuric acid (H2SO4) following the chemical conver-sion of OH to H2SO4(Berresheim et al., 2000; Muller et al., 2017). In this instrument developed by the German Meteo-rological Service (DWD), OH is produced by water photol-ysis in the flow tube. The reaction of OH with ambient OH reactants is terminated by chemically removing OH by its re-action with sulfur dioxide, which is injected at two positions within the flow tube, giving one reaction time for the OH de-cay. The remaining OH concentrations for the two injection positions are measured to calculate the OH reactivity.
Sadanaga et al. (2004) developed an instrument that uses a pump-probe technique, called laser photolysis – laser-induced fluorescence (LP–LIF). OH is produced by ozone photolysis using radiation of short laser pulse at 266 nm at a low repetition rate of 1 to 2 Hz. The OH decay is observed by laser-induced fluorescence with a high time resolution. The pump-probe technique has the advantage that the flow conditions do not need to be exactly known in order to deter-mine a reaction time. This technique is now used by several groups such as Tokyo Metropolitan University (Sadanaga et al., 2004), the University of Leeds (Stone et al., 2016), the University of Lille (Parker et al., 2011) and Forschungszen-trum Jülich (FZJ) (Lou et al., 2010).
The indirect technique for the measurement of OH reac-tivity was pioneered by Sinha et al. (2008). The comparative reactivity method (CRM) is based on the detection of pyrrole that reacts with artificially produced OH in clean or ambient air. The pyrrole competes with the ambient OH reactants, so that the pyrrole concentration depends on the ambient OH reactivity. In most CRM instruments, pyrrole is detected by proton-transfer-reaction mass-spectrometry (PTR-MS) but can also be detected by gas chromatography (GC) (Nölscher et al., 2012a). The CRM method is more commonly used than the direct OH measurement techniques because of the commercial availability of PTR-MS instruments. It is applied by the Max Planck Institute Mainz (MPI) (Sinha et al., 2008), IMT Lille Douai, formally called Mines Douai (MDOUAI) (Hansen et al., 2015; Michoud et al., 2015), Laboratoire des Sciences du Climat et de l’Environnement (LSCE) (Zannoni et al., 2015), Indian Institute of Science Education and Re-search Mohali (Kumar et al., 2014), the Finnish Meteorolog-ical Institute (Praplan et al., 2017), Peking University (Yang et al., 2017), the University of Leicester and University of California, Irvine (Kim et al., 2016).
Only two side-by-side comparisons have been performed between two CRM instruments in a remote environment (Zannoni et al., 2015) and between a CRM and a pump-probe instrument in an urban environment (Hansen et al., 2015).
Both comparisons show generally good agreement between measurements within 20 to 50 %.
In 2014 a workshop was held at the Max Planck Institute for Chemistry in Mainz in order to assess the current sta-tus and future of OH reactivity measurements (Williams and Brune, 2015). At the workshop, a comparison campaign was suggested to investigate the performance of instruments un-der different atmospheric chemical conditions. Large envi-ronmental chambers are ideal for this purpose, as they en-sure that all instruments sample air with the same chemical composition. In addition, chemical conditions can be system-atically varied. This was demonstrated in several comparison exercises in the atmospheric simulation chamber SAPHIR at Forschungszentrum Jülich (e.g. Schlosser et al., 2009; Dorn et al., 2013) as well as in the EUPHORE chamber (e.g. Pang et al., 2014). Here, we report the results of two kOH compari-son campaigns that were conducted in the SAPHIR chamber. The two comparisons were not blind: quick-look data were presented from some groups during the campaigns. After first data submission without the knowledge of the final results from other participants or OH reactant concentrations, data were allowed to be revised. Only final data are presented in this paper, but changes after the first data submission are de-scribed.
A large number of OH reactivity instruments applying dif-ferent techniques were successfully used in these campaigns (CRM instruments of MPI, IMT Lille Douai and LSCE; a flow-tube LIF instrument from PSU; a CIMS instrument from DWD and LP–LIF instruments from Lille, Leeds and FZJ, Table 1). The CRM instrument from the Finnish Mete-orological Institute was also used in the campaign, but mea-surements by this instrument failed due to technical problems and no valid data could be acquired.
2 Experiments in the SAPHIR chamber
2.1 The SAPHIR chamber
The outdoor atmospheric simulation chamber SAPHIR is made of a double-wall Teflon (FEP) film and has a cylindri-cal shape (5 m diameter, 18 m length). The Teflon chamber is mounted inside a steel frame that is equipped with a shut-ter system that allows for experiments in the dark or in the presence of sunlight. The space between the inner and outer Teflon film is continuously purged with nitrogen (Linde, pu-rity > 99.9999 %) to prevent contamination from outside. In addition, the pressure inside the chamber is 45 Pa higher than ambient pressure. Small leakages and air sampling by instru-ments require the air to be replenished to maintain the pres-sure difference. This leads to a small dilution of trace gases by 3 to 5 % per hour. The dilution can be as high as 60 % per hour if the replenishment flow needs to be high.
Ultra-pure air (Linde, purity > 99.9999 %) is used to purge the chamber with a high flow (up to 250 m3h−1) in order to
T able 1. Specification of instrument parameters of OH reacti vity instruments in these campaigns. Instrument T echnique T ime res./ 1 σ LOD a / 1 σ accur .a Flo w rate/ [OH ]/ Inlet res. Inlet line Reference s s− 1 (@ k OH ) L min − 1 10 10 cm − 3 time/s MDOU AI b CRM c 600 1 18 % 0.37 d 72 e ,f 5 1 / 400 PF A Michoud et al. (2015 ) LSCE b CRM c 600 1 35 % 0.23 d 78 e ,f 6 1 / 400 PF A Zannoni et al. (2015 ) MPI b ,g CRM c 900 1.6 b 37 % 0.38 75 e ,f 6 1 / 400 PF A (heated) b Sinha et al. (2008 ) 1.3 g 1 / 200 PF A (heated) g PSU b FT -LIF i 30 0.5 j 23 % (< 2 s− 1 ) 100 0.5 e 1 100 PF A K o v acs and Brune (2001 ) 8 % (10 to 100 s− 1 ) Mao et al. (2009 ) 7 % (> 100 s− 1 ) Lille b LP–LIF h 30 to 60 0.4 8 % 9.5 0.6 k 4 1 / 200 PF A P ark er et al. (2011 ) Leeds b LP–LIF h 100 0.4 to 1.0 6 % 16 3 k 2.5 1 / 200 PF A Stone et al. (2016 ) FZJM b LP–LIF h 40 to 160 0.2 10 % 15 0.7 k 0.5 10 mm steel Lou et al. (2010 ) (Silconert coating) Fuchs et al. (2016 ) FZJS b ,g LP–LIF h 60 0.1 10 % 20 0.8 k 0.5 10 mm steel Lou et al. (2010 ) (Silconert coating) D WD g FT -CIMS l 60 to 300 0.5 1 s− 1 (< 30 s− 1 ) 2280 m 0.01 e no additional inlet line Berresheim et al. (2000 ) 2 s− 1 (30 to 40 s− 1 ) a Limit of detection/accurac y as stated by the operator . b October 2015. c Comparati v e reacti vity measurement. d F aster flo w of 1 L min − 1 in inlet line. e Produced continuously by w ater photolysis (185 radiation of a Pen-Ray lamp). f Deri v ed from the dif ference in the C1 and C2 measurement. g April 2016. h Laser flash photolysis and laser -induced fluorescence. i Flo w-tube and laser -i nd uced fluorescence. j Limit of detection without the dilution, which amplifies this number by a factor of 5. k Peak v alue produced by flash ozone photolysis (266 nm of a quadrupled Nd:Y A G laser). l Flo w-tube and chemical-ionisation mass-spectrometry . m Sampling rate from the chamber .
Table 2. Specification of instruments measuring OH reactant concentrations in the two campaigns.
OH reactant Measurement 1σ accuracy 1σ precision Reaction rate constant
CO Piccarro CRDS, GC (RGA) 15 ppbv, 8 % 5 ppbv Atkinson et al. (2006); IUPAC (2017)
NO chemiluminescence 5 % 4 pptv Atkinson et al. (2004); IUPAC (2017)
NO2 chemiluminescence 5 % 4 pptv Atkinson et al. (2004); IUPAC (2017)
O3 UV photometer 5 % 1 ppbv Atkinson et al. (2006); IUPAC (2017)
CH4 Piccarro CRDS 1 ppbv 1 ppbv Atkinson et al. (2006); IUPAC (2017)
n-pentane GC-FID 13 % 20 pptv Atkinson et al. (2006); IUPAC (2017)
1-pentene GC-FID, PTR-TOF-MS 13, 4 % 20, 19 pptv Atkinson (1997); MCM (2017)
toluene GC-FID, PTR-TOF-MS 13, 7 % 20, 7 pptv Atkinson et al. (2006); IUPAC (2017)
o-xylene GC-FID, PTR-TOF-MS 13, 2 % 10, 3 pptv Mehta et al. (2009)
isoprene GC-FID, PTR-TOF-MS 13, 6 % 20, 33 pptv Atkinson et al. (2006); IUPAC (2017)
MVK GC-FID 13 % 30 pptv Atkinson et al. (2006); IUPAC (2017)
MACR GC-FID 13 % 30 pptv Atkinson et al. (2006); IUPAC (2017)
MVK + MACR PTR-TOF-MS 6 % 22 pptv
α-pinene GC-FID 13 % 10 pptv Atkinson et al. (2006); IUPAC (2017)
limonene GC-FID 13 % 10 pptv Gill and Hites (2002)
myrcene GC-FID 13 % 10 pptv Kim et al. (2011)
β-pinene GC-FID 13 % 10 pptv Gill and Hites (2002)
camphene GC-FID 13 % 10 pptv Atkinson et al. (1990)
13-carene GC-FID 13 % 10 pptv Atkinson et al. (1986)
β-ocimene GC-FID 13 % 10 pptv Kim et al. (2011)
β-phellandrene GC-FID 13 % 10 pptv Atkinson et al. (2006); IUPAC (2017)
sum monoterpenes PTR-TOF-MS 4 % 5 pptv
β-caryophyllene GC-FID, PTR-TOF-MS 13 6 %a 10, 15 pptv Atkinson et al. (2006); IUPAC (2017)
HCHO Hantzsch monitor 5 % 18 pptv Atkinson et al. (2006); IUPAC (2017)
CH3CHO GC-FID, PTR-TOF-MS 13, 6 %b 200, 40 pptv Atkinson et al. (2006); IUPAC (2017)
aPTR-TOF-MS measurements 40 % lower than GC-FID in 2016.bPTR-TOF-MS measurements 50 % higher than GC-FID in 2016.
clean the chamber. The high flow rate is also required to hu-midify the chamber air with steam from boiling water that is supplied by a Milli-Q water device. Ozone produced by a silent discharge ozoniser can be added to the chamber air. Two fans ensure that the air is well mixed, so that all instru-ments always sample the same air mass (e.g. Schlosser et al., 2009; Dorn et al., 2013).
The use of high-purity air ensures that there are no mea-surable gaseous OH reactants present in the chamber after the purging procedure. Small amounts of mostly unidentified or-ganic compounds and nitrogen oxide compounds like HONO (< 100 pptv) can be observed in some cases during the hu-midification. The total OH reactivity measured by the OH re-activity instrument that is permanently installed at the cham-ber shows that the reactivity is typically well below 1 s−1 af-ter humidification. In fact, instruments measured on average no significant OH reactivity in these campaigns in the clean chamber (see below).
If the chamber is exposed to sunlight, well-characterised sources for HONO, formaldehyde and acetaldehyde lead to an increase in OH reactivity (production rates are typically 200 pptv h−1). Photolysis of HONO (Rohrer et al., 2005) is also the dominant source of OH and nitrogen oxides in the chamber. The source strength depends on the relative humid-ity, temperature and radiation. The overall increase in OH
reactivity is of the order of 0.2 s−1 per hour, and is much smaller than the reactivity from added OH reactants in these campaigns.
OH reactants were added either from gas mixtures via cal-ibrated flow controllers or as liquids that were injected into a heated inlet line with a syringe. The vapours were transported by a flow of synthetic air into the chamber. In addition, a re-cently built plant chamber allows for the quantitative trans-fer of mixtures of biogenic organic compounds from up to six trees into the SAPHIR chamber (Hohaus et al., 2016). Environmental parameters in the plant chamber can be fully controlled.
2.2 Calculated OH reactivity
A number of instruments for the detection of OH reactants took measurements concurrently with the OH reactivity in-struments (Table 2). Nitrogen oxides (NO and NO2) were detected by a chemiluminescence instrument (Eco Physics TR 780). CO was measured using a Piccarro cavity ring-down instrument (Picarro G2301) and by gas chromatog-raphy (GC, Trace Analytical RGA 3). Both measurements agreed within 5 %. Data from the cavity ring-down instru-ment were used here for calculations of the OH reactivity due to its higher accuracy. This instrument also measured
methane and water vapour concentrations. Organic com-pounds were detected by PTR-TOF-MS (proton-transfer-reaction time-of-flight mass-spectrometry, Ionicon) and GC (Agilent 7890N). Measurements agreed for those species that could be detected by both instruments, such as isoprene bet-ter than 20 % with some larger discrepancies for acetalde-hyde and β-caryophyllene in the second set of experiments in 2016 (Table 2). Differences between measurements need to be regarded as additional uncertainties in the calculation of OH reactivity.
PTR-TOF-MS measures the sum of methyl vinyl ke-tone (MVK) and methacrolein (MACR) and the sum of monoterpenes. In order to calculate OH reactivity, PTR-TOF-MS measurements were used taking the relative distri-bution of MVK and MACR and monoterpenes as measured by GC, because PTR-TOF-MS has a high time resolution. Formaldehyde was additionally measured by a Hantzsch monitor (Aero Laser AL 4001). All reaction rate constants used for the calculation of OH reactivity are taken from IUPAC (International Union of Pure and Applied Chem-istry) recommendations (Atkinson et al., 2004, 2006; IU-PAC, 2017) if not stated differently in Table 2. Tempera-ture and pressure are assumed to be the same in the instru-ments and the SAPHIR chamber. This approach is applica-ble as indicated by temperature and pressure measurements in the instruments. The overall 1σ uncertainty of the cal-culated OH reactivity is around 20 % in most experiments but can be higher (e.g. 40 % in case of the experiment with sesquiterpenes) depending on the uncertainty in the OH re-actant measurements, the agreement between simultaneous measurements by different instruments and the uncertainty in reaction rate constants.
2.3 Experiments performed in 2015
Two campaigns were conducted for this comparison. The first one took place in October 2015. All instruments listed in Table 1 were used in this campaign with the exception of the CIMS instrument.
In the experiments, the chamber was flushed with high-purity air before each experiment, until trace gas concentra-tions were below the limit of detection of instruments (Ta-ble 2). The chamber air was humidified to approximately 75 % relative humidity (RH) at the beginning of each exper-iment, except for the experiment on 6 October 2015, when the experiment was started with 25 % RH and the humidity was increased to 90 % RH in three steps. Relative humidity typically dropped to 40 to 50 % during the experiment due to temperature changes and dilution. Ozone was also added at the beginning of the experiments to allow OH production in the LP–LIF instruments if ozone was not expected to affect the chemical composition of the chamber air (e.g. by ozonol-ysis reaction or by the conversion of NO to NO2). Initial ozone mixing ratios were typically between 50 and 80 ppbv.
OH reactivity was typically increased in several steps to maximum values of approximately 50 s−1at the end of the experiment (maximum 150 s−1). The time between two in-jections of trace gases was approximately 45 min. In addi-tion, chemical conditions were changed during the course of some experiments, such as opening or closing the chamber roof or adding nitrogen oxides or water vapour. Chemical conditions in the different experiments are summarised in Ta-ble 3.
Some experiments aimed to primarily test the instruments’ performances: linearity with CO (5 October 2015), the influ-ence of humidity (6 October 2015) and the presinflu-ence of NO (7 October 2015). The last test was repeated on 15 October. However, due to an operational error, ozone was added at the beginning of the experiment, so that a mixture of NO and NO2was present. In order to reduce the ozone concen-tration, 2,3-dimethyl-2-butene (TME), which reacts rapidly with ozone, was injected twice.
The other experiments focused on the instruments’ perfor-mances in the presence of specific OH reactants and atmo-spheric mixtures of reactants. In part of these experiments, OH reactants were also oxidised by either OH or ozone. In five experiments, biogenic reactants were present: iso-prene (11 October 2015), isoiso-prene oxidation products MVK and MACR (16 October 2015), a mix of monoterpenes (α-pinene, limonene, myrcene, 9 October 2015) and a sesquiter-pene (β-caryophyllene, 16 October 2015). In another exper-iment with biogenic reactants, emissions from plants (3 pine and 3 spruce) were transferred into the chamber at a flow rate of 11 m3h−1. In two experiments, an urban environment was simulated by a mixture of 1-pentene, o-xylene and toluene together with NO2(12 and 13 October 2015). On 16 Octo-ber 2015, acetaldehyde was injected.
2.4 Experiments performed in 2016
In the second campaign in 2016, only three instruments mea-sured OH reactivity: a CRM instrument (MPI), a LP–LIF instrument (FZJS) and the CIMS instrument from DWD. The CRM and LP–LIF instruments were the same as in the 2015 campaign. The CIMS instrument sampled air with a high flow rate (2280 L min−1), requiring the chamber to be operated with a high replenishment flow. As a consequence, all trace gases were diluted at a high rate of approximately 60 % per hour. Oxidation products could not accumulate. Accordingly, the experimental procedure was different in these experiments compared to those in 2015: humidifica-tion was done two to four times over the course of an exper-iment in order to maintain a sufficiently high water vapour concentration for the production of OH in the LP–LIF and CIMS instruments (typical range of relative humidity be-tween 25 and 80 %). If ozone was present in the experiment, ozone was also injected several times. Initial ozone concen-trations were around 100 ppbv and dropped to 20 ppbv be-fore re-injection. Similar chemical conditions as in the first
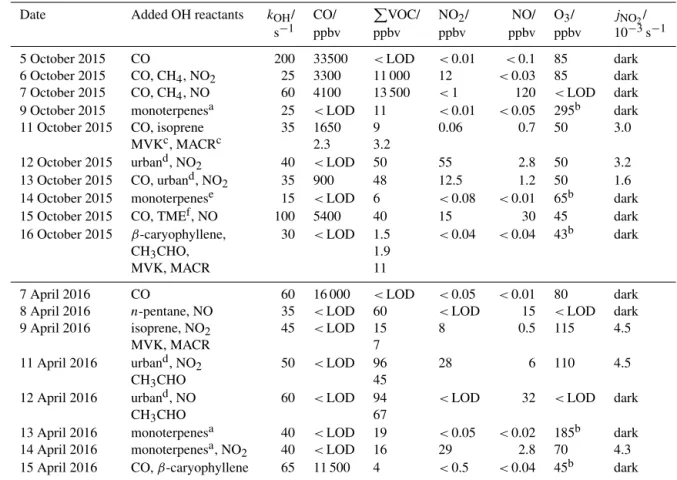
Table 3. Conditions during the experiments. Maximum concentrations during the experiments are given. Maximum values for OH reactivity are approximate values that do not refer to a specific instrument. Photolysis reactions were possible if the chamber roof was open (mostly
only part of the experiment). A mixture of aromatic compounds, alkenes and NOxspecies is summarised as “urban” conditions.
Date Added OH reactants kOH/ CO/ PVOC/ NO2/ NO/ O3/ jNO2/
s−1 ppbv ppbv ppbv ppbv ppbv 10−3s−1
5 October 2015 CO 200 33500 <LOD <0.01 <0.1 85 dark
6 October 2015 CO, CH4, NO2 25 3300 11 000 12 <0.03 85 dark
7 October 2015 CO, CH4, NO 60 4100 13 500 <1 120 <LOD dark
9 October 2015 monoterpenesa 25 <LOD 11 <0.01 <0.05 295b dark
11 October 2015 CO, isoprene 35 1650 9 0.06 0.7 50 3.0
MVKc, MACRc 2.3 3.2
12 October 2015 urband, NO2 40 <LOD 50 55 2.8 50 3.2
13 October 2015 CO, urband, NO2 35 900 48 12.5 1.2 50 1.6
14 October 2015 monoterpenese 15 <LOD 6 <0.08 <0.01 65b dark
15 October 2015 CO, TMEf, NO 100 5400 40 15 30 45 dark
16 October 2015 β-caryophyllene, 30 <LOD 1.5 <0.04 <0.04 43b dark
CH3CHO, 1.9
MVK, MACR 11
7 April 2016 CO 60 16 000 <LOD <0.05 <0.01 80 dark
8 April 2016 n-pentane, NO 35 <LOD 60 <LOD 15 <LOD dark
9 April 2016 isoprene, NO2 45 <LOD 15 8 0.5 115 4.5
MVK, MACR 7
11 April 2016 urband, NO2 50 <LOD 96 28 6 110 4.5
CH3CHO 45
12 April 2016 urband, NO 60 <LOD 94 <LOD 32 <LOD dark
CH3CHO 67
13 April 2016 monoterpenesa 40 <LOD 19 <0.05 <0.02 185b dark
14 April 2016 monoterpenesa, NO2 40 <LOD 16 29 2.8 70 4.3
15 April 2016 CO, β-caryophyllene 65 11 500 4 <0.5 <0.04 45b dark
aα-pinene, limonene, myrcene (liquid volume ratio 0.68 : 0.11 : 0.21).bAdded at later times for ozonolysis.cPhotochemically formed.do-xylene,
toluene, 1-pentene (liquid volume ratio 1 : 1 : 1).eIdentified compounds of plant emissions: α-pinene, β-pinene, limonene, myrcene, camphene, 13-carene, ocimene, β-phellandrene.f2,3-dimethyl-2-butene.
campaign were tested in order to achieve comparable re-sults. Tests were done with single, anthropogenic OH reac-tants (CO, pentane) in the presence (8 April 2016) and in the absence (7 and 15 April 2016) of NO, with biogenic reac-tants (isoprene, MVK, MACR on 9 April 2016, a monoter-pene mixture on 13 and 14 April 2016, β-caryophyllene on 15 April 2016) and with a mixture of anthropogenic reactants (11 and 12 April 2016). The same monoterpene and urban re-actant mixtures were used as in the experiments in 2015 and in 2016.
2.5 Data coverage
The CRM instrument from the Finnish Meteorological In-stitute (FMI) was used in the first campaign, but no valid measurements could be acquired due to technical problems of this instrument. Data were submitted for all other in-struments for nearly all experiments and are included in the comparison. A leak in the OH injection system of the MDOUAI CRM instrument was found after the third exper-iments and this leak possibly led to systematic errors in the
measurements in this experiment. Data from the experiment on 7 October 2015 were therefore rejected for this instru-ment. The sampling system of the CRM instrument from LSCE was changed on the second day of the campaign (6 Oc-tober 2015). Measurements from this experiment were re-jected. On 12 October 2015, the flow-tube instrument from PSU did not take measurements, except for the last 2 h due to technical problems. All other instruments took measure-ments at all times during the campaign.
2.6 Procedure of data comparison
The measurement comparison was not strictly blind, but some rules were applied to which all participants had agreed prior to the campaign. The general outline of the campaign was as follows:
– Before the official campaign started, a test experiment with CO was performed in the SAPHIR chamber. Dur-ing this experiment, the participants were informed about the added CO concentrations in order to test the
functionality of their instruments (4 October 2015, not included in the comparison, and 7 April 2016).
– During the campaign, participants were informed about the types of trace gases which were planned to be added to the chamber air before the experiments. Concentra-tions of reactants, however, were not disclosed to the participants.
– During the campaign, participants had the opportunity to present quick-look data of measured values at daily meetings, but data were not exchanged or distributed.
– After the campaign, all participants independently sub-mitted their evaluated data to a neutral person at Forschungszentrum Jülich who was not involved in activity measurements. Only after all data were re-ceived, the measured trace gas concentrations and the kOHdata on all participants were made available.
– After data disclosure, some participants applied correc-tions to their data and submitted a revised data set to-gether with an explanation for the correction.
– The comparison in this paper is based on the final data versions.
Changes of data that were made as a result of the comparison are described in the next section for each instrument.
3 Instruments for the detection of OH reactivity
3.1 Comparative reactivity method (CRM)
The comparative reactivity method (CRM) is an indirect method for the measurement of OH reactivity developed by Sinha et al. (2008). The measurement principle relies on the competition of the reaction of OH with either a known pyr-role concentration or ambient OH reactants. Pyrpyr-role acts as a reference species that is typically not present in ambient air. A small flow of humidified, ultra-pure nitrogen (flow rate approximately 240 cm3min−1) passes over a Pen-Ray lamp, leading to formation of OH by water photolysis at 185 nm with concentrations of approximately 1 to 3 × 1012cm−3 (Table 1). Water photolysis, however, not only produces OH but also HO2radicals. The higher reactivity of OH compared to HO2, also towards surfaces, may lead to HO2 concentra-tions exceeding the concentration of OH in the reactor.
Ambient OH reactants and/or pyrrole react with OH in a reaction volume (94 cm3) made of glass, with the in-ner surface covered by Teflon. The instrument is alternately switched between two measurement modes: the small flow of pyrrole (approx. 2 to 3 cm3min−1) is mixed into a flow of purified air (C2-mode) (approximately 300 cm3min−1) or into a flow of ambient air (air sampled from the chamber in these experiments) (C3-mode). As OH exclusively reacts
with pyrrole in the C2-mode, maximum reduction of the pyr-role concentration is achieved, whereas the pyrpyr-role concen-tration is higher in the C3-mode, when ambient OH reactants are also present. In order to calculate the OH reactivity, the initial pyrrole concentration needs to be known (typically 1 to 2 × 1012cm−3). Because a small fraction of the radiation of the Pen-Ray lamp enters the reaction volume, a small frac-tion of the pyrrole is photolysed (typically less than 10 %). Therefore, the pyrrole concentration is measured when zero air is sampled and when the light of the Pen-Ray lamp is turned on (C1-mode). This is typically done once a day.
The design of the reaction volume is identical for all in-struments, because they were all manufactured by the Max Planck Institute for Chemistry in Mainz. Three CRM instru-ments are included in this comparison, by MPI, IMT Lille Douai (MDOUAI) and LSCE. The instruments differ mainly in the exact operational conditions such as flow rate, pyrrole and OH concentration and the inlet lines (Table 1). The trans-formation of raw data into kOH values requires corrections (Michoud et al., 2015) that have been characterised for each CRM instrument (Table 4). These corrections, described be-low, can significantly differ between instruments due to the different operating conditions.
The pyrrole concentration is monitored by proton-transfer-reaction mass-spectrometry (PTR-MS) in nearly all instru-ments but can also be detected by GC (Nölscher et al., 2012a). This is done for the instrument from the Finnish Me-teorological Institute.
A number of corrections need to be applied to the signals measured in the different modes due to a variety of factors (Michoud et al., 2015):
– The OH production rate in the two measurement modes can be different if the water vapour concentration is not the same in both modes.
– OH can be significantly reformed by the reaction of HO2that is present at high concentrations in the reactor with ambient NO.
– The reaction deviates from pseudo first-order condi-tions.
– Ambient OH reactant concentrations are diluted due to the additional nitrogen flow. The dilution factor is cal-culated from measured flow rates.
Corrections are usually determined from instrumental characterisation in the laboratory and in the field, with the assumption that they are representative of ambient air mea-surements. Typical values of corrections are listed in Table 4. All groups operating a CRM used empirical functions to correct for deviations from the pseudo first-order decay for the final data evaluation (Michoud et al., 2015). The exact value, however, depends on the chemical composition of OH reactants (see below). Different representative mixtures are taken to characterise of this correction for the various CRM
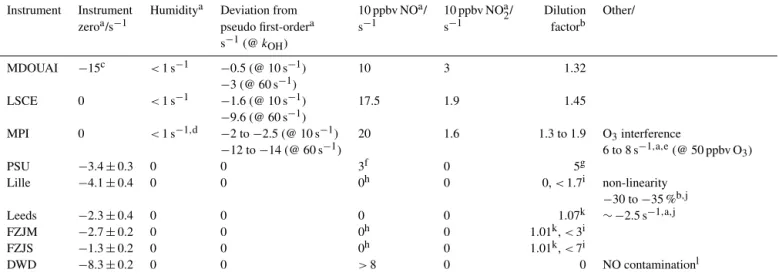
Table 4. Correction applied to the raw data. Some corrections are non-linear and depend on several parameters (such as the pyrrole and OH concentrations). Values are given for typical atmospheric conditions. The instrument zero for the MDOUAI CRM was due to a contamination in the inlet system that was only present in this campaign. Corrections due to deviations from a pseudo first-order reaction assumption
depend on the actual OH reactivity value and specific VOC (see text for details). Typical numbers are given for 10 and 60 s−1. Interferences
are present from NO, NO2and O3in some instruments. The correction often depends on the concentrations of the interfering species in a
non-linear way. Therefore, only typical values can be given here.
Instrument Instrument Humiditya Deviation from 10 ppbv NOa/ 10 ppbv NOa2/ Dilution Other/
zeroa/s−1 pseudo first-ordera s−1 s−1 factorb
s−1(@ kOH) MDOUAI −15c <1 s−1 −0.5 (@ 10 s−1) 10 3 1.32 −3 (@ 60 s−1) LSCE 0 <1 s−1 −1.6 (@ 10 s−1) 17.5 1.9 1.45 −9.6 (@ 60 s−1) MPI 0 <1 s−1,d −2 to −2.5 (@ 10 s−1) 20 1.6 1.3 to 1.9 O3interference −12 to −14 (@ 60 s−1) 6 to 8 s−1,a,e(@ 50 ppbv O3) PSU −3.4 ± 0.3 0 0 3f 0 5g Lille −4.1 ± 0.4 0 0 0h 0 0, < 1.7i non-linearity −30 to −35 %b,j Leeds −2.3 ± 0.4 0 0 0 0 1.07k ∼ −2.5 s−1,a,j FZJM −2.7 ± 0.2 0 0 0h 0 1.01k, < 3i FZJS −1.3 ± 0.2 0 0 0h 0 1.01k, < 7i DWD −8.3 ± 0.2 0 0 >8 0 0 NO contaminationl
aAbsolute change.bRelative change.cDetermined from periods of experiments without reactants, contamination in the inlet line only in this campaign.dUp to 4 s−1during fast humidity changes
in 2016.eAbsolute change due to recycling of OH by ozone.fCorrection of the decay (Shirley et al., 2006).gOnly applied in this campaign to reduce sampling flow rate from the chamber. hBi-exponential fit for NO > 20 ppbv – only applied on 7 October (Lille, FZJS, FZJM) and 15 October 2015 (FZJS, FZJM).iOnly applied for dilution for high reactivity (Lille: > 150 s−1,
FZJS/FZJM: variable dilution for > 60 s−1) on 5 October 2015.jDeviations from single-exponential OH decay, likely due to misaligned photolysis beam in this campaign.kCorrection for added flow with O3, when no O3was present in the experiment.lPresence of 0.14 ppbv NO contamination within the instrument corrected for kOH>2.5 s−1.
instruments and operating conditions are optimised to reduce the correction dependence on the chemical composition. The error associated to this correction can then be factored into the measurement uncertainty (Michoud et al., 2015).
Additional instrument-specific corrections are described in the following section.
3.1.1 MPI CRM instrument
The correction of measurements taken with the CRM by MPI for deviations from a pseudo first reaction uses results from numerical simulations. However, this can only be applied if the relative importance of the most abundant reactive com-pounds in the sampled air is known (Sinha et al., 2008). The model correction was not applicable in this comparison, be-cause no data on the concentration ratios of the main OH reactants were known in contrast to typical situations in field campaigns. In this campaign, the empirical correction proce-dure was also chosen as an alternative correction proceproce-dure that was shown to be advantageous by Michoud et al. (2015). Tests with isoprene, methanol, ethane, propane, propene and toluene were done to determine the correction factor.
In addition to the corrections applied by all groups operat-ing a CRM instrument, measurements by the MPI CRM were corrected for the presence of ambient ozone. The necessity of this correction was recognised after the first comparison of results from the 2015 campaign. This correction was not applied in the first version of submitted data. The procedure
to correct data was then determined in laboratory characteri-sation experiments. The correction was applied to data from the 2016 campaign, from the beginning.
OH is reformed in the reaction of HO2with O3in the re-action volume of the CRM, where O3is present in sampled ambient air but is also produced in the photolysis of oxygen by the 185 nm radiation of the Pen-Ray lamp. The assump-tion is that the effect of OH reformaassump-tion on the measurement is typically insensitive to the exact concentration of ambient ozone, which is not present in all modes of the measurement cycle. If this assumption is not true, the OH reactivity is un-derestimated depending on the ambient ozone concentration. This was observed for the MPI CRM instrument in this cam-paign. Therefore, measurements were corrected by an empir-ical function derived from laboratory measurements after the first data submission. Although the ozone concentration in the reaction volume was similar to the concentration in the other two CRM instruments, no ozone dependence was seen for the MDOUAI and LSCE instruments. The exact reason is not clear but might be related to different HO2 concentra-tions in the instruments. The insensitivity of other CRM in-struments to the ozone interference indicates that operating conditions exist for which the interference is negligible. Fur-ther investigations should be performed to characterise these conditions.
In addition to the ozone correction, errors in the calcula-tion of the dilucalcula-tion factor and the calibracalcula-tion of the pyrrole sensitivity were noticed for the MPI CRM instrument
af-ter the first data submission in 2015. Although corrections were made after knowledge of OH reactant concentrations and measurements of other instruments, unreasonable data already suggested the need for these corrections before. Also, the correction for the presence of NO2 was again charac-terised for conditions when also O3was present and slightly changed in the final data. Furthermore, the correction due to the deviations from pseudo first-order decay were changed in the final data because a reanalysis of the concentration of test compounds used for the characterisation revealed higher impurities than certified by the manufacturer.
The total increase in OH reactivity measurements between the first and final submission was typical within the range of a factor of 1.5 to 3 but was a factor of 4 to 5 for low OH reactivities around 10 s−1 in the presence of ozone mixing ratios of 40 ppbv.
3.1.2 MDOUAI CRM instrument
The performance of the MDOUAI CRM instrument was worse in this campaign than previously observed due to ad-ditional sources of noise from the PTR-MS instrument and the inlet system. It was recognised that the pump (Teflon sur-faces) in the sampling line upstream of the CRM instrument, which is necessary to avoid a pressure drop between ambi-ent pressure and the CRM reactor (Michoud et al., 2015), released contaminants which caused an additional OH reac-tivity of 15 s−1on average during measurements. This instru-ment zero was subtracted from all measureinstru-ments. The value was determined daily in each experiment between the humid-ification of chamber air and the injection of OH reactants. Deviations from pseudo first-order behaviour of the kinetics were characterised by tests with isoprene, propene, ethene, ethane and propane. Data were not revised after the first data submission.
3.1.3 LSCE CRM instrument
At the beginning of the campaign, a pressure change was ob-served for the two measurement modes of the CRM instru-ment at the exit of the reactor that could affect the measure-ments. The total flow rate in the sampling line was increased and only a small part was sampled into the reaction volume in order to avoid a change in pressure. Therefore, the sampling flow was not directly injected into the CRM reactor, but it was first pulled through a pump with Teflon surfaces. The flow was restricted by a valve (Teflon surfaces) before the air entered the reactor. This sampling flow system was used for the first time during this campaign and may have reduced the performance of the instrument.
Corrections were applied to the raw data as described by Michoud et al. (2015) to obtain the OH reactivity values. Specifically, the correction for the deviation from the pseudo first-order conditions was determined from laboratory and field tests using certified concentration of gas standards
con-taining propane and isoprene. The same procedure was ap-plied in a previous field campaign in an isoprene-dominated environment (Zannoni et al., 2016). Previous field deploy-ments of the same instrument were conducted in environ-ments with low NOx concentrations, for which a correction for OH recycling by NO was not needed. For this reason, a correction for high NOxconcentrations was determined in laboratory tests after the campaign in SAPHIR and data from the experiments from LSCE were revised after the first sub-mission for experiments, when NOxwas injected.
Instrument operators decided to use the part of the exper-iments before OH reactants were added to subtract a back-ground signal, when positive, non-zero values were on av-erage measured (5, 7, 9 and 16 October 2015) in their first data evaluation. However, this correction was not applied in the final data set, because it was agreed not to use knowledge of the chemical conditions for the data evaluation if it is not required.
Changes in the revised OH reactivity measurements were smaller than ±20 % except for measurements at high NO mixing ratios on 7 October 2015, when changes were up to 80 s−1as no correction for the NO interference was applied in the first submitted data.
3.2 Direct OH loss rate measurement by laser-photolysis – laser-induced fluorescence (LP–LIF)
All other instruments measured the decay of OH in the pres-ence of ambient OH reactants in a flow tube. In most of the instruments, OH radicals are detected by LIF (Heard and Pilling, 2003).
All methods measuring the OH decay have a higher time resolution compared to the CRM instruments (Table 1), be-cause no time is used up when switching between ambient and purified air. In general, fewer corrections are required to derive the OH reactivity from the measured OH decay.
Four LP–LIF instruments were used in the campaigns: in-struments from University of Lille and University of Leeds and two instruments from FZJ, one of which is permanently installed at the SAPHIR chamber (FZJS) and the other of which is used for mobile field deployment (FZJM).
In the laser-photolysis instruments, ambient air passes (flow rate 10 to 20 L min−1) through a flow tube. Part or all of the air is drawn into an OH fluorescence detection cell. The exact position and design of the flow tube and the fluores-cence cell differ among the instruments. OH is produced by flash photolysis of ozone with subsequent reaction of O(1D) with water vapour. Radiation is provided by a quadrupled Nd:YAG laser pulse at 266 nm, which is operated at a low repetition rate of 1 to 2 Hz. The OH concentration is mea-sured with a high frequency of 3 to 8.5 kHz, so that the decay of OH can be observed with a high time resolution between two photolysis shots. Tens of consecutive decays are summed up to increase the signal to noise ratio.
The OH radicals decay in a pseudo first-order reaction with ambient OH reactants, so that the time-resolved OH sig-nal can be fitted to a single-exponential function that directly gives the OH reactivity. Differences between the fitting pro-cedures of the instruments are described in the Supplement. The accuracy of the time basis of the OH decay is only de-termined by the accuracy of the photon-counting electronics. Measurements need to be corrected for an instrument zero that is subtracted from all measurements. This zero loss rate in the flow tube is due to the wall loss reactions and likely limited by the diffusion of OH. Values are typically of the order of a few s−1(Table 4) and are regularly determined by sampling high-purity zero air.
Conversion of HO2to OH in the presence of ambient NO can influence the measurements. As there is no concurrent production of HO2in the ozone photolysis, LP–LIF instru-ments are less affected by this recycling process compared to instruments that use water photolysis for OH production. It is expected that this recycling process only becomes rele-vant for NO mixing ratios higher than 20 ppbv for typical at-mospheric chemical compositions of ambient air (Lou et al., 2010). In this case, the single-exponential decay of OH turns into a bi-exponential decay that can clearly be identified in the summed decays. If a bi-exponential decay is observed, the faster decay time can be attributed to the OH reactiv-ity. The underlying assumption is that the timescale of OH formation is slow compared to the OH loss. This is reason-able for typical atmospheric conditions but may not be ap-plicable in all cases, specifically in artificial air mixtures. In field experiments, bi-exponential behaviour in the OH decay due to OH recycling at high NO concentrations in ambient air measurements has been observed by the FZJS and Lille instruments. A bi-exponential function was applied to mea-surements in a campaign in China for the FZJS instrument (Lou et al., 2010). Measurements of the Lille instrument that showed bi-exponential behaviour during a campaign on the campus of the University of Lille were evaluated by apply-ing a sapply-ingle-exponential function. Measurements were eval-uated by only using the first part of the decay curve that con-tained information on the faster decay (Hansen et al., 2015). No significant difference between this procedure and the re-sults from a bi-exponential fit was found. The fitting of the data using a single- or bi-exponentially decay function is dis-cussed later in the paper, as differences were observed in the returned value of the OH reactivity in this campaign at high NOx(> 20 ppbv) depending on the type of fit used.
In the normal operational procedure, no dilution or only a small amount needs to be taken into account for most of the instruments. If there is insufficient ambient ozone to generate a measurable OH signal, then an addition of O3-containing flow needs to be added to the flow tube and a small dilution correction needs to be made. This was required in experi-ments without the presence of ozone in the chamber air.
The number of data points on the decay curve that are above the noise level decreases with increasing OH reactiv-ity, so that the accuracy and precision of the measurements start to decrease for exceptionally high OH reactivity values (for example higher than 60 s−1for the FZJ LP–LIF instru-ment). In addition, initial inhomogeneities in the OH distri-bution in the flow tube due to inhomogeneities of the laser photolysis beam can impact the shape of the observed OH decay curve for these high reactivity values. For this reason, an additional dilution flow can be applied in order to reduce the OH reactant concentrations and improve the data qual-ity. This was done in some instruments (FZJ, Lille) in this campaign, when the measured reactivity exceeded a thresh-old (e.g. > 150 s−1 for the Lille instrument) but is not re-quired as indicated by measurements by the Leeds LP–LIF instrument.
Imperfect alignment of the photolysis laser can enhance the inhomogeneities in the initial OH distribution, so that de-viations from a single-exponential OH decay can also occur at low reactivity values. This was observed in this campaign in the Lille and Leeds LP–LIF instruments but recognised only at the end of (Lille) or after (Leeds) the campaign. As a consequence, the evaluation procedures were changed for measurements in this campaign in order to account for this effect.
Data from FZJS and FZJM instruments were not revised after the first data submission and no instrument-specific de-scription is required here. The Lille and Leeds instruments required a campaign-specific data evaluation that was applied before (Lille) or after (Leeds) the first data submission.
3.2.1 Lille LP–LIF instrument
Quick-look data presented from the LP–LIF instrument from Lille systematically deviated from measurements of the other instruments. The overestimation of approximately 30 % was confirmed by determining the reaction rate constant of the reaction between CO and OH in test experiments, in which a mixture of CO in synthetic air was sampled. This overestima-tion was due to two reasons: (1) misalignment of the photol-ysis laser leading to deviations from single-exponential be-haviour of the OH decay curve, likely due to an inhomoge-neous initial OH concentration (see above); (2) the procedure of analysing the decay by adapting the length of the decay curve used for the fit. The length is limited to 15 times the first estimate of the inverse reactivity (Hansen et al., 2015) in order to avoid noise from the background signal over longer periods of time. As a consequence, the fitted zero decay time appeared to change if the length of the curve used for the fit was shortened for zero-air measurements like done for the high reactivity values. This was then used to account for the deviations in the reactivity measurements by determining an artificial zero decay time as a function of the fit length. In the final data, this zero decay time, which depends on the fit length and therefore reactivity value, was subtracted
from the measurements (Fig. S1 in the Supplement). With this method, correct reactivity values could be calculated for the laboratory test experiments with CO. The drawback is that the accuracy is lower for high reactivity values due to the decreasing number of points used for the fit.
This correction would not be needed for a good alignment of the photolysis laser. It is therefore only needed for the data evaluation of this campaign but could be used to deal with similar alignment problems in the future.
3.2.2 Leeds LP–LIF instrument
Similar behaviour of the decay curves to that observed for the Lille LP–LIF instrument was recognised for the Leeds LP–LIF instrument after the campaign. In the decay, a fast component was followed by a slower component rather than single-exponential behaviour. This behaviour was also ap-parent during the zero decay measurements conducted with zero air for this campaign. As a consequence, the fit of the single-exponential function was started after the fast section of the decay curve for the data evaluation (fit range between 150 and 400 ms) for low reactivity values (kOH<10 s−1). An accurate determination of the OH reactivity was more diffi-cult for high reactivity values (kOH>10 s−1), when values became similar to the fast component of the decay. A single-exponential function between 100 and 200 ms was fitted to the measured decay curve in this case.
Similar to the procedure that was applied to the data from the Lille LP–LIF instrument, zero-air measurements were evaluated using the same fit ranges as for evaluating low and high reactivity values. A decay time of (2.3 ± 0.4) s−1 was obtained for the low reactivity case. This is close to the real loss rate of OH in the instrument without OH reactants (in-strument zero). A higher value of (4.8 ± 0.6) s−1was deter-mined if the fit range was shifted to an earlier start as it is for evaluating decays for high reactivity values. These two values were subtracted as instrument zeros when either one of the fit ranges were used. The higher value acts as a correc-tion for the overlap of the faster instrumental component and the OH decay due to chemical reactions. For decays taken on the 7 and 15 October 2015 when NO was present, a fit range between 105 and 150 ms was chosen, giving an instrument zero of (5.1 ± 1.1) s−1.
The difference between the revised data, when this evalu-ation scheme was applied, and the initially submitted data is mainly due to the higher instrument zero that was subtracted for kOH>10 s−1, so that these values are 2.5 s−1lower than before. Deviations of the OH decay from single-exponential behaviour for conditions without OH recycling in the instru-ment were not observed in other field campaigns in the past. This correction is specific for the data from this campaign.
3.3 Direct OH loss rate measurement by flow-tube technique with laser-induced fluorescence (PSU instrument)
The flow-tube LIF instrument from PSU also measures the decay of OH radicals. In contrast to LP–LIF instruments, OH is continuously produced by water photolysis at 185 nm in this instrument using a Pen-Ray lamp with concurrent HO2 production as in the CRM instruments.
In the PSU instrument, the reaction time is varied by a movable injector, which is used to change the distance be-tween OH injection and the point of OH detection (Ko-vacs and Brune, 2001; Mao et al., 2009). The reaction time is calculated from the velocity measured with a hot-wire anemometer and the known distance travelled for each po-sition of the injector. Within each scan, more than 100 data points were used to calculate the decay. Finally, during nor-mal operation in the field, the PSU instruments sample am-bient air with a high flow rate (> 100 L min−1). This exceeds the flow rate which can be consumed during operation of the SAPHIR chamber; therefore the PSU instrument had to ap-ply a high dilution flow in this campaign. Only 20 L min−1 were sampled from the chamber, to which 80 L min−1 of high-purity synthetic air provided by the SAPHIR air supply system was added. The dilution factor was determined from monitored flow rates and was verified in several tests during the campaign, in which the ratio of flows was varied. Using a dilution flow has two drawbacks. Firstly, the calculated OH reactivity is very sensitive to the exact ambient and dilution flows. Secondly, any error in the instrument zero decay due to wall loss or trace impurities in the dilution air is ampli-fied by the ratio of the dilution flow to the ambient flow, in this case a factor of 5. Thus the typical limit of detection of 0.5 s−1becomes 2.5 s−1.
As for the CRM instruments, measurements by the PSU instrument can be affected by OH recycling from the reaction of ambient NO with HO2, which is concurrently produced with OH by water photolysis. The correction of OH recycling in the PSU instrument is based on correcting each point in the decays for the recycling calculated from measured NO and HO2 before applying the fit to determine the OH reactivity (Shirley et al., 2006).
Changes made after the first data submission in the data by the PSU instrument were mostly smaller than ±10 %. These small changes were due to improvements in the data eval-uation algorithms that were made between the first and final submissions. These included improvements in the procedure, how data on measurements from instruments that were used for the corrections were synchronised to the OH reactivity measurements and refinement of instrument parameters such as air velocity and location of the injector.
In addition, the change in the correction procedure for OH regeneration due to the reaction of HO2with NO led to the fi-nal data being 2.5 times higher than the first data submission at the highest NO mixing ratios on 7 October 2015. Initially
a new optimisation fitting procedure was developed and used for the first data submission, but laboratory and modelling studies showed that the method in Shirley et al. (2006) was superior and less uncertain. Thus, the method in Shirley et al. (2006) was used for the revised final data submission.
These changes were specific for this campaign because the instrument was not exactly the same instrument as used in previous and future campaigns. It was assembled from parts of the original PSU instrument and parts (mainly the laser system for the OH detection) provided by the Max Planck Institute for Chemistry in Mainz and the University of Cali-fornia, Berkeley.
3.4 Direct OH loss rate measurement by flow-tube technique with chemical ionisation mass spectrometry (DWD instrument)
The measurement scheme of the CIMS instrument by DWD is similar to that of the flow-tube LIF instrument by PSU. However, only one reaction time is currently realised to mea-sure the OH decay (Berresheim et al., 2000; Muller et al., 2017). Excess OH (108cm−3) is produced by water photol-ysis in front of the flow tube with concurrent production of HO2. The reduction of its concentration by reacting with am-bient OH reactants is measured at two set time periods. This is achieved by terminating this reaction by chemical conver-sion of OH after a specific reaction time. For this purpose, a high concentration of sulfur dioxide is added at two injec-tion points, so that OH is converted to sulfuric acid. After the OH titration, a high concentration of propane is injected to scavenge any OH present. The injection of sulfur dioxide is alternately switched between these two points. The reaction time is determined by adding known amounts of OH reactiv-ity (e.g. propane) in front of the flow tube. OH wall losses from the flow tube are quantified by using humidified syn-thetic air. If the OH lifetime in the instrument is of the order of the travel time between the two injection points, no rea-sonable measurement is possible. In the current set-up, an upper limit of OH reactivity values of 40 s−1is achieved.
Additionally, measurements by the CIMS instrument can also be affected by OH recycling from the reaction of ambi-ent NO with HO2that is concurrently produced with OH by water photolysis. Corrections for OH recycling in the CIMS are based on laboratory characterisation at the Hohenpeis-senberg station (ambient pressure ∼ 900 hPa). An empirical function corrects for the systematic underestimation seen in CIMS OH reactivity measurements, which is dependent on both the magnitude of OH reactivity and the levels of NO present. The function has been derived for propane, isoprene and ethene for NO concentrations up to 15 ppbv (Muller et al., 2017). Under the assumption that any complex mix-ture in the SAPHIR chamber behaves like the three OH re-actant mixture above, the NO correction was applied to the SAPHIR campaign data set for kOH larger than 2.5 s−1. The fit function optimised for OH reactivity up to 40 s−1and NO
ranging from 0 to 15 ppbv leads to a systematic overesti-mation of OH reactivities below 2.5 s−1(Fig. S3), not rep-resenting laboratory observations. Therefore no correction is applied to kOH<2.5 s−1. The OH recycling efficiency is partly dependent on the reaction time between the two in-jection zones. As the NO correction was determined at the laboratory at Hohenpeissenberg Observatory at a pressure of 900 hPa, an uncertainty of +10 % exists for its applica-tion at the SAPHIR chamber, as a result of lower flow rates (i.e. longer reaction time in CIMS) at 1000 hPa.
In addition to ambient NO, the CIMS measurements were influenced by an NO impurity in the SO2cylinder, leading to the presence of 0.14 ppbv NO in the CIMS flow tube at all times in this campaign. The presence of the NO impu-rity became evident from the inspection of the CO exper-iments (7 and 15 April 2016) where a systematic, repeat-able underestimation in OH reactivity was found for reactiv-ities above 20 s−1. Therefore, an NO correction function was applied to the whole data set, also for experiments without NO in the chamber, e.g. in experiments with monoterpenes (13 April 2016) and sesquiterpenes (15 April 2016).
The DWD CIMS instrument is a relatively new instrument that had only been used in a remote environment at the mon-itoring station at Hohenpeißenberg. Therefore, the correction procedure had been developed for chemical conditions expe-rienced in this campaign and were further refined after the first data submission. They would also be required if the in-strument took measurements in similar environments.
The wall loss of OH in the instrument and the time in which the air travelled between the two titration points were initially determined from zero-air phases of the experiments on each day. In order to provide data which are fully indepen-dent from the experiments, measurements were revised after data from the other instruments were known. The parameters were determined by an external flow tube with propane and synthetic air concentrations only once before the start of the campaign. This resulted not only in a constant change in the data due to the change in the zero decay time (wall loss) but also a scaling of data due to the change in the calculated re-action time (Table S1 in the Supplement). Final data are on average 10 % lower than initially submitted.
4 Results and discussion
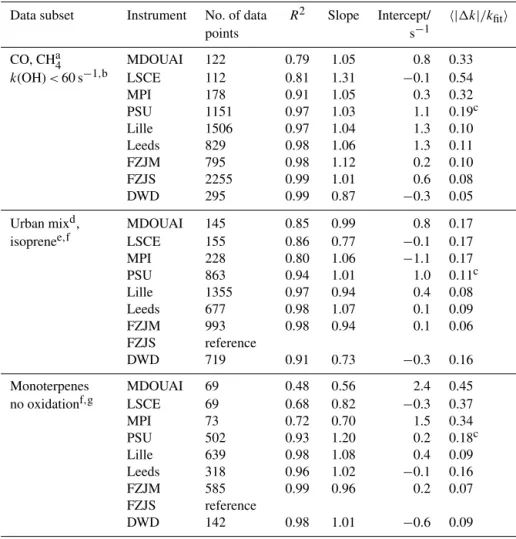
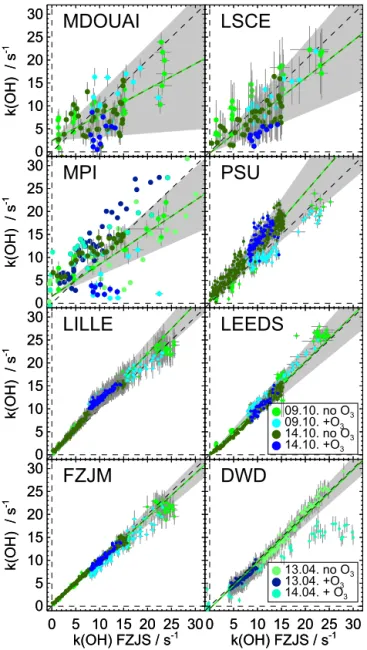
A summary of OH reactivity measurements of all instru-ments together with calculated OH reactivity is shown in Figs. 1 to 4 and the results are discussed in detail in the fol-lowing subsections. For comparing data, the calculated reac-tivity is taken as the reference value if no oxidation products were formed during the experiment. In all other cases, one of the LP–LIF instruments (FZJS) is taken as reference. This in-strument was chosen because its measurements have a high precision and time resolution. Regression lines were deter-mined using the fitexy procedure by Press et al. (1992). This
09:00 12:00 15:00 18:00 0 50 100 150 200 250 k(OH) / s -1 09:00 12:00 15:00 18:00 0 50 100 150 200 250 k(OH) / s -1 CO CO CO CO CO CO CO CO 05.10. LEEDS LILLE PSU FZJM FZJS LSCE MDOUAI MPI CO/CH4 VOC NOX CO/CH4 VOC NOX 08:00 10:00 12:00 14:00 16:00 0 10 20 30 40 50 k(OH) / s -1 08:00 10:00 12:00 14:00 16:00 0 10 20 30 40 50 k(OH) / s -1
CO, CH4 CO, CH4 CO, CH4 CO, CH4NO2
06.10. 09:00 12:00 15:00 0 20 40 60 80 k(OH) / s -1 09:00 12:00 15:00 0 20 40 60 80 k(OH) / s -1 CO, CH4 NO NO NO CO CHNO4 NO NO 07.10. 08:00 10:00 12:00 14:00 16:00 0 10 20 30 40 k(OH) / s -1 08:00 10:00 12:00 14:00 16:00 0 10 20 30 40 k(OH) / s -1 Monoterp.
Monoterp.Monoterp.Monoterp.Monoterp.O3
09.10. 09:00 12:00 15:00 0 10 20 30 40 50 k(OH) / s -1 09:00 12:00 15:00 0 10 20 30 40 50 k(OH) / s -1
CO CO Isop Isop Isop
11.10.
Figure 1. Measured (dots) and calculated (coloured areas) OH re-activity during experiments in the SAPHIR chamber 2015. Error bars are omitted for the clarity of the plot but are within the range of the scatter of data. Vertical dashed lines with labels give points in time of the injection of trace gases. Vertical dashed blue lines
indicate addition of water, horizontal blue lines the presence of O3
and horizontal dashed yellow lines illumination of the chamber by sunlight.
method takes into account the measurement errors of both instruments and is symmetric, i.e. the fitted parameters are independent of whichever of the two instruments is assigned to be the dependent or independent variable.
4.1 OH reactivity measurements with zero air
Ultra-pure air was present in the chamber at the beginning of each experiment. As discussed above, it can be assumed that there was no OH reactivity present in this case. For normal operation of the LIF instruments, ozone and water vapour need to be present. A small contamination from OH
reac-09:00 12:00 15:00 0 10 20 30 40 50 k(OH) / s -1 09:00 12:00 15:00 0 10 20 30 40 50 k(OH) / s -1 Urban NO2 NO2 NO2 NO2 Urban NO2 12.10. 09:00 12:00 15:00 0 10 20 30 40 50 k(OH) / s -1 09:00 12:00 15:00 0 10 20 30 40 50 k(OH) / s -1 CO, NO2
UrbanNO2 Urban Urban Urban
13.10. 06:00 09:00 12:00 15:00 -5 0 5 10 15 20 k(OH) / s -1 06:00 09:00 12:00 15:00 -5 0 5 10 15 20 k(OH) / s -1 Start plant Stop plant O3 14.10. 09:00 12:00 15:00 0 20 40 60 80 100 120 k(OH) / s -1 09:00 12:00 15:00 0 20 40 60 80 100 120 k(OH) / s -1 CO CO CO TME TME NO NO NO 15.10. 08:00 10:00 12:00 14:00 16:00 0 10 20 30 40 k(OH) / s -1 08:00 10:00 12:00 14:00 16:00 0 10 20 30 40 k(OH) / s -1 CH3CHO
MVK+MACRSesquiSesquiSesqui O3
16.10.
Figure 2. Same as Fig. 1. For the experiment on 16 October 2015 the subsequent addition of various VOC reactants is shown, so that differences among measurements that only occur for a specific VOC reactant impact the visual agreement at later times, when other VOC reactants were injected.
tants could appear during the humidification process of the chamber air. Measurements from previous experiments in the chamber indicate that OH reactivity introduced together with water is most often below the limit of detection of the re-activity instrument (approximately 0.2 s−1, e.g. Fuchs et al., 2013) but always less than 1 s−1. This is likely due to either contaminants in the water or contaminants coming off the Teflon film of the chamber with increasing humidity. There-fore, these periods are ideal for testing the instrument zeros and the precision of the measurements.
If an instrument zero needed to be taken into account, it was independently determined from the zero-air phase of the experiments for all instruments except for the MDOUAI