HAL Id: tel-02445537
https://tel.archives-ouvertes.fr/tel-02445537
Submitted on 14 Sep 2020
HAL is a multi-disciplinary open access
archive for the deposit and dissemination of sci-entific research documents, whether they are pub-lished or not. The documents may come from teaching and research institutions in France or abroad, or from public or private research centers.
L’archive ouverte pluridisciplinaire HAL, est destinée au dépôt et à la diffusion de documents scientifiques de niveau recherche, publiés ou non, émanant des établissements d’enseignement et de recherche français ou étrangers, des laboratoires publics ou privés.
Diagnostic and therapeutic odyssey : essays in health
economics
Setti Raïs Ali
To cite this version:
Setti Raïs Ali. Diagnostic and therapeutic odyssey : essays in health economics. Economics and Finance. Université Panthéon-Sorbonne - Paris I, 2019. English. �NNT : 2019PA01E019�. �tel-02445537�
UNIVERSIT´E PARIS 1 PANTH´EON SORBONNE PARIS SCHOOL OF ECONOMICS
T H `E S E
pour l’obtention du titre de Docteur en Sciences ´Economiques
Pr´esent´ee et soutenue publiquement le 3 juillet 2019 par
Setti RA¨IS ALI
DIAGNOSTIC AND THERAPEUTIC ODYSSEY:
ESSAYS IN HEALTH ECONOMICS
Pr´epar´ee sous la direction de Lise Rochaix et Sandy Tubeuf
Composition du jury :
Philippe Aghion Professeur, Coll`ege de France Pr´esident
Margaret Kyle Professeur, MINES ParisTech Rapporteur
Frank Lichtenberg Professeur, Columbia University Rapporteur
Pierre-Yves Geoffard Professeur, Ecole d’Economie de Paris Suffragant J´erˆome Wittwer Professeur, Universit´e de Bordeaux Suffragant Lise Rochaix Professeur, Universit´e Paris 1-Panth´eon Sorbonne Directrice Sandy Tubeuf Professeur, Universit´e Catholique de Louvain Co-directrice
L’Universit´e Paris 1 Panth´eon Sorbonne n’entend donner aucune approbation, ni impro-bation aux opinions ´emises dans cette th`ese ; elles doivent ˆetre consid´er´ees comme propres `
Remerciements
Voici le moment tant attendu pour moi de manifester toute ma reconnaissance `a ceux qui ont fait de mon odyss´ee de doctorante une exp´erience formidable et enrichissante.
D’abord, tous mes remerciements et mon affection vont `a mes deux directrices de th`ese qui m’ont accompagn´ee dans mon p´eriple.
Lise, je me souviens tr`es bien de notre rencontre dans ton bureau de la Maison des Sciences ´Economiques en 2014 o`u tu m’as offert la bienveillance et l’attention qui te caract´erisent et qui ne m’ont jamais quitt´ees depuis. Tu m’as ouvert les portes d’Hospinnomics, et tant d’autres par la suite, multipliant les opportunit´es acad´emiques et faisant de la th`ese une perp´etuelle ´emulation. Tu donnes confiance et courage, et ta joie est contagieuse.
Sandy, mille fois merci pour ton soutien, de la richesse de nos ´echanges, `a la cohabitation `
a Leeds et ton accueil des plus chaleureux. Tu m’as soutenue, accompagn´ee, de la mˆeme fa¸con que tu n’h´esites jamais `a tendre la main aux autres et les combler de soutien d`es que l’occasion se pr´esente.
La th`ese a ´et´e tout du long semblable `a ma d´ecouverte du ski : une piste rouge au premier jour (¸ca, c’est votre exigence) d´eval´ee dans un grand sentiment de s´ecurit´e. J’ai eu une chance inou¨ıe d’ˆetre encadr´ee par ces deux femmes talentueuses et que j’admire.
Je remercie les membres de mon jury qui me font l’honneur de leur pr´esence. `A Margaret Kyle et `a Frank Lichtenberg dont l’esprit critique et l’exigence m’ont donn´e du fil `a retordre, mais ´egalement la motivation et l’engouement n´ecessaire pour am´eliorer la qualit´e de mon travail. Merci aussi `a Frank Lichtenberg de m’avoir donn´e l’opportunit´e d’effectuer un s´ejour de recherche `a Columbia ainsi que de m’avoir r´eserv´e le meilleur accueil. Merci `a Philippe Aghion et `a Pierre-Yves Geoffard d’avoir accept´e de prendre part `a mon jury, j’en suis honor´ee et tr`es reconnaissante. A J´` erˆome Wittwer, d’avoir accept´e de faire parti de mon comit´e de th`ese et de m’avoir permis d’enrichir mon travail tout au long de la th`ese: vos conseils m’ont ´et´e utiles et pr´ecieux, tout autant que vos encouragements et votre bienveillance.
Un grand merci `a la Fondation Imagine de m’avoir donn´e l’opportunit´e d’effectuer cette th`ese en m’offrant un financement de th`ese sur toute sa dur´ee. Je vous suis infiniement reconnaissante pour la confiance t´emoign´ee, et la grande latitude laiss´ee dans le choix des questions de recherche de ce travail. Merci particuli`erement `a Laure Boquet, Alain Fischer, Guillaume Huart, Stanislas Lyonnet, et Emilie Resweber-Gouin.
Je saisis l’occasion ´egalement de remercier celles et ceux qui m’ont accompagn´ee dans mes premiers pas dans le monde de la recherche. `A Jean Beuve, pour m’avoir offert, d`es la licence, ma premi`ere immersion dans le monde de la recherche. A Paul Dourgnon,` pour m’avoir initi´ee `a la r´edaction scientifique. `A Nicolas Sirven, pour ma d´ecouverte m´emorable (terrible) de la fonction de discutant. `A Marl`ene pour la premi`ere soutenance de th`ese `a laquelle je n’ai jamais assist´ee ! Merci `a tous ceux qui m’ont fait b´en´eficier de leur aide et leur expertise, et qui m’ont aussi beaucoup inspir´ee. `A l’´equipe d’Orphanet, Cl´emence Th´ebaut, Christine LeClainche et Philippe Gorry, pour leur disponibilit´e et leurs conseils avis´es. `A Izabela, pour nos conversations passionnantes et son intarissable bienveillance. `A V´eronique, pour ces souvenirs m´emorables autour des mol´ecules dont on ne doit pas prononcer le nom.
Merci `a tous les membres qui ont fait ou font encore l’effervescence d’Hospinnomics. `
A Estelle, ou devrais-je dire Marie-France, pour son ´energie et son all´egresse ! A` Camille, notre extravertie de service, dealeuse de bonnes ondes ! `A Reka, si p´etillante et g´en´ereuse. A Lor`` ene, pour nos d´ejeuners de derni`ere ann´ee de th`ese, o`u insipide parfois, j’avais l’anxi´et´e communicative avant que tu me menaces (tendrement) avec tes gants de boxe ! A Audrey, pour nous avoir fait d´` ecouvrir Bordeaux (surtout du cˆot´e du lac). A Jean-Claude, pour tout son soutien au quotidien, sa disponiblit´` e, et pour avoir fait naˆıtre en nous l’envie de longues randonn´ees `a v´elo ! A Christine Meyer,` pour son temps, son dynamisme, et ses relectures. `A Aleks, pour nos casse-tˆetes sur les formes fonctionnelles, la pr´eparation hilarante de ton test de fran¸cais et tes bons mots, en toutes circonstances. A Rolando, dont on me dit dans l’oreillette qu’il s’est mis `` a la sophrologie depuis le policy brief sur les interventions non-m´edicamenteuses. Aux mardis de Quitterie ! `A Marco, notre m´edecin `a nous qui, en d´epit de sa quadruple vie professionnelle, trouve les ressources pour nous soigner de sa bonne humeur. `A Laurie et L´ea, l’`ere du m´edicament d’Hospi, qui m’ont fait grˆace de leur relecture, mais aussi et surtout de moments merveilleux de d´ecouverte de la Sicile. `A No´emie, pour son esprit et son amiti´e : je dois te dire que je ne me suis toujours pas remise de ton d´epart de l’´equipe.
Merci `a ceux qui m’ont soutenue tout le long de ce chemin, dans les moments de r´eussite, comme dans les moments de doute. `A Marie, l`a en toutes circonstances, et qui m’a tellement encourag´ee. A L´` eo qui de l’autre cˆot´e de la Manche s’est assur´e de la bonne conduite de cette th`ese, et qui rentrant `a Paris, a toujours su remplir ma jauge d’enthousiasme et de d´etermination. `A Lise, `a Bertrand, `a Zhuxin et tous ceux avec qui j’ai hˆate de c´el´ebrer cette belle aventure.
`
A Antoine, avec qui j’ai partag´e absolument toutes les p´erip´eties de nos th`eses respectives depuis Novembre 2015, et avec qui j’ai nou´e une amiti´e rare : tu as toute ma gratitude.
Enfin, merci `a mes parents et mes deux fr`eres, qui sont d’un soutien entier et d’une confiance in´ebranlable. Merci `a mes deux fr`eres pour leur aide capitale (et norturne) de la derni`ere ligne droite. Merci `a mes parents d’avoir fait de moi une femme autonome et ind´ependante. Merci de m’avoir transmis ma curiosit´e et ma pers´ev´erance.
Table of Contents
List of Figures. . . 14
List of Tables . . . 18
Glossary . . . 21
General Introduction 23 Pr´esentation de la th`ese en fran¸cais 39
I
THE DIAGNOSTIC QUEST AND ITS PREJUDICE TO
PATIENTS AND CAREGIVERS
53
1 Social Determinants of Time to Diagnosis 55 1 Introduction . . . 562 Literature Review . . . 58
3 Data and Methods . . . 62
4 Results . . . 67
5 Discussion and Conclusion . . . 72
6 Appendix . . . 74
2 Children’s health shock externalities on mothers’ health 81 1 Introduction . . . 82
2 Background Literature . . . 84
3 Data and Descriptive Statistics . . . 86
4 Empirical Strategy . . . 89
5 Results . . . 92
6 Discussion and Conclusion . . . 96
TABLE OF CONTENTS
II
FIRMS’ DECISIONS TO ALLOCATE R&D TO RARE
DISEASES
115
Introductory Section 117
3 European Initiatives to Foster R&D on Rare Diseases 123
1 Introduction . . . 124
2 Context . . . 125
3 Data and Empirical Strategy. . . 129
4 Results . . . 133
5 Discussion . . . 137
6 Appendix . . . 142
4 Allocation of R&D resources for Rare Diseases 151 1 Introduction . . . 152
2 A Conceptual Framework . . . 155
3 Data . . . 158
4 Methods . . . 162
5 Results . . . 164
6 Discussion and Conclusion . . . 169
7 Appendix . . . 172
III
REGULATORS’ CHALLENGES IN DEFINING THE
CONDITIONS OF ACCESS TO INNOVATIVE DRUGS
199
5 Orphan Drugs and Longevity in the US, Revisited (1999-2015) 201 1 Introduction . . . 2022 Data and Empirical Strategy. . . 204
3 Results . . . 207
4 Discussion and Conclusion . . . 212
5 Appendix . . . 215
6 Cost-effectiveness threshold for health care technologies 239 1 Introduction . . . 240
2 L’utilisation du seuil d’acceptabilit´e des technologies de sant´e. . . 243
3 Le paradigme efficience-´equit´e . . . 246
4 Conclusion . . . 250
General conclusion 253
Appendix 265
List of Figures
0.1 Number of Approved Orphan Indications per year in the US 32
0.2 Orphan Drug Expenditure and Share of Orphan Drug
Ex-penditure in Total Sales . . . 32 0.3 Association between Annual Belgian Cost per Patient of an
Orphan Drug and Disease Prevalence . . . 33
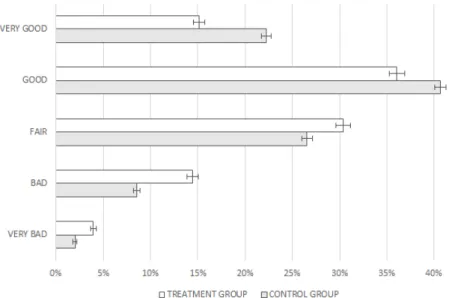
I.2.1 Differences in Mothers’ Health Status — Treatment vs.
Control . . . 101 I.2.2 Differences in Mothers’ Health Status — Before and After
Treatment . . . 101 I.2.3 Differences in Children’s Health Status — Treatment vs.
Control . . . 102 I.2.4 Differences in Children’s Health Status — Before and
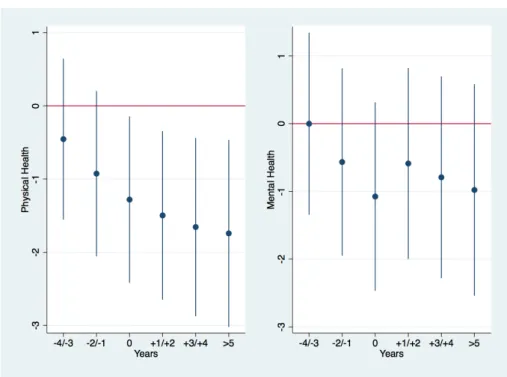
Af-ter Treatment . . . 102 I.2.5 Evolution of Physical and Mental Health over Time . . . 105 I.2.6 Distribution of Physical Health by Groups and within the
Treatment Group . . . 106
I.2.7 Distribution of the PS Before and After the Matching
among Groups . . . 107 I.2.8 Distribution of the PS among Groups . . . 108
I.2.9 Distribution of Mental Health by Group and within the
Treatment Group . . . 109 II.0.1 PubMed’s Search Window . . . 118
II.0.2 MedGen’s Result Window for “Alexander Disease,”
Or-phanet Code “58” . . . 119
II.0.3 MedGen’s Result Window for “Alexander Disease,”
Or-phanet Code “58” . . . 120
II.0.4 Excel Output Containing the MedGen UID for “Alexander
II.0.5 Excel Output Containing the Citation Content for
“Alexan-der Disease,” MedGen UID 78724 . . . 121
II.0.6 Excel Output Containing the Citation Content for “Alexan-der disease,” MedGen UID 78724 . . . 121
II.0.7 Database Extraction for “Alexander Disease,” MedGen UID 78724 . . . 122
II.3.1 Overview of medicinal product development, Source: Euro-pean Medicines Agency . . . 126
II.3.2 Number of Clinical Trials per Year, 1997-2015 . . . 142
II.3.3 Number of Academic Publications per year, 1997-2015 . . . 142
II.3.4 Number of Diseases Targeted by Clinical Trial Activities, 1997-2015 . . . 143
II.4.1 Frequency Distribution of Rare Disease Prevalence . . . 172
II.4.2 Missing Value Patterns . . . 173
II.4.3 Cumulative Distribution of Research Projects of Ultra-rare versus Non Ultra-Ultra-rare Diseases . . . 174
II.4.4 Mean R&D Levels Differentiated across Circumstances . . . 175
III.5.1 Adjusted-Mortality Rates (Rare Diseases vs Other Diseases)215 III.5.2 Adjusted-Mortality Rates (Rare Diseases vs Other Dis-eases) - Trends . . . 215
III.5.3 Adjusted-Mortality Rates with and without Orphan Drug (Rare Diseases) - Trends . . . 216
III.5.4 Time Variation — YPLL65 . . . 221
III.5.5 Time Variation — YPLL70 . . . 222
III.5.6 Time Variation — YPLL75 . . . 223
III.5.7 Time Variation — YPLL80 . . . 224
III.5.8 Time Variation — YPLL85 . . . 225
III.5.9 Time Variation — ln(YPLL65) . . . 233
III.5.10 Time Variation — ln(YPLL85) . . . 234
List of Tables
I.1.1 Patients’ socio-demographic characteristics . . . 74 I.1.2 time to diagnostic workup by disease (in months) . . . 74 I.1.3 Estimated coefficients and 95% confidence intervals for
co-variates’ incidence on time to diagnostic workup using Cox model stratified by Age Class. . . 75 I.1.4 Robustness checks: Model (4) coefficients for model (3)
without 3% top values and Model (5) displays coefficients for Model (3) restricting for patients diagnosed within the 2 previous years . . . 76 I.1.5 Sub-sample analysis (1): Estimated coefficients and 95%
con-fidence intervals for covariates’ incidence on time to diag-nostic workup using Cox model stratified by Age Class. . . . 77 I.1.6 Sub-sample analysis (2): Estimated coefficients and 95%
con-fidence intervals for covariates’ incidence on time to diag-nostic workup using Cox model stratified by Age Class. . . . 78 I.1.7 Sub-sample analysis (3): Estimated coefficients and 95%
con-fidence intervals for covariates’ incidence on time to diag-nostic workup using Cox model stratified by Age Class. . . . 79 I.2.1 Summary Statistics by Group . . . 99 I.2.2 Impact of Child’s Health Shock on Mother’s Self-Reported
General Health . . . 103 I.2.3 Impact of Child’s Health Shock on Mother’s Physical and
Mental Health . . . 103 I.2.4 Heterogeneity in the Impact of a Child’s Health Shock on
the Mother’s Self-Reported General Health Status . . . 104 I.2.5 Robustness Checks of the Baseline Results . . . 104 I.2.6 Impact of a Child’s Health Shock on the Mother’s General
I.2.7 Impact of the Child’s Health Shock on the Mother’s Physi-cal and Mental Health . . . 112 I.2.8 Heterogeneity in the Impact of a Child’s Health Shock on
the Mother’s Self-Reported General Health Status . . . 113 II.3.1 Distribution of Clinical Counts, by Sub-group . . . 144 II.3.2 Distribution of Academic Publication Counts, by Sub-group 144 II.3.3 Model (1) displays coefficients for a Conditional Fixed
Ef-fect Poisson Model for the Full Treatment Group and Model (2) Displays Coefficients for a Conditional Fixed Ef-fect Poisson Model for Treatment Group = Rare Diseases, Only . . . 145 II.3.4 Average DiD Effect for Poisson Models . . . 145 II.3.5 Model (1) Displays Coefficients for a Fixed Effect Logit
Model for the Full Treatment Group and Model (2) Dis-plays Coefficients for a Conditional Fixed Effect Fixed Ef-fect Logit Model for Treatment Group = Rare Diseases, Only . . . 145 II.3.6 Average DiD effect for Logit Models. . . 146 II.3.7 Model (3) Displays Coefficients for a Conditional Fixed
Ef-fect Poisson Model with Time Varying EfEf-fects of Policy Adoption . . . 146 II.3.8 Model (1) Displays Coefficients for a Fixed Effect
Pois-son Model for the Full Treatment Group and Model (2) Displays Coefficients for a Conditional Fixed Effect Fixed Effect Logit Model for Treatment Group = Rare Diseases, Only . . . 147 II.3.9 Average DiD Effect for the Poisson Models . . . 147 II.3.10 Model (3) Displays Coefficients for a Conditional Fixed
Ef-fect Poisson Model with Time Varying EfEf-fects of Policy Adoption . . . 148 II.3.11 Displays Coefficients for a Conditional Fixed Effect
Pois-son Model for Years Before and After the Policy Adoption. Outcome = Clinical Trials . . . 148 II.3.12 Displays Coefficients for a Conditional Fixed Effect
Pois-son Model for Years Before and After the Policy Adoption. Outcome = Academic Publications . . . 149 II.3.13 Average DiD effect on Sub-samples . . . 149
II.4.1 Descriptive Statistics of R&D Variables. . . 176 II.4.2 Linear Correlation Coefficient between all R&D Outcome
Variables . . . 176 II.4.3 Distribution of the Mean Age at Symptom Appearance for
Rare Diseases . . . 177 II.4.4 Distribution of the Mean Age at Death for Rare Diseases . 177 II.4.5 Distribution of the Prevalence for Rare Diseases . . . 177 II.4.6 Mean Difference in R&D Proxies between Missing Values
and Non-missing Values for Disease Characteristics . . . 178 II.4.7 First-Order Stochastic Dominance Using Mean Age at
Symp-tom Onset (Reported p Values) . . . 179 II.4.8 First-Order Stochastic Dominance with Mean Age at Death
(Reported p Values) . . . 181
II.4.9 First-Order Stochastic Dominance Using Prevalence in
Class (Reported p Values) . . . 186 II.4.10 First-Order Stochastic Dominance Tests with Immediate
Danger of Death (Reported p Values) . . . 188 II.4.11 First-Order Stochastic Dominance Tests with a High Level
of Uncertainty on Disease Evolution (Reported p Values) . . 189 II.4.12 First-Order Stochastic Dominance Tests Using Mean Age
at Symptom Onset, Observations Weighted by Prevalence (Reported p Values) . . . 190 II.4.13 First-Order Stochastic Dominance Tests with Mean Age at
Death, Observations Weighted by Prevalence (Reported p Values) . . . 192 II.4.14 First-Order Stochastic Dominance Tests with Immediate
Danger of Death, Observations Weighted by Prevalence (Reported p Values) . . . 197 II.4.15 First-Order Stochastic Dominance Tests with a High
Level of Uncertainty on Disease Evolution, Observations Weighted by Prevalence (Reported p Values) . . . 198 III.5.1 Descriptive Statistics . . . 216 III.5.2 Yearly Number of Approved Drugs . . . 217 III.5.3 Impact of Pharmaceutical Innovation on Years of Potential
Life Lost . . . 217 III.5.4 Impact of Pharmaceutical Innovation on Years of Potential
III.5.5 Time Variation — Impact of Pharmaceutical Innovation on Years of Potential Life Lost . . . 219 III.5.6 Impact of Academic Innovation on Years of Potential Life
Lost . . . 220 III.5.7 Impact of Academic Publications on Years of Potential Life
Lost . . . 220 III.5.8 Robustness Check — Impact of Pharmaceutical Innovation
on Years of Potential Life Lost, Only Including Rare Dis-eases Identifying ICD-10 Codes . . . 226 III.5.9 Robustness Check — Impact of Pharmaceutical Innovation
on Years of Potential Life Lost, Only Including Diseases with Annual Average Number of Deaths below 4,800 . . . 227 III.5.10 Robustness Check — Impact of Pharmaceutical Innovation
on Years of Potential Life Lost, Only Including Diseases with Annual Average Number of Deaths below 6,400 . . . 228 III.5.11 Impact of Pharmaceutical Innovation on Years of Potential
Life Lost — Sub-sample Analysis . . . 229 III.5.12 Impact of Pharmaceutical Innovation on ln(Years of
Poten-tial Life Lost) . . . 230 III.5.13 Impact of Pharmaceutical Innovation on ln(Years of
Poten-tial Life Lost) . . . 231 III.5.14 Impact on Academic Publications on ln(Years of Potential
Life Lost) . . . 231 III.5.15 Impact of Academic Publications on ln(Years of Potential
Life Lost) . . . 232 III.5.16 List of Drug Launches per Year with ICD-10 . . . 235
Glossary
A&E Accident and Emergency.
AATD Alpha-1 Antitrypsin Deficiency Disorder. ASMR Am´elioration du Service M´edical Rendu.
ATIH Technical Agency for Information on Hospitalization.
BURQOL-RD Social Economic Burden and Health-Related Quality of Life in Patients with Rare Diseases in Europe.
CBR Child Benefit Records.
CDF Cumulative Distribution Functions. CE Conformit´e Europ´eenne.
DALY Disability-Adjusted Life Year.
DELTA D´epartement et Laboratoire d’Economie Th´eorique Appliqu´ee. DiD Difference-in-Differences.
EC European Commission.
EHIS European Health Interview Survey.
EHIS Institute for Research and Information in Health Economics. EMA European Medicines Agency.
EORTC QLQ-C30 European Organization for Research and Treatment of Cancer Quality of Life Questionnaire Core 30.
EU European Union.
FDA Food and Drug Administration. GP General Practitioner.
GUS Growing Up in Scotland. HR Hazard Ratio.
HTA Health Technology Assessment.
IBD Inflammatory Bowel Disease.
ICD International Classification of Diseases. ICER Incremental Cost-Effectiveness Ratio.
INSEE National Institute of Statistics and Economic Studies.
INSERM French National Institute for Health and Medical Research. IPO Initial Public Offering.
KS Kolmogorov-Smirnov. MA Market Authorization.
MeSH Medical Subject Headings. MRI Magnetic Resonance Imaging. NHS National Health Service.
NICE National Institute for Health and Care Excellence. NIH National Institute of Health.
OD Orphan Drug. ODA Orphan Drug Act.
OECD Office of Economic Cooperation and Development. PROMs Patient Reported Outcome Measures.
PS Propensity Score.
QALY Quality Adjusted Life Years. R&D Research and Development. RA Reference Ages.
RCT Randomized Control Trials.
ScotGen Scottish Center for Social Research. SEED Scottish Executive Education Department. SF-12 12-Item Short Form Health Survey.
UK United Kingdom.
US United States of America. WHO World Health Organization.
General Introduction
Most of us cluster somewhere in the middle of most statistical distributions. But there are lots of bell curves, and pretty much everyone is on a tail of at least one of them. We may collect strange memorabilia or read esoteric books, hold unusual religious beliefs or wear odd-sized shoes, suffer rare diseases or enjoy obscure movies.
Virginia Postrel
Rare diseases are a stimulating subject of study for economists because the challenges commonly raised are pushed to the extreme when the disease is rare: from the diagnosis to the drug development, and its conditions of accessibility. This strong statement prompted the use of the term ”odyssey” in the thesis title, as an appreciation of the distinctive nature of rare diseases.
The thesis is structured around three different key actors, all relevant to the diagnostic and therapeutic ”odyssey” of rare diseases. Part I of the thesis is devoted to patients and their networks and considers sources of delays in receiving a diagnosis from the demand side, as well as the spillover effects from patients’ health to their direct support systems.
Pharmaceutical firms are the second key actor of the diagnostic and therapeutic ”odyssey” considered in the thesis. Part II examines how firms’ decisions to allocate Research and Development (R&D) investments to rare diseases are impacted by innovation policies in rare disease areas. Finally, policy makers are the focus of Part III, which addresses the issues of measuring pharmaceutical innovation benefits along with costs in rare diseases areas, while taking into account the opportunity cost of health care decisions.
In this general introduction, I wish to fulfill two main objectives: the first is to highlight the very specific position of rare diseases regarding access to diagnostic and therapeutic
treatment, justifying the use of the term ”odyssey.” The second is to suggest that adopting a global perspective and comprehensive vision of rare diseases is critical despite the specific nature of each individual disease.
Measuring time period to diagnosis
Scheuermann et al.(2009) defines a diagnosis as the “conclusion of an interpretive process that has as input a clinical picture of a given patient and as output an assertion to the effect that the patient has a disease of such and such a type.” The diagnostic workup is thus the final act of an iterative procedure, made of clinical exams and medical history investigation. While this definition chooses to stress the pivotal role of the clinician in the diagnostic workup, it neglects the role played by the patient. Yet, clinical investi-gation is conditional to the entrance of patients into the health care system in the first place. Their individual care-seeking behaviors and personal health management strategies are likely to induce variations in time period to diagnostic workup attributable to patients.
Multiple factors may explain the postponement of entrance into the health care system. Ballard et al.(2006) conducted qualitative interviews to understand women’s experiences in getting a diagnosis of endometriosis, which is a highly prevalent chronic pelvis pain disease. Patients with endometriosis wait on average 11.7 years before obtaining a final diagnosis in the United States of America (US) (Hadfield et al., 1996). When interviewed, women reported that they experienced symptoms long before their first medical contact. Symptoms were often disruptive to their lives but they did not consider this fact medically alarming. On the contrary, they described themselves as “unlucky,” rather than “ill.” Social norms and the absence of menstrual education also played an active role in inhibiting women from recognizing that their situation was abnormal. Fear and/or embarrassment prevented them from discussing their condition with family, friends, and medical professionals. Despite the severity of the pain, some women initially coped with symptoms until it became unbearable. In this context, patients delay their access to diagnoses.
Once the step of a first medical consultation was taken, some women reported that they felt the doctors did not believe the severity of their symptoms; this provides evidence that doctors’ characteristics are also a potential driver of the time period to diagnosis. Moreover, the symptoms of endometriosis can be intermittently suppressed by hormonal actions. Women would thus experience a temporary recovery, which would lead them to abandon consultation and in doing so, postponing the final diagnosis. Some features of the diseases—whether in the form of the disease’s relapsing-remitting nature —or
General Introduction
the generality of its symptoms make it even more difficult to reach a final diagnosis. Lastly, components of the health care system such as poor doctor coordination, absence of diagnostic facilities, or long waiting times for routine procedures are all additional potential explanations of longer time periods to diagnosis.
Beyond the specific features of diseases, potential factors contributing to variations in time to diagnosis thus include the characteristics of patients’, doctors, as well as the health care system organization more broadly. Little is known about the relative importance of each criteria in determining time to diagnosis because the literature is scarce in this domain. In addition, most evidence rests on a restrictive definition of time to diagnosis, which begins with the patient’s entrance into the health care system. However, we put forward the idea that time to diagnosis should instead be measured from symptom onset.
We discuss the extent to which the increase in time to diagnosis may be attributable to either patients or health professionals, although respective responsibilities cannot be easily assigned. Building on the previous example of doctors’ disbelief about symptom severity, responsibility might be imputable to doctors, or to patients, depending on framing. On the one hand, patients may fail to convey their message correctly, because they may lack health literacy or have very heterogeneous perceptions on good and bad health status, or have different expectations from the health care system. On the other hand, doctors may fail to interpret patients’ statements. The intrinsic nature of the patient-doctor relationship makes it difficult to single out respective responsibilities in delaying access to diagnostic services and calls for combining patient- and clinician-level sources of delay in diagnoses to consider an aggregate time period to diagnosis from first symptoms to final diagnosis.
We now turn to diagnostic delays in order to consider whether they (1) constitute lost opportunities for patients, and (2) play an important role in the construction of social health inequalities.
Social determinants of time to diagnosis
The French survey Erradiag, conducted in 2016, showed that 25% of patients treated for a rare disease reported their time to diagnosis to be above five years1. Nearly 60% of
patients declared that a lack of diagnosis led to physical harm, psychological distress, avoidable medical treatments, and sick leaves or absence from work. Additionally,
1Survey conducted by the patient organization “Alliance Maladies Rares.” Report available in French:
a systematic literature review on breast cancer found a reduced survival rate when diagnostic delays were between three to six months (Richards et al., 1999). Cancer relapses are shown to be more common if waiting times between diagnosis and treatment are longer (Chen et al., 2008). Results suggest that with a median time period under a month, time periods between diagnosis and treatment planning have a significant impact on tumor size (Jensen et al., 2007). Jensen et al. argue that “if cancer progresses this rapidly after diagnosis, it is not unreasonable to assume it progresses in the time spent establishing a diagnosis.”
This evidence shows the overriding nature of patients’ costs in terms of quality of life, health, and survival, by far the most detrimental aspects of diagnostic delays, and well beyond the potential large costs of avoidable sick leave and medical expenditures. Even in the absence of treatment options, the diagnostic workup is crucial for patients as they value information about their health status per se. A diagnostic workup offers labels and legitimizes their suffering. It confirms their inability to pursue their social, familial, and professional ambitions to their full capacity.
The World Health Organization (WHO) defines the social determinants of health as “the conditions in which people are born, grow, live, work and age” (WHO, 2008). The distribution of resources owned by individuals have been shown to determine a wide range of an individual’s health risks and outcomes. A large body of literature brought forth evidence on the existence of a social health gradient, which states that life expectancy is shorter and the prevalence of diseases is higher further down the social ladder in society (Wilkinson and Marmot, 2003; Marmot, 2005). Studies on socioeconomic inequalities in health in the European Union (EU) and the US reveal that avoidable health disparities originate from a large variety of underlying social disadvantages, such as gender or ethnicity (Braveman and Tarimo, 2002).
The extent to which the length of time to diagnosis is determined by social and economic factors remains undocumented. The objective of Chapter 1 of this thesis is to explore the existence of social determinants of time to diagnosis.
Costs and consequences of delays in diagnosis for patients appear to be substantial, yet remain under-documented. Exploring individual variations in time to diagnosis and its socioeconomic determinants may lead us to identify an essential component of social health inequalities. More specifically, the first chapter of the thesis measures the time to diagnosis from first symptoms until final diagnosis for four chronic conditions, and explores the role played by social capital and education in attaining a diagnosis. The diagnostic process,
General Introduction
which can successfully lead to a conclusion or not, is scattered with pitfalls for patients. Still, patients are not single players in their experiences with the disease.
After the final diagnosis, the challenge continues
Health economists demonstrate the specific impact of a condition on patients’ health by relying on generic health measures —see for example, the well known EuroQol 5D (EQ-5D) (Kind et al., 1998)—or disease-specific tools such as the European Organi-zation for Research and Treatment of Cancer Quality of Life Questionnaire Core 30 (EORTC QLQ-C30) in cancers (Aaronson et al., 1993). Part of those measures are meant to appraise the multidimensional nature of health by combining a variety of health components. For example, EQ-5D includes dimensions such as mobility, ability with daily activities, pain, and psychological distress. These facilitate a measure of the disease’s consequences on patients’ health and quality of life. Complementary investigations have endeavoured to describe disease-specific socio-economic costs —see for example, the Social Economic Burden and Health-Related Quality of Life in Patients with Rare Diseases in Europe (BURQOL-RD) (Chevreul et al., 2015). The combination of such tools unveil a key component in patients’ treatment management, which largely contributes to the sustainability of their health and their quality of life: the caregivers.
Literature related to caregivers shows that diseases have an impact beyond the patient and impact their informal support system. Caregivers are characterized by their strong commitment to a patient, while often being informal and unpaid (Dwyer et al., 1994). Research has recently moved from a focus on patients only, to a focus on patients within their environment and support structure (Caqueo-Ur´ızar et al., 2009;Dwyer et al.,1994). In this context, an important question is how a cost-effectiveness assessment could factor in the burden to caregivers within health technology appraisals (Tubeuf et al., 2019). Caregiving activities have been shown to have detrimental consequences on caregivers’ physical and mental health due to “physical work, emotional pressure, social restrictions, and economic demand arising from taking care of a patient” (Dillehay and Sandys,1990).
The objective of Chapter 2 is to delineate health spillovers from patients’ health to caregivers. With a focus on patients, the first part of this thesis takes chronic diseases as the main example. The choice to focus on chronic diseases is owing to obvious data shortage and the impossibility of collecting patient-level data on rare diseases that is original, rigorously produced, and of sufficient sample size for further quantitative analysis within the time frame of the PhD. The choice of chronic diseases, defined as “conditions that last one year or more and require ongoing medical attention and/or
limit activities of daily living,” which are the leading cause of mortality and morbidity in developed countries (Yach et al., 2004), was motivated by an ambition to reflect the challenges encountered in the diagnostic process of a rare disease.
The first part of the PhD dissertation provides thought-provoking considerations for rare diseases in numerous respects: (1) the diagnosis of rare conditions is complex, and we observe delays in obtaining the diagnostic workup, (2) rare diseases have substantial implications or patients’ professional, family, and/or educational prospects, and (3) the health spillovers on caregivers are significant.
Rare diseases: What they are and their effects
Rare diseases represent a “broad assortment of disorders and constellations of clinical signs and symptoms” (Luzzatto et al., 2015). The term “rare diseases” is transparent enough to refer to diseases that affect a small percentage of the population. But how rare is rare? Everyone seem to have their own answer. A literature review on rare disease terminology found that 58% of rare disease definitions disclosed a prevalence threshold, with an average of 40 people in 100,000 within a defined geographic area (Richter et al., 2015). But the definition of rare diseases is very much a political decision as it determines the scope of diseases that fall within the political framework for action in the field of rare diseases. The Food and Drug Administration (FDA) defines any disease or condition that affects fewer than 200,000 people in the United States as rare (Richter et al., 2015). At the European level, rare diseases are defined by the European Medicines Agency (EMA) as life-threatening or chronically debilitating conditions that affect no more than 5 in 10,000 people in the EU (Rodwell and Aym´e, 2015; European Medicines Agency, 2013). At the aggregate level, rare diseases affect a substantial number of individuals: to date, between 5,000 and 8,000 distinct rare diseases have been documented (European Medicines Agency, 2013), affecting a total of 30 million patients in Europe, and approximately the same number in the US (Griggs et al., 2009).
The difference between a rare and a common disease extends beyond the simple numeric oddity. Average time period until diagnosis is usually dramatically longer in rare diseases as compared to a common disease. We look at the relevant example of Alpha-1 Antit-rypsin Deficiency Disorder (AATD) to illustrate all of the challenges encountered through the diagnostic process (Stoller, 2018). Patients suffering fromAATD face on average 7 to 8 years before receiving a final diagnosis (Greulich et al., 2013;Stoller et al.,2005, 1994). Results also suggest that patients with longer diagnostic time frames presented clinical sequelae, worse functional status, and advanced symptoms at the time of the diagnosis
General Introduction
(Tejwani et al., 2017). The low occurrence of AATD clinical cases makes it particularly difficult to identify in routine clinical practice. Lack of clinical expertise in rare diseases is acknowledged by a declarative survey where both general practitioners and special-ists reported having little or no knowledge ofAATDin 64% of cases (Greulich et al.,2013). We highlighted the lack of expertise on rare diseases by health professionals and its sub-sequent impact on patient prognoses. With rare diseases, poor disease expertise adds up to few treatment opportunities.
From R&D to diagnosis, and back
Research in rare diseases faces two major obstacles. First, rarity makes research complex. Observed heterogeneity between patients confuses the trace back of the disease’s natural history and epidemiology, and hence the definition of specific diagnostic criteria (Auvin et al., 2018; Nestler-Parr et al., 2018). Five new rare diseases are described every week in medical literature (Nestler-Parr et al., 2018): so far there are 5,000 to 8,000 distinct rare diseases that have been documented (European Medicines Agency, 2013). These figures are growing rapidly thanks to DNA-sequencing technological improvements that offer a better understanding of the human genome and facilitate diagnostic success for a number of rare diseases (Boycott et al., 2013). Secondly, there is a lack of incentives to fund R&D into rare diseases. According to many studies, producing orphan drugs is not profitable due to high R&D costs for rare diseases (Buckley, 2008) and market size being insufficiently large to recover fixed costs. One significant item of expenditure is patient recruitment into clinical trials. Given the low prevalence of rare diseases, the recruitment phase is shown to be significantly larger with some recruitment processes spanning more than 17 years (DiMasi et al., 2003). Though, in absence of access to private data on R&D expenditure, the extent to which R&D in rare diseases is financially damaging for pharmaceutical industries remains undocumented.
In response to these challenges, the US and EU enacted beneficial regulation in the field of rare diseases inspired by innovation policies. The Orphan Drug Act (ODA) was implemented in 1983 in the US; it offers 50% taxes credits, FDA approval process fees waivers, grants program for research and technological developments, scientific advice and protocol assistance by the FDAto fulfill the regulatory process for marketing autho-rization, pre-licensing access, free pricing, and reimbursement at 95% under Medicare for drugs targeting diseases with a prevalence (mean number of people affected by a disease for a period of time) lower than 75 cases over 100,000 in the population. The orphan
drug designation granted by the FDA favors development and market access for some drugs that would not be profitable without the state’s incentive. From 1983 to 2016, 503 drugs and biological products were approved for rare diseases and 1,132 drugs obtained an orphan designation (Hughes and Poletti-Hughes, 2016).
Thousands of patients with rare diseases could then access new therapies and improve their health and living conditions. In 2000, the Orphan Drug (OD) Number 141/2000 of the European Parliament and the Council on orphan medicinal products provided incentives to encourage theR&Dof medicines to treat, prevent, or diagnose rare diseases. One feature of these policies is that these advantages are also granted if the target popula-tion is under the rare disease threshold. In that respect, theOD policy may have spurred research into subsets of the patient population classified under non-rare diseases since the criteria for benefiting from supply-side incentives is mainly the targeted population size. Hence, if a particular clinical trial is conducted on relatively small targeted patient population, it could be eligible for orphan drug designation. The increasing trend in precision medicine, defined as drugs relying on genetic, epigenetic, and protein biomarkers has led to specific disease sub-type refinements. These might have been encouraged further by the introduction of the OD policy (Chandra et al. (2017)). Biomarkers are defined as “a characteristic that is objectively measured and evaluated as an indica-tor of normal biologic processes, pathogenic processes, or pharmacologic responses to a therapeutic intervention”2. They are good predictors of clinical response to a treatment.
In theEU, from the inception of theOD regulation through 2015, 133 orphan drugs were granted Market Authorization (MA) (Giannuzzi et al. (2017b)) so that the OD policy is often described as having led to unprecedented investments by manufacturers in R&D
targeting rare diseases. However, the study of the indirect impact of the OD legislation on drug development for diseases that are not considered rare has never been studied. In addition, 133 orphan drugs are distributed between 5,000 to 8,000 different rare diseases. The objectives of Chapter 3 and Chapter 4 are (1) to evaluate the innovative policy aiming to foster R&D in rare disease areas, with a special emphasis on non-rare drugs with a OD qualifying indications, and (2) to analyze the distribution ofR&Dwithin rare diseases according to disease characteristics and investigate the existence of inequalities in the allocation of R&D resources within rare disease areas. This chapter investigates the impact of innovation policies on pharmaceutical firms’ private decisions.
2National Institute of Health (NIH)formed the Biomarker Definition Working Group
General Introduction
Considering the need to tackle the high unmet needs of patients with rare diseases, policy makers introduced supply-side incentives with the objective of fostering firms’ decisions to invest in R&D for rare diseases. More than 20 years after the introduction of such policies, numerous orphan drugs have been approved. But is that enough to conclude that it became (1) accessible and, (2) game-changing to patients with rare diseases? From R&D to access to drugs, and back
Policy makers tasked with allocating resources within the health care system face a major conflict between an unlimited demand of care and limited resources (L´opez-Bastida et al., 2018). Once approved for a rare indication, orphan drugs must undergo a formal
Health Technology Assessment (HTA) in a number of regions including North America, Australia, many European countries, and more recently Latin America and Asia (Ciani and Jommi, 2014).
HTA relies on the evaluation of the cost-effectiveness of a new technology and provides guidance on the social benefit of a particular health technology in a given country. Rec-ommendations on medicines and other health technologies are meant to support funding, coverage, and reimbursement decisions or price negotiation about health technologies by the health care system in a specific country (Sorenson et al., 2008). While HTA requires clinical and economic evidence, for a number of reasons it is rarely available for orphan drugs. One reason is that it is impossible to run randomized control trials, which are the gold standard methodology to robustly measure clinical efficacy (Bothwell et al., 2016). Another reason is that clinical trials of rare diseases may not have any control arm, due to ethical considerations, and a comparable technology may not exist (Nicod,2017). The limited sample size along with heterogeneity in patients’ disease progression or clinical sub-type of the disease will ultimately impact the reliability of costs and clinical efficacy estimates (Bothwell et al., 2016).
The uncertainty surrounding the benefit of new treatments for rare diseases is not the only issue at stake. The costs of new approved drugs for rare diseases is also a major concern for health services and policy makers worldwide, and thus is the source of much public debate. In recent years, steep prices have been noticed for drugs designed to treat rare diseases. For example, the cost of the treatment of Gaucher’s diseases was estimated to be US$200,000 on average per patient per year Luzzatto et al. (2018). Moreover, the number of approved drugs each year is increasing, along with the share of orphan drugs in total sales each year in the US (see Figure0.1 and Figure 0.2 below).
Figure 0.1 – Number of Approved Orphan Indications per year in the US
Source: Report IQVIA, Orphan Drugs in the USA — Growth Trends in Rare Disease Treatments, 2018
Figure 0.2 – Orphan Drug Expenditure and Share of Orphan Drug Expen-diture in Total Sales
Source: Report IQVIA, Orphan Drugs in the USA — Growth Trends in Rare Disease Treatments, 2018. The dark curve indicates the % share of orphan drug sales in total sales. The bars indicate the orphan spending in US$Bn.
While one may think that orphan drugs have generated limited sales, we do observe many orphan drugs among blockbusters generating at least US$1 billion in sales ( Wellman-Labadie and Zhou, 2010), a fact that can be surprising considering that orphan drugs are supposed to target very small populations. According to Cˆot´e and Keating (2012), biotechnological and pharmaceutical firms have rapidly adopted strategies to make huge profits out of the orphan drug regulations. An orphan drug may be applicable to either
General Introduction
several rare or non-rare diseases. In such situation, orphan drugs have access to a larger market than expected by the demand side, and sometimes largely recover theirR&Dfixed costs. Moreover, in case of an extension of indication, pharmaceutical firms may undergo lower fixed costs as most of the research process has been achieved, and thus the firms only bear the cost of undertaking new clinical trials (Cˆot´e and Keating, 2012). Lastly, pharmaceutical firms that own an orphan drug designation have been shown to get higher market stock valuations because of a predicted increase in their profits (Gorry and Useche, 2017). Evidence from Belgium on prices suggests that the lower the prevalence of a rare disease, the higher the price of the drug (see Figure 0.3) (Simoens, 2011).
Figure 0.3 – Association between Annual Belgian Cost per Patient of an Orphan Drug and Disease Prevalence
Source: (Simoens, 2011)
L´opez-Bastida et al. (2018) have investigated the large willingness to pay for orphan drugs using a discrete choice experiment, and the study of the relative importance of attributes used to describe different choice options in five European countries (England, France, Germany, Italy, and Spain). Results show that disease severity and treatment effectiveness are two important dimensions in funding decisions from a social perspective. This confirms the existence of social preference in the funding of drugs. But should we really consider that collective preferences provide clear guidance on funding decisions? What are the implications for society if one invests more in promoting health in the population’s subgroups?
Given the high level of uncertainty surrounding orphan drugs costs, efficacy, and the budget constraint, the objective of Chapter 5 is to address the impact of orphan drug approvals on premature mortality, providing evidence on the returns to the large social investments into pharmaceutical innovation for rare diseases. It discusses how challenging it is, notably for policy makers, to estimate the clinical benefit of orphan drugs.
The objective of Chapter 6 is to go a step beyond in the evaluation of orphan drugs, given their specificity, and discuss how they are ultimately made available to patients. We use the interesting example of the National Institute for Health and Care Excellence (NICE)
that makes recommendations in terms of health care treatments to patients within the
National Health Service (NHS) in the United Kingdom (UK). In the UK, patients are provided with treatments available in the health care basket covered by the nationalized and free health care system. The choice to include a health technology in the health care basket covered by the NHS is based on a combined analysis of the costs and the effectiveness of this new therapy compared to conventional therapeutic strategies and past reimbursement decisions.
Overview of the Chapters
This dissertation is divided into three parts, each of them comprising two chapters.
Part I — THE DIAGNOSTIC QUEST AND ITS PREJUDICE TO
PA-TIENTS AND CAREGIVERS
The first part of the dissertation is devoted to the patient’s diagnostic experience and its consequences for patients’ relatives. Chapter 1 is focused on the determinants of time to diagnosis, and emphasizes the role of patient characteristics, notably social capital, in accessing a final diagnosis. Chapter 2 then evaluates health spillovers and investigates the causal impact of a chronic disease diagnosis on the health of one network member for a patient: the mother.
Chapter 1
In Chapter 13, we define time to diagnosis as the time span from first symptoms to final
diagnosis. We measure time to diagnosis for four chronic conditions (bipolar disorder, Crohn’s disease, multiple sclerosis, and psoriasis), and analyze the role played by patients’
3The chapter is based on a paper co-authored with Paul Dourgnon and Lise Rochaix
General Introduction
education and social networks in explaining time to diagnosis. The data collected are self-reported as part of an online open access questionnaire we designed and administered to a large French social network of patients with chronic conditions. Duration models are used to explain variations in time to diagnosis.
Our findings suggest that social participation and social support reduce the probability of experiencing longer time spans to diagnosis. On the contrary, higher levels of education are associated with an increase in the probability of experiencing longer time spans to diagnosis. We further analyze these results and identify the differences in patients’ health care-seeking behavior: more educated patients tend to visit specialists first, which leads to longer time spans to diagnosis as specialists are less likely to refer patients to hospitals for additional tests when needed, compared to general practitioners. While these findings support the WHO’s recommendations to enhance individuals’ social capital, results on education provide support for reforms aimed at implementing General Practitioner (GP)
referral systems.
Chapter 2
In Chapter 24, we investigate the causal impact of a shock on a child’s health on the
main caregiver’s health. We define the shock on a child’s health as the onset of a chronic disease resulting in a drop in the child’s self-reported health status. We use data from the
Growing Up in Scotland (GUS) longitudinal study that includes eight waves of health information on child-mother pairs.
Using a logit fixed effect specification, we find that mothers are significantly more likely to report a lower level of self-reported health as a result of a shock on their child’s health. To disentangle the effect on physical and mental health, we use both the SF-12 physical and health indices. The findings suggest that mother’s physical health is significantly impacted by a shock on a child’s health, while there is no significant effect on their mental health. We further investigate the variation across time and find that the impact of the shock on a child’s health on the mother’s physical health significantly and constantly increases after the shock on the child’s health. This confirms the existence of persistent health spillovers from a child’s health onto the mother’s health.
Results suggest that the deterioration of health was significantly stronger when the child has a disease that is time-consuming and requires relatively more time resources than
money resources from main caregivers. In that case, we see the mothers’ probability of reporting a higher health category reduced by 49%, everything else being held constant in the model. This confirms the existence of persistent health spillover effects from child to mother. We finally investigate the impact of a shock on the child’s health on the mother’s health when the chronic disease is time-intensive and when it is money-intensive. Results suggest that a shock on the child’s health is even more detrimental when the chronic disease is time-intensive.
Part II — FIRMS’ DECISIONS TO ALLOCATE R&D TO RARE DISEASES The second part of the dissertation focuses on innovation in rare disease areas and inves-tigates firms’ decisions to invest in rare diseases. While Chapter 3 estimates the causal impact of a policy introduced at the European level on R&D into rare diseases, Chapter 4 studies the allocation of R&D between rare diseases.
Chapter 3
Chapter 3 estimates the causal impact of the OD legislation, which was introduced in 2000 at the European level and offers supply-side market incentives to stimulate R&D
investment levels in rare diseases. We study the impact of theODlegislation by examining the variation in the number of new clinical trials and new academic publications between 1997 and 2015 using aDifference-in-Differences (DiD)design estimated with a conditional fixed effect Poisson model. We find a causal positive impact on the number of clinical trials from the year 2004 that increases over the 10 years following the legislation. The causal effect of theODlegislation on academic publications was significant and immediate after the introduction of the policy. The policy increased by 52 the count of clinical trials in rare diseases per disease. It appears that the pharmaceutical industry largely responds to financial incentives when allocating R&D resources.
Chapter 4
Chapter 45 investigates the existence of inequalities in the allocation of R&D resources
within rare diseases and identifies the characteristics of rare diseases that appear to lead
R&D investments. Rare diseases are generally underserved by drug development because pharmaceutical industries considerR&Dinvestment into rare diseases too costly and risky in comparison with the low expected returns due to the small population involved. 80%
5The chapter is based on a published paper co-authored with Sandy Tubeuf: (Ra¨ıs Ali and Tubeuf, 2019)
General Introduction
of rare diseases are not part of pharmaceutical firms’R&Dagendas and such limitedR&D
investment might impact the access to treatment for patients with rare diseases, thus leading to further health inequalities in the population.
There have been considerable discussions within the philosophical and political economy literature about the welfare state’s role in promoting equity in the provision of goods and services, especially the need for public health actors to tackle health inequalities and prioritize the most disadvantaged groups. Combining data from Orphanet and PubMed and calling upon non-parametric methods such as stochastic dominance and bilateral tests, we show that rare diseases in children and with a smaller prevalence are underserved by R&D. R&D efforts appear to be concentrated in more profitable research areas with potentially larger sample sizes for trial designs and adult population.
Part III — REGULATORS’ CHALLENGES IN DEFINING THE CONDI-TIONS OF ACCESS TO INNOVATIVE DRUGS
The third part of the dissertation covers the issues facing policy makers in measuring the health benefits of innovative health technologies and addressing the opportunity costs of health care resources while defining the conditions of access to pharmaceutical innovation for patients with rare diseases. Chapter 5 examines the causal impact of pharmaceutical innovation and academic publications on longevity, and Chapter 6 evokes the equity per-spectives in the economic evaluation of health technologies, especially in the nationalized English and Welsh health care systems.
Chapter 5
In this chapter, we measure the causal impact of pharmaceutical innovation and academic publications on premature mortality from rare diseases using a two-way fixed effect model. We then investigate how pharmaceutical innovation impacts longevity over time. We appraise premature mortality by computing Years of Potential Life Lost (YPLL) at ages 65, 70, 75, 80, and 85 from longitudinal data containing all US death certificates from the period 1999-2015. We control our results for variation in diagnostic ability that may lead us to underestimate the impact of pharmaceutical innovation on premature mortality caused by rare diseases. Results suggest that pharmaceutical innovation, as measured by the cumulative number of lagged approved drugs, significantly reduces the number of YPLL at 65 by an average of -455 years per disease. The investigation of the time variation in the impact of drug approval on premature mortality suggests that drug
approval significantly decreases the number of YPLLat 65 and YPLLat 70 between two and four years after approval.
Chapter 6
Chapter 66 discusses how the NICE, which is responsible for recommending treatments
and health care for patients within the NHS in England and Wales, evaluates health care technologies. TheNICEhas a dual objective of clinical excellence and a balanced budget, which is at the forefront of decisions and recommendations regarding treatments made available within the basket of goods and services. As part of NICE’s health technology assessment process, health gains and induced costs are compared by calculating an
Incremental Cost-Effectiveness Ratio (ICER) expressing the cost per Quality Adjusted Life Years (QALY). The value of the ICER is then compared to a cost-effectiveness threshold for health technologies defined by NICE in 2000. This cost-effectiveness threshold of health technologies is an interval between £20,000 and £30,000 per QALY; below this range, an innovative health technology is considered highly cost-effective, within the range it is cost-effective, and over £30,000 per QALY, the new treatment is deemed too expensive compared to the expected gain in health.
The case ofNICEis of utmost interest to this thesis for two reasons: (1) unlikeNICE, most countries do not use an explicit threshold for their decisions in health care resources, and (2) NICE adopts a more flexible approach to the use of the threshold for some particular decisions, including the health care treatment for rare diseases. This chapter offers a critical discussion of the methodological foundations of the cost-effectiveness threshold in the evaluation of health technologies and it highlights the gaps between the reference model and the actual practice as well as the apparent equity issues for NHS patients.
6The chapter is based on a paper co-authored with Sandy Tubeuf
Pr´
esentation de la th`
ese en fran¸
cais
Most of us cluster somewhere in the middle of most statistical distributions. But there are lots of bell curves, and pretty much everyone is on a tail of at least one of them. We may collect strange memorabilia or read esoteric books, hold unusual religious beliefs or wear odd-sized shoes, suffer rare diseases or enjoy obscure movies.
Virginia Postrel
Les maladies rares sont des objets d’´etude stimulants pour les ´economistes tant les d´efis soulev´es `a l’ordinaire par les maladies sont pouss´es `a leur paroxysme lorsque la pathologie consid´er´ee est rare. Ce constat nous a conduit `a utiliser le terme d’Odyss´ee afin d’appr´ecier la nature tr`es particuli`ere des maladies rares.
Cette th`ese de doctorat est structur´ee autour de trois acteurs au coeur de l’Odyss´ee diagnostique et th´erapeutique des patients atteints de maladies rares. La partie I est d´edi´ee aux patients et ses interactions sociales. Cette partie s’int´eresse `a l’effet des caract´eristiques des patients sur le d´elai d’obtention de son diagnostic, parmi lesquelles le capital social. Cette partie ´evoque ´egalement les externalit´es n´egatives affectant la sant´e des m`eres aidantes informelles dans le cas d’un diagnostic d’une pathologie chronique infantile.
L’industrie pharmaceutique est le second acteur de l’Odyss´ee diagnostique des patients atteints de maladies rares. La seconde partie de la th`ese est d´edi´ee `a l’industrie pharma-ceutique et s’int´eresse aux d´ecisions d’investissements de R&D ciblant les maladies rares. Enfin, la Partie III est d´edi´ee aux d´ecideurs publics et discute des enjeux d’´evaluation des b´en´efices de l’innovation th´erapeutique et de la d´efinition des conditions d’acc`es `a cette innovation.
Dans cette introduction g´en´erale, je souhaite poursuivre deux objectifs. Le premier est de souligner la sp´ecificit´e des maladies rares dans l’acc`es au diagnostic et au traitement justifiant par l`a l’usage du terme d’Odyss´ee. Le second est d’expliquer qu’il est crucial d’inscrire les maladies rares dans une r´eflexion globale, et ce en d´epit de la nature tr`es singuli`ere de chaque pathologie rare.
Mesurer le temps d’acc`es au diagnostic
Scheuermann et al. (2009) d´efinissent le diagnostic comme la “conclusion d’un processus interpr´etatif qui a pour d´ebut le tableau clinique d’un patient donn´e et comme fin une affirmation selon laquelle le patient a une maladie de tel type”. Le diagnostic est donc l’acte final d’une proc´edure it´erative, constitu´ee d’examens cliniques et d’une enquˆete sur les ant´ec´edents m´edicaux. Alors que cette d´efinition souligne le rˆole central du clinicien dans l’´etablissement du diagnostic, elle n´eglige par la mˆeme le rˆole central occup´e par le patient. En effet, l’investigation clinique est conditionnelle `a l’entr´ee du patient dans le syst`eme de sant´e. Le comportement individuel du patient en mati`ere de recherche de soins et sa strat´egie de gestion de sa sant´e sont des ´el´ements susceptibles d’induire du d´elai dans l’obtention de son diagnostic, imputable aux patients.
Plusieurs facteurs peuvent expliquer le report de l’entr´ee du patient dans le syst`eme de sant´e. Ballard et al. (2006) ont men´e des entretiens qualitatifs afin de comprendre les exp´eriences des femmes en mati`ere de diagnostic de l’endom´etriose, une maladie chronique occasionnant des douleurs chroniques du bassin. Les patientes atteintes d’endom´etriose attendent en moyenne 11,7 ans avant d’obtenir un diagnostic d´efinitif de la pathologie (Hadfield et al., 1996). Lorsqu’elles ont ´et´e interrog´ees, les femmes ont signal´e qu’elles avaient pr´esent´e des symptˆomes bien avant leur premier contact m´edical. Ces symptˆomes perturbaient souvent leur vie quotidienne, sans que cela les alarme sur le plan m´edical. Au contraire, loin d’envisager un diagnostic m´edical, elles se consid´eraient comme “malchanceuses” plutˆot que “malades”. Les normes so-ciales et l’absence d’´education menstruelle ont jou´e un rˆole dans l’impossibilit´e des femmes `a reconnaˆıtre la nature v´eritable de leur situation. La peur et l’embarras les ont dissuad´ees d’aborder leur probl`eme de sant´e avec leur famille, leurs amis et des professionnels de la sant´e. En d´epit de la s´ev´erit´e de la douleur, certaines femmes ont d´eclar´e avoir support´e l’insupportable avant de se d´ecider `a consulter un avis m´edical. Dans ce contexte, les patients se r´ev`elent ˆetre eux-mˆemes une source de d´elai de diagnostic.
Une fois la premi`ere consultation m´edicale d´epass´ee, certaines femmes ont d´eclar´e avoir le sentiment que les m´edecins ne mesuraient pas la gravit´e de leurs symptˆomes. Cela
prouve que les caract´eristiques des m´edecins sont ´egalement une autre source de d´elai de diagnostic. De plus, les symptˆomes de l’endom´etriose peuvent ˆetre supprim´es par intermittence, sous l’action des hormones. Les femmes connaˆıtront ainsi un r´ etablisse-ment temporaire, ce qui pourrait les inciter `a repousser la consultation m´edicale, et ce faisant, `a reporter l’obtention du diagnostic final. Certaines caract´eristiques de la maladie —de son caract`ere cyclique compos´e de phases de r´etablissement et de rechute ou de la g´en´eralit´e de ses symptˆomes pr´esent´es —complexifient davantage encore l’´etablissement d’un diagnostic final. Enfin, les caract´eristiques propres au syst`eme de sant´e telles que le niveau de coordination des m´edecins, l’existence de tests diagnostic ou la dur´ee des d´elais d’attente pour les proc´edures de routine, sont autant d’explications possibles au retard diagnostic.
Au-del`a des caract´eristiques sp´ecifiques des maladies, les facteurs potentiels contribuant aux variations du temps n´ecessaire pour converger au diagnostic incluent donc les caract´eristiques des patients, des m´edecins, ainsi que l’organisation du syst`eme de sant´e au sens large. L’importance relative de chaque crit`ere dans la d´etermination du d´elai de diagnostic est mal connue, car la litt´erature est rare dans ce domaine. En outre, la plupart des preuves reposent sur une d´efinition restrictive du d´elai de diagnostic, qui commencerait avec l’entr´ee du patient dans le syst`eme de sant´e. Cependant, nous avan¸cons ici l’id´ee que le d´elai de diagnostic devrait plutˆot ˆetre mesur´e d`es l’apparition des symptˆomes de la pathologie.
Nous avons discut´e de la mesure dans laquelle l’augmentation du d´elai de diagnostic pouvait ˆetre attribu´ee aux patients ou aux professionnels de la sant´e, bien que les responsabilit´es respectives ne puissent ˆetre facilement distingu´ees. Les patients peuvent ne pas transmettre correctement leur message ou celui-ci peut-ˆetre incorrectement interpr´et´e. Les patients peuvent ´egalement avoir des perceptions tr`es h´et´erog`enes de ce qu’est un bon ou un mauvais ´etat de sant´e, ayant en cons´equence des attentes diff´erentes envers le syst`eme sant´e. La nature intrins`eque de la relation patient-m´edecin rend difficile l’identification des responsabilit´es respectives en ce qui concerne le retardement de l’acc`es au diagnostic final.
Les retards de diagnostic (1) constituent-ils une perte de chance pour les patients et; (2) jouent-ils un rˆole crucial dans la construction des in´egalit´es sociales de sant´e ?
D´eterminants sociaux du d´elai de diagnostic
L’enquˆete fran¸caise Erradiag, men´ee en 2016, a montr´e que 25% des patients trait´es pour une maladie rare d´eclaraient un d´elai de diagnostic sup´erieur `a cinq ann´ees7.
Pr`es de 60% des patients ont d´eclar´e que l’absence de diagnostic avait entrain´e pour eux des dommages physiques, une d´etresse psychologique, des traitements m´edicaux ´evitables, des cong´es de maladie ou des absences du travail. En outre, une revue syst´ematique de la litt´erature sur le cancer du sein a mis en ´evidence un taux de survie r´eduit lorsque les d´elais de diagnostic ´etaient compris entre trois et six mois. La litt´erature sugg`ere ´ egale-ment que la r´ecidive dans le cancer est plus fr´equente si les d´elais entre le diagnostic et le traitement sont allong´es (Chen et al., 2008). Les r´esultats sugg`erent qu’avec une p´eriode m´ediane inf´erieure `a un mois, les d´elais entre le diagnostic et l’initiation du traitement ont un impact significatif sur la taille de la tumeur (Jensen et al., 2007). Jensen et al. (2007) ajoutent que “si le cancer progresse aussi rapidement apr`es le diagnostic, il n’est pas d´eraisonnable de supposer qu’il progresse dans les temps pass´es `a ´etablir le diagnostic.”
Ces r´esultats soulignent les coˆuts support´es par les patients en termes de qualit´e de vie, de sant´e et de survie, qui sont de loin les aspects les plus pr´ejudiciables d’un retard diagnostic, bien au-del`a des coˆuts pourtant ´elev´es des cong´es de maladie et des d´epenses m´edicales ´evitables. Mˆeme en l’absence de traitement, l’´etablissement du diagnostic est crucial pour les patients car ceux-ci valorisent les informations relatives `a leur ´etat de sant´e per se. L’´etablissement du diagnostic met un libell´e sur leur maladie et l´egitime leur souffrance. Dans le cas d’une pathologie invalidante, cela confirme leur incapacit´e `a poursuivre pleinement leurs ambitions sociales, familiales et professionnelles.
L’Organisation Mondiale de la Sant´e (OMS) d´efinit les d´eterminants sociaux de la sant´e comme “les conditions dans lesquelles les personnes naissent, grandissent, vivent, travaillent et vieillissent” (WHO, 2008). La r´epartition des ressources entre individus d´etermine un large ´eventail de risques et de r´esultats de sant´e. De nombreux travaux ont mis en ´evidence l’existence d’un gradient social de sant´e , selon lequel l’esp´erance de vie est de plus en plus courte et la pr´evalence des maladies de plus en plus ´elev´ee dans la soci´et´e `a mesure que l’on descend dans la hi´erarchie des revenus (Wilkinson and Marmot, 2003;Marmot,2005). Des ´etudes sur les in´egalit´es socio-´economiques en mati`ere de sant´e aux ´Etats-Unis et en Europe r´ev`elent que les disparit´es ´evitables en mati`ere de sant´e d´ecoulent d’une grande vari´et´e de d´esavantages sociaux sous-jacents, tels que le sexe ou l’origine ethnique, (Braveman and Tarimo, 2002).
7Enquˆete r´ealis´ee par l’Association de patients “Alliance Maladies Rares”. Rapport disponible en fran¸cais:
https://www.alliance-maladies-rares.org/erradiag-enquete-sur-lerrance-diagnostique-dans-les-maladies-rares-2/