www.biogeosciences.net/5/433/2008/
© Author(s) 2008. This work is distributed under the Creative Commons Attribution 3.0 License.
Biogeosciences
Quality control of CarboEurope flux data – Part 1: Coupling
footprint analyses with flux data quality assessment to evaluate sites
in forest ecosystems
M. G¨ockede1,*, T. Foken1, M. Aubinet2, M. Aurela3, J. Banza4, C. Bernhofer5, J. M. Bonnefond6, Y. Brunet6, A. Carrara7, R. Clement8, E. Dellwik9, J. Elbers10, W. Eugster11, J. Fuhrer12, A. Granier13, T. Gr ¨unwald5, B. Heinesch2, I. A. Janssens14, A. Knohl15,16, R. Koeble17, T. Laurila3, B. Longdoz13, G. Manca17, M. Marek18, T. Markkanen1,19, J. Mateus20, G. Matteucci21, M. Mauder1,**, M. Migliavacca22, S. Minerbi23, J. Moncrieff8, L. Montagnani23, E. Moors10, J.-M. Ourcival24, D. Papale25, J. Pereira26, K. Pilegaard9, G. Pita20, S. Rambal24, C. Rebmann15, A. Rodrigues27, E. Rotenberg28, M. J. Sanz7, P. Sedlak29, G. Seufert17, L. Siebicke1, J. F. Soussana30, R. Valentini25, T. Vesala19, H. Verbeeck14,***, and D. Yakir28
1University of Bayreuth, Dept. of Micrometeorology, Bayreuth, Germany
2University of Agricultural Sciences, Unit of Biosystems Physic, Gembloux, Belgium 3Finnish Meteorological Institute, Helsinki, Finland
4University of Evora, Evora, Portugal
5Technische Universit¨at Dresden, Inst. of Hydrology and Meteorology, Dept. of Meteorology, Tharandt, Germany 6INRA, EPHYSE, Bordeaux, France
7Foundation CEAM, Valencia, Spain
8University of Edinburgh, School of GeoSciences, Edinburgh, UK
9Technical University of Denmark, Risø National Laboratory, Roskilde, Denmark 10Alterra, Wageningen, The Netherlands
11ETH Zurich, Institute of Plant Sciences, Zurich, Switzerland
12Agroscope Research Station ART, Air Pollution/Climate Group, Zurich, Switzerland
13INRA, Centre INRA Nancy, UMR1137 Ecologie et Ecophysiologie Foresti`eres, Champenoux, France
14University of Antwerpen, Dept. of Biology, Research Group of Plant and Vegetation Ecology, Wilrijk, Belgium 15Max Planck Institute for Biogeochemistry, Jena, Germany
16ETH Zurich, Institute of Plant Sciences, Zurich, Switzerland 17JRC, Inst. for Environment and Sustainability, Ispra, Italy
18Institute of Systems Biology and Ecology AS CR, ˇCesk´e Budˇejovice, Czech Republic 19University of Helsinki, Dept. of Physical Sciences, Helsinki, Finland
20Instituto Superior Tecnico, Lisbon, Portugal
21CNR-ISAFOM, Institute for Mediterranean Agricultural and Forest Systems, Rende, Italy 22Remote Sensing of Environmental Dynamics Lab., DISAT-UNIMIB, Milan, Italy
23Forest Department, Agency for the Environment, Autonomous Province of Bolzano-South Tyrol, Italy 24INRA, DREAM CEFE-CNRS, Montpellier, France
25University of Tuscia, Dept. of Forest Environment and Resources, Viterbo, Italy 26Instituto Superior de Agronomia, Lisbon, Portugal
27Estac¸˜ao Florestal Nacional, Oeiras, Portugal
28Weizman Institute of Science, Dept. of Environmental Sciences and Energy Research, Rehovol, Israel 29Institute of Atmospheric Physics AS CR, Praha, Czech Republic
30INRA, Institut National de la Recherche Agronomique, Paris, France *now at: Oregon State University, Dept. of Forest Science, Corvallis, USA **now at: Agriculture and Agri-Food Canada, Research Branch, Ottawa, Canada
***now at: Laboratory of Climate Sciences and the Environment (LSCE), Joint Unit of CEA-CNRS, Gif-sur-Yvette, France Received: 27 September 2007 – Published in Biogeosciences Discuss.: 9 November 2007
Abstract. We applied a site evaluation approach combining Lagrangian Stochastic footprint modeling with a quality as-sessment approach for eddy-covariance data to 25 forested sites of the CarboEurope-IP network. The analysis addresses the spatial representativeness of the flux measurements, in-strumental effects on data quality, spatial patterns in the data quality, and the performance of the coordinate rota-tion method. Our findings demonstrate that applicarota-tion of a footprint filter could strengthen the CarboEurope-IP flux database, since only one third of the sites is situated in truly homogeneous terrain. Almost half of the sites experience a significant reduction in eddy-covariance data quality un-der certain conditions, though these effects are mostly con-stricted to a small portion of the dataset. Reductions in data quality of the sensible heat flux are mostly induced by characteristics of the surrounding terrain, while the latent heat flux is subject to instrumentation-related problems. The Planar-Fit coordinate rotation proved to be a reliable tool for the majority of the sites using only a single set of rotation angles. Overall, we found a high average data quality for the CarboEurope-IP network, with good representativeness of the measurement data for the specified target land cover types.
1 Introduction
Continuous monitoring of fluxes between biosphere and at-mosphere using the eddy-covariance technique (e.g. Aubi-net et al., 2000; Baldocchi et al., 2000) has become an im-portant tool to improve understanding of the role of differ-ent types of ecosystems as sources or sinks for greenhouse gases, with a particular focus on CO2. Datasets gathered by extensive networks such as FLUXNET (Baldocchi et al., 2001), CarboEurope (Valentini et al., 2000) and Ameriflux (Law, 2005) allow studying detailed ecosystem functions across biomes (e.g. Law et al., 2002; Hibbard et al., 2005; Reichstein et al., 2007b; Yuan et al., 2007) and ecosystem responses to climate anomalies and interannual variability (e.g. Wilson et al., 2002; Ciais et al., 2005; Reichstein et al., 2007a), or conducting inverse modeling studies to con-strain carbon fluxes (e.g. Gerbig et al., 2003; Wang et al., 2007). Theoretical assumptions restrict the application of the eddy-covariance technique to conditions that often cannot be strictly observed (e.g. Kaimal and Finnigan, 1994; Lee et al., 2004; Foken, 2006), especially at sites placed in topograph-ically challenging terrain or surrounded by a heterogeneous land cover structure. Therefore, to ensure provision of high quality data for the growing community of flux data users, sophisticated protocols for the processing of eddy-covariance measurements (e.g. Mauder et al., 2006; Papale et al., 2006;
Correspondence to: M. G¨ockede (mathias.goeckede@oregonstate.edu)
Mauder et al., 2007) as well as for quality assessment and quality control (QA/QC, e.g. Foken et al., 2004) have been established.
In most of the studies using eddy-covariance databases on regional to continental scales, each site of the network is used to represent a certain biome type. Since for most sites the scale of horizontal variation is 1 km or less (e.g. Schmid, 2002), a distance that will often be exceeded by the fetch of the flux measurements (e.g. Jegede and Foken, 1999), footprint analyses (e.g. Schuepp et al., 1990; Horst and Weil, 1994; Schmid, 1994; Leclerc et al., 1997; Ran-nik et al., 2000; Kljun et al., 2002) have to be performed to test under which conditions the assumption of spatial rep-resentativeness is valid. It has been demonstrated that land-scape heterogeneity has a significant impact on measurement and interpretation of atmospheric data at a single point in space. Panin et al. (1998) and Panin and Tetzlaff (1999) re-lated energy balance closure problems due to underestima-tion of turbulent fluxes to length scales of landscape inho-mogeneity. Schmid and Lloyd (1999) showed potential er-rors in flux measurements over inhomogeneous terrain due to non-representative footprints, a sensor location bias that had to be taken into account to derive ecosystem scale fluxes from local measurements. In a modeling study, Baldocchi et al. (2005) demonstrated that subgrid scale heterogeneity can alter landscape scale fluxes by up to 300%. Kim et al. (2006) demonstrated the value of flux footprints to scale up flux data from local to landscape scales in order to link terrestrial observations to remote sensing data. G¨ockede et al. (2004) combined a flux data quality assessment approach (Foken et al., 2004) with analytic footprint modeling (Schmid, 1994, 1997) to identify correlations between flux data quality and characteristics of the terrain surrounding the flux site. Their approach was successfully applied by Rebmann et al. (2005) on 18 forest sites of the CARBOEUROFLUX network.
This study presents an update of the study by Rebmann et al. (2005), extending the work to the larger number of 25 CarboEurope-IP sites, which cover a wide range of for-est ecosystems, climate zones, and management regimes. The original site evaluation approach (G¨ockede et al., 2004) has been replaced here by an improved version (G¨ockede et al., 2006) that builds on a more sophisticated Lagrangian Stochastic footprint algorithm (Rannik et al., 2000, 2003) and a more realistic approach to obtain areally-averaged sur-face roughness lengths (Hasager and Jensen, 1999) as input for the model. The extended site evaluation scheme includes (i) a quality assessment of the eddy-covariance fluxes and spatial structures in data quality, (ii) analysis of the spatial representativeness in terms of land cover structure and (iii) assessment of the performance of the applied Planar-Fit co-ordinate rotation procedure (Wilczak et al., 2001). Combi-nation of these measures identifies potential problems con-nected to terrain characteristics and instrumental setup that reduce data quality. Including these findings as quality flags into eddy-covariance databases strengthens data reliability,
Table 1. List of CarboEurope-IP sites participating in this study. Please refer to the site archive on the CarboData webpage (http://gaia. agraria.unitus.it/database/Sites.asp) for more detailed information.
Site Code Site name Location Elevation Dominant species [m a.s.l.]
BE-Vie Vielsalm 50◦180N, 06◦000E 450 Fagus sylvatica, Pseudotsuga menziesii BE-Bra Brasschaat 51◦180N, 04◦310E 16 Pinus sylvestris, Quercus robur CZ-BK1 Bily Kriz 49◦300N, 18◦320E 898 Picea abies
CH-Lae Laegeren 47◦280N, 08◦220E 682 Fagus sylvatica, Picea abies DE-Hai Hainich 51◦040N, 10◦270E 438 Fagus sylvatica
DE-Tha Tharandt 50◦580N, 13◦340E 380 Picea abies DE-Wei Weidenbrunnen 50◦090N, 11◦520E 775 Picea abies DE-Wet Wetzstein 50◦270N, 11◦270E 792 Picea abies DK-Sor Sorø 55◦290N, 11◦380E 40 Fagus sylvatica ES-LMa Las Majadas 39◦570N, 05◦470W 265 Quercus ilex
FI-Hyy Hyyti¨al¨a 61◦510N, 24◦170E 181 Pinus sylvestris, Picea abies FI-Sod Sodankyl¨a 67◦220N, 26◦380E 179 Pinus sylvestris
FR-Hes Hesse 48◦400N, 07◦040E 300 Fagus sylvatica FR-LBr Le Bray 44◦430N, 00◦460W 62 Pinus pinaster FR-Pue Puechabon 43◦440N, 03◦360E 270 Quercus ilex
IL-Yat Yatir 31◦200N, 35◦030E 630 Pinus halepensis IT-Col Collelongo 41◦510N, 13◦350E 1550 Fagus sylvatica IT-Ren Renon 46◦350N, 11◦260E 1735 Picea abies IT-Ro1 Roccarespampani 42◦230N, 11◦510E 120 Quercus cerris
IT-PT1 Parco Ticino 45◦120N, 09◦040E 65 Populus X Euroamericana (Clone I-214) IT-SRo San Rossore 43◦440N, 10◦170E 4 Pinus pinaster
NL-Loo Loobos 52◦100N, 05◦450E 25 Pinus sylvestris PT-Esp Espirra 38◦380N, 08◦360W 95 Eucalyptus globulus PT-Mi1 Mitra II 38◦320N, 08◦000W 220 Quercus ilex, Quercus suber UK-Gri Griffin 56◦370N, 03◦480W 340 Picea sitchensis
allowing the user community to filter out measurements that do not meet the standards required for their specific studies.
2 Data
A total of 25 forested flux measurement sites of the CarboEurope-IP network were analyzed in the context of this study. Site names and main characteristics are listed in Ta-ble 1. Flux data processing for all participating sites followed the concept proposed by Aubinet et al. (2000), which has been further refined by Mauder et al. (2006, 2007). Original flow fields were rotated according to the planar fit method (Wilczak et al., 2001), and subsequently the Moore- (Moore, 1986), Schotanus- (Liu et al., 2001), and WPL-corrections (Webb et al., 1980) were performed. The flux data quality assessment is described in detail in Sect. 3.3. No friction ve-locity threshold (u∗criterion) was applied to filter out mea-surements with low turbulence intensities.
For the 25 sites that participated in this study, on aver-age three months of flux data (minimum two months, maxi-mum five months, Table 2) were provided (76 months of to-tal raw data). The majority of the data (93%, or 71 months)
was sent as raw data files by the cooperating research teams and uniformly processed with the flux processing software at the University of Bayreuth (TK2, Mauder et al., 2008). At the two sites that provided processed fluxes instead of eddy-covariance raw data for this study, data processing protocols exactly matched that of the TK2, ensuring a uniform data processing for the entire study. The average data loss due to gaps in the raw data was 9.2% (minimum 0.3%, maximum 37.6%). For the majority of the sites (14), the data loss due to gaps was below 5%.
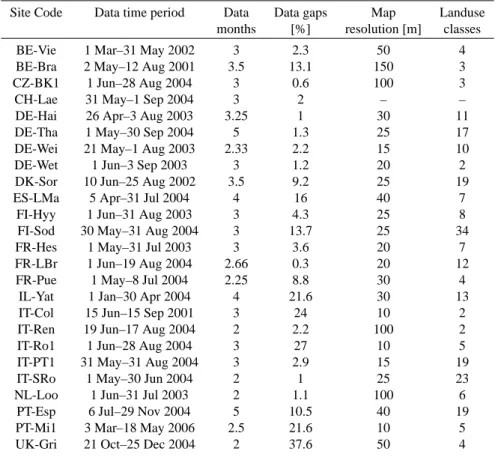
24 out of the 25 participating sites provided the land cover maps required to analyze the spatial representativeness of the eddy-covariance fluxes (for CH-Lae, the land cover map was not compatible with the format needed for this analy-sis). These maps had a mean grid resolution of 40 m (min-imum 10 m, max(min-imum 150 m) and an averaged number of land cover classes of 10 (minimum 2, maximum 34). See Ta-ble 2 for details. The impact of these differences on the site evaluation results presented herein are discussed in Sect. 5.
Table 2. Information on data material provided by the participating CarboEurope-IP sites.
Site Code Data time period Data Data gaps Map Landuse months [%] resolution [m] classes
BE-Vie 1 Mar–31 May 2002 3 2.3 50 4
BE-Bra 2 May–12 Aug 2001 3.5 13.1 150 3
CZ-BK1 1 Jun–28 Aug 2004 3 0.6 100 3
CH-Lae 31 May–1 Sep 2004 3 2 – –
DE-Hai 26 Apr–3 Aug 2003 3.25 1 30 11
DE-Tha 1 May–30 Sep 2004 5 1.3 25 17
DE-Wei 21 May–1 Aug 2003 2.33 2.2 15 10
DE-Wet 1 Jun–3 Sep 2003 3 1.2 20 2
DK-Sor 10 Jun–25 Aug 2002 3.5 9.2 25 19
ES-LMa 5 Apr–31 Jul 2004 4 16 40 7
FI-Hyy 1 Jun–31 Aug 2003 3 4.3 25 8
FI-Sod 30 May–31 Aug 2004 3 13.7 25 34
FR-Hes 1 May–31 Jul 2003 3 3.6 20 7
FR-LBr 1 Jun–19 Aug 2004 2.66 0.3 20 12
FR-Pue 1 May–8 Jul 2004 2.25 8.8 30 4
IL-Yat 1 Jan–30 Apr 2004 4 21.6 30 13
IT-Col 15 Jun–15 Sep 2001 3 24 10 2
IT-Ren 19 Jun–17 Aug 2004 2 2.2 100 2
IT-Ro1 1 Jun–28 Aug 2004 3 27 10 5
IT-PT1 31 May–31 Aug 2004 3 2.9 15 19
IT-SRo 1 May–30 Jun 2004 2 1 25 23
NL-Loo 1 Jun–31 Jul 2003 2 1.1 100 6
PT-Esp 6 Jul–29 Nov 2004 5 10.5 40 19
PT-Mi1 3 Mar–18 May 2006 2.5 21.6 10 5
UK-Gri 21 Oct–25 Dec 2004 2 37.6 50 4
3 Site characterization methodology 3.1 Source area analysis
The footprint algorithm applied for this study builds on the Thomson (1987) LS trajectory model of Langevin type (e.g. Wilson et al., 1983; Wilson and Sawford, 1996), which is operated forward in time. The exact formulation of the foot-print algorithms, the definition of the flow statistics and the effect of stability on the profiles is described in Rannik et al. (2003). For each model run, 5×10⁴ particles were re-leased from a height equal to 0.01 times the canopy height. A flux footprint can be derived by integrating their trajecto-ries up to the upwind distance accounting for approximately 90% of the total flux. To enable footprint analyses based on 30-min averaged fluxes over periods of months for a large number of sites, source weight functions were pre-calculated and stored for more than 10 000 different combinations of measurement height, roughness length and atmospheric sta-bility.
Each 30-min source weight function is projected onto a discrete grid representing the area surrounding the flux tower, with the assigned weighting factors representing the influ-ence of each grid cell to the actual measurement. For each of
these grid cells the land cover type has been defined, so that the land cover composition for the specific measurement can be obtained by summing up the weighting factors sorted by land cover. In a similar manner, quality flags for the eddy-covariance fluxes (see Sect. 3.3) are projected into the area and stored in a database. An overall quality flag per cell can be determined statistically after the complete observation period has been processed (see G¨ockede et al., 2004, 2006, for details), and based on these statistics maps of flux data quality can be produced. The quality measures analyzed in this study are the QA/QC flags for momentum flux, sensible heat flux, latent heat flux, CO2flux, and the mean values of the vertical wind component before and after performing the Planar-Fit rotation (Wilczak et al., 2001). Summing up all 30-min source weight functions yields the relative influence of each part of the surrounding terrain to the fluxes measured, the so-called footprint climatology (Amiro, 1998). These concepts of linking footprint results with flux data attributes are described in detail in G¨ockede et al. (2004, 2006).
3.2 Evaluation of land cover composition within the foot-print
The evaluation of the land cover composition within the foot-print of the measurements is a centerpiece of this study. Each of the sites in networks such as CarboEurope-IP has been set up to monitor a specific type of land cover, or a combina-tion of two or more land cover types, respectively. Flux con-tributions from different land cover types than the specified target introduce a systematic bias to the measurements, al-tering the “true” signal from the target land cover type and thus increasing the scatter in biome intercomparison studies. Therefore, the source area of the fluxes measured has to be known to evaluate how well the measurements represent the specified target land cover. The approach presented herein determines the overall representativeness of a site with re-spect to the specified target land cover type, and identifies possible problematic wind sectors or meteorological situa-tions that fail to produce representative data.
For each of the 30-min averaged fluxes of a processed dataset, our approach determines the flux contribution of the specified target land cover type, and the results are trans-ferred to a database. Based on this information, individual thresholds for a minimum required flux contribution can be defined for different studies to filter out measurements failing to meet that requirement. After intensive pre-analyses, we found the following classification into four groups the most practicable to characterize individual 30-min measurements and facilitate the overall site evaluation:
– Homogeneous measurements: 95% or more of the flux are emitted by the specified target land cover type. Sys-tematic bias by flux contributions from other land cover types is negligible. Sites with a high percentage of ho-mogeneous measurements reliably represent their spec-ified target land cover type, and are thus ideal for across-biome studies.
– Representative measurements: 80 to 95% of the flux are emitted by the target land cover type. We chose the 80%-threshold to limit possible disturbing influences of non-target land cover types on the measured fluxes to a low level. At the same time, the threshold is relaxed enough to acknowledge the fact that the vast majority of FLUXNET sites has to deal with heterogeneous land cover structures to a certain degree, and ideal homo-geneity in the fetch is very rare.
– Acceptable measurements: 50 to 80% flux contribution are emitted by the target land cover type. Though still dominant, the fluxes from the target areas are diluted significantly. Use for across-biome studies is not rec-ommended, but may be valid depending on study ob-jectives.
– Disturbed measurements. Less than 50% flux contri-bution from the target land cover type. These
mea-surements are dominated by flux contributions which, strictly speaking, should be regarded as disturbances. These data are therefore not valid for across-biome stud-ies.
Using the above categories, the sites within a flux network can be grouped according to the usefulness of a footprint fil-ter to assure the representativeness of the measurement data for the specified target land cover type (see Sect. 4.1). 3.3 Flux data quality assessment
All fluxes were checked for their quality according to a scheme proposed by Foken and Wichura (1996) in the re-vised version as presented by Foken et al. (2004). These tests are based on the analysis of high-frequency raw data of ver-tical and longitudinal wind components, air temperature, and water- and CO2-concentrations. Quality ratings assigned for stationarity of the flow and the development of the turbulent flow field (using the so-called integral turbulence characteris-tics) are combined to yield the overall quality flag of the data, with individual results for the fluxes of momentum, sensible and latent heat, and CO2. The deviation of the mean vertical wind component from zero forms a separate quality measure. The stationarity of the flow is tested by comparing 30-min covariances with the linear average of six 5-min covariances obtained for the same period (Foken and Wichura, 1996). Good agreement between both values indicates stationary conditions, e.g. deviations lower than 15 percent are rated with flag 1 (Foken et al., 2004).
Integral turbulence characteristics are based on the flux-variance similarity (e.g. Obukhov, 1960; Wyngaard et al., 1971), and can be expressed as functions of stability of strat-ification (Panofsky et al., 1977; Foken et al., 1991) in case of undisturbed turbulence (Kaimal and Finnigan, 1994; Arya, 2001). To use them as a measure of flux data quality, values parameterized with standard functions (Thomas and Foken, 2002) are compared to the measurement results. Close agree-ment between both values indicates a well developed turbu-lent flow field, resulting in a good quality rating (e.g. differ-ences are lower than 15% for class 1). Deviations, which may be caused by disturbances in the turbulent flow field like obstacles in the fetch or flow distortion caused by the instrument setup, are penalized by lower quality flags (differ-ences for class 9 are >1000%). Specifics on the classification are given in Foken et al. (2004). In the study presented, in-tegral turbulence characteristics are only considered for the horizontal and vertical wind components, since for the tem-perature scalar, the parameterization (Foken et al., 2004) is only valid for unstable stratification, and no valid parameter-izations exist for the water vapor and CO2scalars (see also Rebmann et al., 2005; G¨ockede et al., 2006).
Details on the combination of the ratings for stationar-ity and integral turbulence characteristics to form the over-all flux quality rating is given in Foken et al. (2004). Qual-ity flags range on a scale from one (best) to nine (worst) to
1 2 3 4 5 6 7 8 9
Distance East - West [m]
-400 0 400 800 D is ta n c e N o rt h S o u th [ m ] -400 0 400 800 + 5 10 20 30 40
Distance East - West [m]
-400 0 400 800 D is ta n c e N o rt h S o u th [ m ] -400 0 400 800
Distance East - West [m]
-400 0 400 800 D is ta n c e N o rt h S o u th [ m ] -400 0 400 800 + 5 10 20 30 40 N N
Fig. 1. Quality rating of the momentum flux during stable strat-ification (z/L>0.0625; z: measurement height [m]; L: Obukhov length [m]) at the Wetzstein site (DE-Wet). Colors show the me-dian data quality for each grid cell of the terrain matrix (1=best). The three-dimensional accumulated source weight function is indi-cated by the white lines. Values are in percentages to the peak of the function, with solid lines ranging from 90% to 10%, and the dashed line as 5% of the maximum. High values indicate a high relative contribution of the specific area to the fluxes measured in the given observation period. Distances to the tower position (red cross) are given in [m].
each flux measurement. As a short guideline, fundamental research should be restricted to measurements with the high-est data quality (classes one to three), while classes four to six indicate good quality, and data can be used for calculating solid averages or long-term budgets of the exchange fluxes. Classes seven and eight may be included for averaging pur-poses at the user’s discretion, but should be checked with care for plausibility because of significant deviations from the basic theoretical assumptions for the eddy-covariance tech-nique. Measurements rated with quality class nine should be discarded in any case. This classification does not include a test for the presence of advective fluxes, which can act as a large selective systematic error in the measurements and in-troduce large uncertainties into long-term budgets in addition to small errors in half-hourly measurements.
3.4 Spatial structures in the data quality flags
Based on the footprint results, this approach links the qual-ity flags for momentum flux, sensible and latent heat fluxes, and CO2 flux with characteristics of the surrounding ter-rain. Comparison of spatial structures in the data quality be-tween individual sites is not straightforward, since local ter-rain characteristics and climate conditions may vary signifi-cantly. To facilitate an overall evaluation and allow site inter-comparisons, we differentiate between three kinds of spatial
effects in the data quality: isolated effects, multidirectional effects and instrumental effects. The abundance of each of those effects can be used for site classification (see Sect. 4.2). Isolated effects on the data quality consist of a narrow wind sector with reduced data quality in an otherwise high-quality region of the map. Usually, due to the restriction to a specific wind direction and stability regime, the total num-ber of lower-quality measurements is rather low, so that they could easily be overlooked if not coupled to footprint results as done in this approach. A perfect example for an isolated effect in the data quality was found for the Wetzstein site (DE-Wet, Fig. 1). This site received an outstanding overall quality rating for all fluxes, except for a narrow wind sector around 110◦where the quality of all four fluxes analyzed was significantly reduced during stable to neutral stratification. In this case, the effect can most probably be attributed to flow distortion induced by the instrumentation setup, as it occurs independent of the type of flux. However, since wind direc-tion from this sector is very rare at the Wetzstein site (1.8% for 2002–2006 for 105–115◦over all stability regimes), this effect does not have a significant impact on the overall site performance.
For multidirectional effects, the median data quality is sig-nificantly lower than average for a specific stability of stratifi-cation or flux. In contrast to the isolated effect, a reduced data quality is found for several wind sectors, or is observed in-dependent of the wind direction. Multidirectional effects are in most cases caused by instrumentation effects or regional flow patterns, rather than by the local scale characteristics of the surrounding terrain. A very good example for the identi-fication of an multidirectional effect on the data quality was found for the Danish Sorø site (DK-Sor). At Sorø, all fluxes analyzed were of very good overall quality independent of the stability of stratification, except of the latent heat flux during stable stratification (Fig. 2). Since also the CO2flux was not affected by this reduction in data quality, both terrain influences and general instrumental problems of infra-red gas analyzer (IRGA) or sonic anemometer can be ruled out as a possible cause of the problem. One plausible explanation is that the tubing of the closed-path IRGA system affects water vapor transport to the sensor during nighttime measurements (see also Ibrom et al., 2007), altering the quality of the la-tent heat flux, but not of the CO2flux. Other multidirectional effects identified in the context of this study were caused by extreme low turbulence intensities during stable stratification which did not pass the test for a well-developed turbulent flow field (FI-Hyy), or by a regional wind climatology with channeled flow that covered certain wind sectors only dur-ing transitional periods with non stationary flow conditions (CH-Lae, ES-LMa).
Instrumental effects are identified by obvious spatial struc-tures in the maps of median data quality that can be corre-lated to the geometry of the installed sensors. In the context of this study, all such effects found were related to the sonic anemometers, while no general data quality effect could be
1 2 3 4 5 6 7 8 9
Distance East - West [m]
-800 -400 0 400 800 D is ta n c e N o rt h S o u th [ m ] -400 0 400 + 5 10 20 30
Distance East - West [m]
-800 -400 0 400 800 D is ta n c e N o rt h S o u th [ m ] -400 0 400
Distance East - West [m]
-800 -400 0 400 800 D is ta n c e N o rt h S o u th [ m ] -400 0 400 + 5 10 20 30
N
N
Distance East - West [m]
-800 -400 0 400 800 D is ta n c e N o rt h S o u th [ m ] -400 0 400 + 5 10 20 30
Distance East - West [m]
-800 -400 0 400 800 D is ta n c e N o rt h S o u th [ m ] -400 0 400
Distance East - West [m]
-800 -400 0 400 800 D is ta n c e N o rt h S o u th [ m ] -400 0 400 + 5 10 20 30
N
N
Fig. 2. Comparison of the spatial data quality of the latent heat flux (left panel) and the CO2flux (right panel) during stable stratification at
the Sorø site (DK-Sor). See legend of Fig. 1 for map details.
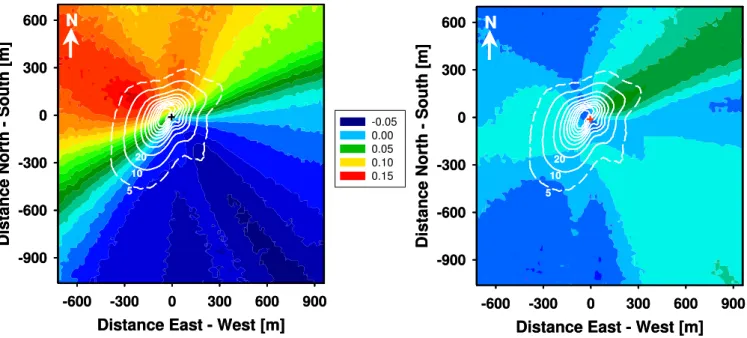
linked to the IRGAs. As an example, Fig. 3 shows the data quality map for the latent heat flux during stable stratifica-tion at Sodankyl¨a (FI-Sod), where a METEK USA1 sonic anemometer is installed. For this site, during stable strat-ification quality maps for all fluxes were structured into 3 sectors of 120 degrees each, with good data quality in the north, east-southeast and southwest, and a reduced quality in between. These results indicate that there is a flow distor-tion induced by geometry of the METEK USA1 sensor head, slightly compromising the quality of the measurements. 3.5 Evaluation of the Planar-Fit coordinate rotation method For this study, we applied the Planar-Fit coordinate rotation method (Wilczak et al., 2001) for all sites to adapt the ori-entation of the measured wind regime to the requirements of eddy-covariance flux data processing (e.g. a mean vertical wind velocity of zero). Only one set of coordinate rotation angles was applied at each site to avoid systematic errors in long-term mass balances introduced by transient horizontal flux divergences below the sensor height for sensors mounted above tall canopies (Finnigan et al., 2003). Consequently, in many cases the rotated mean vertical wind velocity still devi-ates from the ideal value of zero in some of the wind sectors, because the vertical wind field is often curved instead of be-ing an ideal plane. For a detailed analysis of individual sites, maps of the mean vertical wind velocity before and after ro-tation can be compared to evaluate the performance of the Planar-Fit method. In the example of the Hesse site (FR-Hes, Fig. 4), the tilted unrotated wind field (maximum mean ver-tical velocity 0.15 m s−1)was rotated into a balanced plane with absolute residues below 0.03 m s−1. For site intercom-parison, the maximum absolute value of the vertical wind ve-locity after rotation can be used to evaluate the performance of the Planar-Fit coordinate rotation method.
1 2 3 4 5 6 7 8 9
Distance East - West [m]
-300 0 300 600 D is ta n c e N o rt h S o u th [ m ] -600 -300 0 300 + 5 10 20 N 30
Distance East - West [m]
-300 0 300 600 D is ta n c e N o rt h S o u th [ m ] -600 -300 0 300 + 5 10 20 N N 30
Fig. 3. Quality evaluation of the latent heat flux during stable strati-fication for the Sodankyl¨a site. See legend of Fig. 1 for map details.
4 Results for the CarboEurope-IP network
4.1 Representativeness for the specified target land cover We analyzed the representativeness for the specified land cover type for 24 forested CarboEurope sites. Please note that while the classification of individual 30-min averages follows the scheme proposed in Sect. 3.2, for the overall site evaluation it has to be determined what percentage of the to-tal dataset exceeds one of those thresholds, which can be cho-sen by the user. Three of those thresholds were tested herein. The vast majority (for most sites all) of the 30-min mea-surements analyzed in this study were dominated by flux emitted from the specified target land cover type (flux con-tribution of a 30-min averaged flux >50%). The maximum
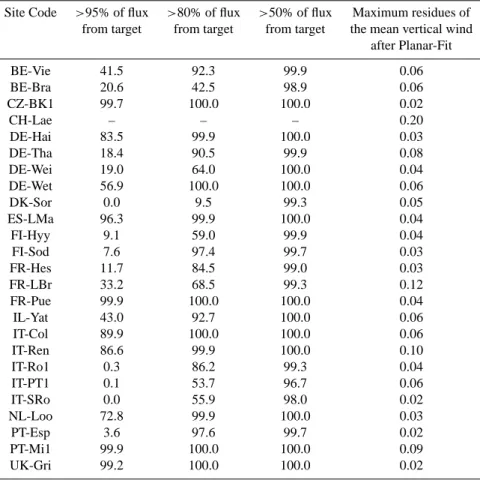
Table 3. Representativeness results for the specified target land cover type. Values indicate the percentage of 30-min measurements for each site that fall within each of the three categories shown.
Site Code >95% of flux >80% of flux >50% of flux Maximum residues of from target from target from target the mean vertical wind
after Planar-Fit BE-Vie 41.5 92.3 99.9 0.06 BE-Bra 20.6 42.5 98.9 0.06 CZ-BK1 99.7 100.0 100.0 0.02 CH-Lae – – – 0.20 DE-Hai 83.5 99.9 100.0 0.03 DE-Tha 18.4 90.5 99.9 0.08 DE-Wei 19.0 64.0 100.0 0.04 DE-Wet 56.9 100.0 100.0 0.06 DK-Sor 0.0 9.5 99.3 0.05 ES-LMa 96.3 99.9 100.0 0.04 FI-Hyy 9.1 59.0 99.9 0.04 FI-Sod 7.6 97.4 99.7 0.03 FR-Hes 11.7 84.5 99.0 0.03 FR-LBr 33.2 68.5 99.3 0.12 FR-Pue 99.9 100.0 100.0 0.04 IL-Yat 43.0 92.7 100.0 0.06 IT-Col 89.9 100.0 100.0 0.06 IT-Ren 86.6 99.9 100.0 0.10 IT-Ro1 0.3 86.2 99.3 0.04 IT-PT1 0.1 53.7 96.7 0.06 IT-SRo 0.0 55.9 98.0 0.02 NL-Loo 72.8 99.9 100.0 0.03 PT-Esp 3.6 97.6 99.7 0.02 PT-Mi1 99.9 100.0 100.0 0.09 UK-Gri 99.2 100.0 100.0 0.02
percentage of measurements with target area flux contribu-tions lower than 50% in the dataset for an individual site was 3.3%. However, application of this threshold is not suitable for an overall site evaluation, because with a possible 49% of flux emitted by other sources there is still a significant source of uncertainty that might compromise the representativeness. Checking for the most rigid quality measure, the test for homogeneous source areas (95% or more of the flux is emit-ted by the target land cover type), we found that 10 of the 24 sites had 50% or more of their 30-min measurements falling into this category. These sites, which perfectly represent their specified target land cover type, are FR-Pue (99.9%), PT-Mi1 (99.9%), CZ-BK1 (99.7%), UK-Gri (99.2%), ES-LMa (96.3%), IT-Col (89.9%), IT-Ren (86.6%), DE-Hai (83.5%), NL-Loo (72.8%), and DE-Wet (56.9%). Values in brackets give the percentage of 30-min measurements with homoge-neous source area compositions (see also Table 3).
The most suitable threshold defined in Sect. 3.2 to per-form an overall site evaluation is the percentage of 30-min measurements exceeding the threshold of 80% flux contribu-tion from the target land cover type (representative measure-ments). For a better overview of the results, we grouped the
24 sites into four different categories according to the per-centage of representative measurements in the total dataset. See also Table 3 for details.
– 90% or more of data exceed 80%-threshold: 15 sites (BE-Vie, CZ-BK1, DE-Hai, DE-Tha, DE-Wet, ES-LMa, FI-Sod, FR-Pue, IL-Yat, IT-Col, IT-Ren, NL-Loo, PT-Esp, PT-Mi1, UK-Gri). These sites represent their specified target land cover type very well. The measure-ments could be used without additional footprint filters, as the influence of disturbing heterogeneities is very low. Note that the 10 “homogeneous” sites listed above all have 99.9% or more of the 30-min averaged data ex-ceeding the threshold for representative measurements. – 60% to 90% of data exceed 80% threshold: 4 sites (DE-Wei, FR-Hes, FR-LBr, IT-Ro1). For these sites, a footprint analysis is recommended to filter the data which are provided for the CarboEurope-IP database. With a considerable percentage of measure-ments not truly representative for the target land cover type, an additional footprint flag indicating the flux
-0.05 0.00 0.05 0.10 0.15
Distance East - West [m]
-600 -300 0 300 600 900
D
is
ta
n
c
e
N
o
rt
h
S
o
u
th
[
m
]
-900 -600 -300 0 300 600 + 5 10 20N
Distance East - West [m]
-600 -300 0 300 600 900
D
is
ta
n
c
e
N
o
rt
h
S
o
u
th
[
m
]
-900 -600 -300 0 300 600 + 5 10 20N
N
Distance East - West [m]
-600 -300 0 300 600 900
D
is
ta
n
c
e
N
o
rt
h
S
o
u
th
[
m
]
-900 -600 -300 0 300 600 + 5 10 20N
Distance East - West [m]
-600 -300 0 300 600 900
D
is
ta
n
c
e
N
o
rt
h
S
o
u
th
[
m
]
-900 -600 -300 0 300 600 + 5 10 20N
N
Fig. 4. Mean vertical wind component determined for the Hesse site (FR-Hes) before (left panel) and after (right panel) performing the Planar-Fit coordinate rotation. Colors give the vertical wind component in [m s−1], with the same color scales were used for both graphs.
contribution from the target land cover type will signif-icantly strengthen the data for further use.
– 50% to 60% of data exceed the 80% threshold: 3 sites (FI-Hyy, IT-PT1, IT-SRo). Most measurements are still representative for the target land cover type, but small scale heterogeneities close to the tower that slightly influence the measurements during all stratifica-tion cases reduce the flux percentage of the target land cover type. During stable stratification, short fetches in one or several wind sectors lead to a large influence of non-target land cover types. These datasets need a detailed footprint analysis before uploading into the database.
– Less than 50% of data exceed the 80% threshold: 2 sites (BE-Bra, DK-Sor). The representativeness of these sites for the specified target land cover types is signifi-cantly reduced, due to various reasons. Details on these sites are listed further below.
For Brasschaat (BE-Bra, Fig. 5), the percentage of measure-ments exceeding the 80% threshold of flux contribution from the target land cover (forest) is only 42.5%. However, the general situation is similar to the three sites listed in the third category above (50–60% of representative data), with a small scale heterogeneity close to the tower, but significant reductions of the representativeness only to be found during stable stratification. However, the fetch is extremely short, especially in the main wind direction around the west. Mea-surements during stable stratification should generally be dis-carded except for easterly winds. Application of a footprint
filter based on the results by Rebmann et al. (2005) at this site increased the contribution of the target vegetation to >90% (Nagy et al., 2006). Because stable stratification is predomi-nantly a nighttime phenomenon at this site, the footprint filter strongly affected the nighttime fluxes (on average more than 10% reduction), while it had virtually no effect on the day-time fluxes.
Two major factors compromise the representativeness of the Sorø (DK-Sor, Fig. 6) data for the target land cover type deciduous forest: First, the deciduous forest is interspersed by a large number of small heterogeneities such as other for-est types or grassland patches, and second the fetch is rather short especially in the main wind directions to the east and to the west. Consequently, only 9.5% of all measurements ex-ceed the threshold of 80% flux contribution from the target land use type (however, still 99.3% exceed the threshold of 50%). These results have to be interpreted with care, since the wind climatology within the 21/2month period in sum-mer 2002 used for this study has more pronounced maxima to the east and west than usually found at this site. In addi-tion, most of the large grassland patches, or clearings, within the forest, have characteristics very close to those of the tar-get land cover type deciduous forest. A more representative wind climatology and inclusion of the clearings into the tar-get area would lead to a significant increase of measurements truly representative for the specified target land cover type. Since the quite detailed land cover map provided for this site may have biased the results, a different treatment of the land cover data may change the representativeness of the flux data significantly. The footprint issue for this site has previously been dealt with by Dellwik and Jensen (2000, 2005).
Distance East - West [m] -900 -600 -300 0 300 600 900 D is ta n c e N o rt h S o u th [ m ] -1200 -900 -600 -300 0 300 600 900 + 510 20 N
Distance East - West [m]
-900 -600 -300 0 300 600 900 D is ta n c e N o rt h S o u th [ m ] -1200 -900 -600 -300 0 300 600 900 + 510 20 N N
Distance East - West [m]
-900 -600 -300 0 300 600 900 D is ta n c e N o rt h S o u th [ m ] -1200 -900 -600 -300 0 300 600 900 + 5 N
Distance East - West [m]
-900 -600 -300 0 300 600 900 D is ta n c e N o rt h S o u th [ m ] -1200 -900 -600 -300 0 300 600 900 + 5 N N
Distance East - West [m]
-900 -600 -300 0 300 600 900 D is ta n c e N o rt h S o u th [ m ] -1200 -900 -600 -300 0 300 600 900 + 5 10 20 N
Distance East - West [m]
-900 -600 -300 0 300 600 900 D is ta n c e N o rt h S o u th [ m ] -1200 -900 -600 -300 0 300 600 900 + 5 10 20 N N
Distance East - West [m]
-900 -600 -300 0 300 600 900 D is ta nc e N or th - S out h [ m ] -1200 -900 -600 -300 0 300 600 900 + 5 10 20 N 30
Distance East - West [m]
-900 -600 -300 0 300 600 900 D is ta nc e N or th - S out h [ m ] -1200 -900 -600 -300 0 300 600 900 + 5 10 20 N N 30
other
forest
settlement
all
unstable
stable
neutral
Distance East - West [m]
-900 -600 -300 0 300 600 900 D is ta nc e N or th - S out h [ m ] -1200 -900 -600 -300 0 300 600 900 + 510 20 N
Distance East - West [m]
-900 -600 -300 0 300 600 900 D is ta nc e N or th - S out h [ m ] -1200 -900 -600 -300 0 300 600 900 + 510 20 N N
Distance East - West [m]
-900 -600 -300 0 300 600 900 D is ta nc e N o rt h S out h [ m ] -1200 -900 -600 -300 0 300 600 900 + 5 N
Distance East - West [m]
-900 -600 -300 0 300 600 900 D is ta nc e N o rt h S out h [ m ] -1200 -900 -600 -300 0 300 600 900 + 5 N N
Distance East - West [m]
-900 -600 -300 0 300 600 900 D is ta nc e N o rt h S out h [ m ] -1200 -900 -600 -300 0 300 600 900 + 5 10 20 N
Distance East - West [m]
-900 -600 -300 0 300 600 900 D is ta nc e N o rt h S out h [ m ] -1200 -900 -600 -300 0 300 600 900 + 5 10 20 N N
Distance East - West [m]
-900 -600 -300 0 300 600 900 D is ta nc e N or th - S out h [ m ] -1200 -900 -600 -300 0 300 600 900 + 5 10 20 N 30
Distance East - West [m]
-900 -600 -300 0 300 600 900 D is ta nc e N or th - S out h [ m ] -1200 -900 -600 -300 0 300 600 900 + 5 10 20 N N 30
other
forest
settlement
all
unstable
stable
neutral
Fig. 5. Footprint climatologies and land cover maps for the Brasschaat site (BE-Bra). Background colors indicate the land cover structure surrounding the tower. Panels give footprint climatologies for all cases (top left), unstable (top right), neutral (bottom left) and stable (bottom right) stratification. See legend of Fig. 1 for further map details.
Sites that have “footprint problems”, i.e. a high percent-age of flux contributions emitted from outside their defined target land cover type, can however be used without restric-tions in applicarestric-tions where the exact source of the fluxes is not important. Studies like that could include for example the analysis of interannual variability, monitoring of distur-bances effects, and parameterization and validation of mod-els with a low horizontal resolution compared to the footprint of the measurements.
4.2 Evaluation of spatial structures in flux data quality For a general overview of average data qualities assigned by the Foken et al. (2004) approach, Fig. 7 presents the
fre-quency distributions of the median data quality found for the 25 sites involved in this study. Please note that due to software related problems, the CO2flux for the site ES-LMa could not be evaluated in the context of this study, so only 24 sites are considered for the distributions of median data quality for CO2in Fig. 7.
For most of the spatial maps of the momentum flux data quality, the quality ratings were in the excellent range be-tween classes 1 and 3, indicating no significant disturbance effects on the measurements. For all sites, no significant reduction (mean QC flag greater than 6) of the data qual-ity was observed during unstable and neutral stratification. We found isolated effects during stable stratification for three of the sites (DE-Wet, FI-Sod, PT-Mi1), and multidirectional
Distance East - West [m] -800 -400 0 400 800 D is ta n c e N o rt h S o u th [ m ] -400 0 400 + 5 10 20
N
Distance East - West [m]
-800 -400 0 400 800 D is ta n c e N o rt h S o u th [ m ] -400 0 400 + 5 10 20
Distance East - West [m]
-800 -400 0 400 800 D is ta n c e N o rt h S o u th [ m ] -400 0 400 + 5 10 20
N
N
Distance East - West [m]
-800 -400 0 400 800 D is ta n c e N o rt h S o u th [ m ] -400 0 400 + 5 10
Distance East - West [m]
-800 -400 0 400 800 D is ta n c e N o rt h S o u th [ m ] -400 0 400 + 5 10
Distance East - West [m]
-800 -400 0 400 800 D is ta n c e N o rt h S o u th [ m ] -400 0 400
Distance East - West [m]
-800 -400 0 400 800 D is ta n c e N o rt h S o u th [ m ] -400 0 400 + 5 10
N
N
Distance East - West [m]
-800 -400 0 400 800 D is ta n c e N o rt h S o u th [ m ] -400 0 400 + 5 10 20
Distance East - West [m]
-800 -400 0 400 800 D is ta n c e N o rt h S o u th [ m ] -400 0 400 + 5 10 20
Distance East - West [m]
-800 -400 0 400 800 D is ta n c e N o rt h S o u th [ m ] -400 0 400
Distance East - West [m]
-800 -400 0 400 800 D is ta n c e N o rt h S o u th [ m ] -400 0 400 + 5 10 20
N
N
Distance East - West [m]
-800 -400 0 400 800 D ist an ce N o rt h S o u th [ m ] -400 0 400 + 5 10 20 30
Distance East - West [m]
-800 -400 0 400 800 D ist an ce N o rt h S o u th [ m ] -400 0 400 + 5 10 20 30
Distance East - West [m]
-800 -400 0 400 800 D ist an ce N o rt h S o u th [ m ] -400 0 400
Distance East - West [m]
-800 -400 0 400 800 D ist an ce N o rt h S o u th [ m ] -400 0 400 + 5 10 20 30
N
N
deciduous
coniferous
grassland
high crops
low crops
all
unstable
stable
neutral
Distance East - West [m]
-800 -400 0 400 800 D ist an ce N o rt h S o u th [ m ] -400 0 400 + 5 10 20
N
Distance East - West [m]
-800 -400 0 400 800 D ist an ce N o rt h S o u th [ m ] -400 0 400 + 5 10 20
Distance East - West [m]
-800 -400 0 400 800 D ist an ce N o rt h S o u th [ m ] -400 0 400 + 5 10 20
N
N
Distance East - West [m]
-800 -400 0 400 800 D ist an c e N o rt h S o u th [ m ] -400 0 400 + 5 10
Distance East - West [m]
-800 -400 0 400 800 D ist an c e N o rt h S o u th [ m ] -400 0 400 + 5 10
Distance East - West [m]
-800 -400 0 400 800 D ist an c e N o rt h S o u th [ m ] -400 0 400
Distance East - West [m]
-800 -400 0 400 800 D ist an c e N o rt h S o u th [ m ] -400 0 400 + 5 10
N
N
Distance East - West [m]
-800 -400 0 400 800 D is tan ce N o rt h S o u th [ m ] -400 0 400 + 5 10 20
Distance East - West [m]
-800 -400 0 400 800 D is tan ce N o rt h S o u th [ m ] -400 0 400 + 5 10 20
Distance East - West [m]
-800 -400 0 400 800 D is tan ce N o rt h S o u th [ m ] -400 0 400
Distance East - West [m]
-800 -400 0 400 800 D is tan ce N o rt h S o u th [ m ] -400 0 400 + 5 10 20
N
N
Distance East - West [m]
-800 -400 0 400 800 D ist an ce N o rt h S o u th [ m ] -400 0 400 + 5 10 20 30
Distance East - West [m]
-800 -400 0 400 800 D ist an ce N o rt h S o u th [ m ] -400 0 400 + 5 10 20 30
Distance East - West [m]
-800 -400 0 400 800 D ist an ce N o rt h S o u th [ m ] -400 0 400
Distance East - West [m]
-800 -400 0 400 800 D ist an ce N o rt h S o u th [ m ] -400 0 400 + 5 10 20 30
N
N
deciduous
coniferous
grassland
high crops
low crops
all
unstable
stable
neutral
Fig. 6. Footprint climatologies and land cover maps for the Sorø site (DK-Sor). See legend of Fig. 5 for further map details.
reduction of overall data quality during stable stratification for three more sites (ES-LMa, FI-Hyy, FR-Pue).
The average data quality for the sensible heat flux was found to be lower than for the momentum flux, mainly due to a failed stationarity test for the temperature measurements. For 13 sites (BE-Bra, DE-Hai, DE-Wet, ES-LMa, FR-Hes, FR-LBr, FR-Pue, IT-Ren, IT-Ro1, IT-SRo, NL-Loo, PT-Mi1, UK-Gri), isolated effects were observed that occurred dur-ing one or two stability regimes. Since all stability regimes are affected, these effects are likely to be caused by hetero-geneities in the source strength of the sensible heat flux in the surrounding area, instead of systematic errors in e.g. in-strument setup, flux processing or quality flag assignment. Three more sites experienced a multidirectional reduction of the sensible heat flux data quality, two of those during sta-ble stratification (FI-Hyy, IT-Col), and one (CH-Lae) during neutral stratification.
For the latent heat flux, overall data quality was frequently found to be only moderate (classes 3 to 6). For four sites,
isolated disturbances were observed (DE-Wet, ES-LMa, FI-Sod, IT-SRo), most of those (except IT-SRo) restricted to a single stability class. Multidirectional reduction in data qual-ity occurred mostly during stable stratification at 11 sites (CH-Lae, CZ-BK1, DK-Sor, FI-Hyy, FR-LBr, FR-Pue, IT-Col, IT-Ren, IT-Ro1, PT-Mi1, UK-Gri). For two of these sites, the data quality was significantly reduced for all strat-ification regimes: CH-Lae, which is situated on a mountain slope, and UK-Gri for which wintertime data were analyzed. The observed patterns suggest that reduced data quality of the latent heat flux can be attributed to a large extent to mea-surement problems such as water in the tubing systems of closed-path IRGAs, or open-path analyzers with liquid pre-cipitating on the windows of the measurement path during rain or fog events, while terrain effects only play a minor role. A reduction of tubing length and regular cleaning of the tubing can help to improve the quality for closed-path systems.
0 5 10 15 20 25 1 2 3 4 5 6 7 8 9
Median data quality of momentum flux
N u m b e r o f s it e s 0 5 10 15 20 25 1 2 3 4 5 6 7 8 9
Median data quality of sensible heat flux
N u m b e r o f s it e s 0 5 10 15 20 25 1 2 3 4 5 6 7 8 9
Median data quality of latent heat flux
N u m b e r o f s it e s 0 5 10 15 20 25 1 2 3 4 5 6 7 8 9
Median data quality of CO2 flux
N u m b e r o f s it e s
Fig. 7. Frequency distribution of the median of the data quality for four different fluxes measured at the 25 forest sites participating in this study.
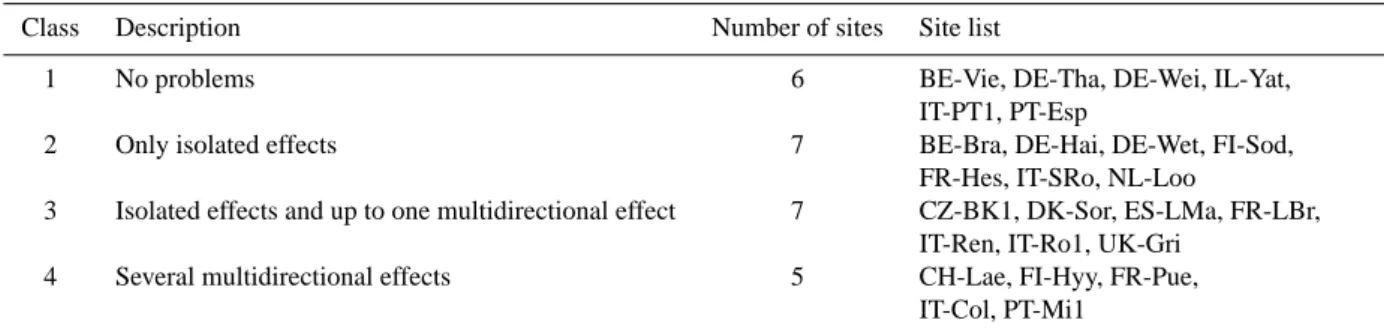
Table 4. Integrated classification of spatial effects in the data quality.
Class Description Number of sites Site list
1 No problems 6 BE-Vie, DE-Tha, DE-Wei, IL-Yat,
IT-PT1, PT-Esp
2 Only isolated effects 7 BE-Bra, DE-Hai, DE-Wet, FI-Sod,
FR-Hes, IT-SRo, NL-Loo
3 Isolated effects and up to one multidirectional effect 7 CZ-BK1, DK-Sor, ES-LMa, FR-LBr, IT-Ren, IT-Ro1, UK-Gri
4 Several multidirectional effects 5 CH-Lae, FI-Hyy, FR-Pue, IT-Col, PT-Mi1
The overall data quality of the CO2flux was mostly found to be good to very good (classes 1 to 3). For five sites (DE-Wet, FR-Hes, FR-LBr, IT-SRo, UK-Gri), isolated ef-fects were detected that reduced the data quality in one or two stratification regimes. Multidirectional problems were found at three sites (CH-Lae, FI-Hyy, PT-Mi1). Possible ex-planations for the reduced data quality in these cases include steep topography and channeled flow (CH-Lae) or high fre-quency of occurrence of low turbulence intensities (FI-Hyy). As for the sensible heat flux, data quality of the CO2 flux seems to be influenced mostly by smaller scale variations of source strength in the surrounding terrain, while sensor prob-lems play a minor role.
Instrumental effects on the spatial structures of data qual-ity were only observed for the two sites that used METEK USA1 sonic anemometers, FI-Sod and IT-Roc (all other sites installed Gill instruments). In the case of FI-Sod, all quality maps were clearly structured into 3 sectors with 120 degrees each during stable stratification (see Fig. 1 for details), with the strongest distinction between the sectors found for latent heat flux and CO2 flux. At the IT-Roc site, the influence of the sonic structures could clearly be observed in the spa-tial structures of the averaged vertical wind component after applying the Planar-Fit coordinate rotation method. Both re-sults indicate that the geometry of the METEK USA1 sensor head influences the wind field, which may have an effect on the data quality under certain conditions. The problem may
be caused by an ineffective head correction (Mauder et al., 2007).
To facilitate a site intercomparison and overall network evaluation, the results for the four different fluxes and the instrumental effects listed above can be integrated into four major categories (Table 4).
4.3 Results of the Planar-Fit coordinate rotation method The frequency distribution of the maximum value of the re-maining residues after performing the rotation is displayed in Fig. 8. The results demonstrate that the application of the Planar-Fit coordinate rotation method was successful in the majority of the cases. For 20 of the 25 sites, the maximum of the residue of the mean vertical wind velocity did not ex-ceed the threshold of 0.06 m/s. As for most of those cases the area with the maximum residue was restricted to a very small part of the terrain covered by the accumulated source weight function, the total effect of these deviations from the ideal value of zero should be insignificant for the flux processing.
For three of the sites analyzed, Planar-Fit could not pro-vide a rotated flow field with residues low enough to be con-sidered insignificant (vertical velocity residue >=0.10 m s−1, CH-Lae, FR-LBr, IT-Ren), and two more sites (DE-Tha, PT-Mi1) were close to that threshold. In all cases, the distortion of the streamlines of the averaged flow cannot be removed with a single set of coordinate angles. For two of those sites (CH-Lae, IT-Ren), this is a consequence of complex moun-tainous terrain, and also for DE-Tha the curved streamlines in a narrow wind sector to the east of the tower can be at-tributed to the hilly topography. For FR-LBr, the distorted streamlines are caused by steep gradients in surface rough-ness due to a significant step change in vegetation height such as a forest edge close to the tower position. In the case of the PT-Mi1 site which is situated in rather open savanna forest, possible explanations include a distortion of the wind field by individual trees close to the tower, or a flow distortion by the inlet tube of the IRGA system which partly obstructs the sonic anemometer in the disturbed wind sectors.
5 Discussion
Interpretation of the results has to consider that G¨ockede et al. (2006) developed their site evaluation approach as a prac-tical and easy-to-use tool that allows to conduct extensive network studies as presented in this study. With an aver-age of close to 4000 Lagrangian Stochastic footprints to be calculated for each of the 25 participating sites, generaliza-tions like the use of pre-calculated source weight funcgeneraliza-tions had to be adopted to reduce processing time. Consequently, adapting the flow statistics for the footprint computation to specific characteristics of the individual sites was not possi-ble in the context of this study. Since any footprint model can only be as good as the description of the underlying
tur-0 1 2 3 4 5 6 7 0.01 0.02 0.03 0.04 0.05 0.06 0.07 0.08 0.09 >=0.1
vertical velocity residue [m/s]
n u m b e r o f s it e s
Fig. 8. Frequency of occurrence of the maximum residues of the mean vertical wind velocity after performing the Planar-Fit coor-dinate rotation method. Values for individual sites are included in Table 3.
bulent flow conditions, this simplification introduces addi-tional scatter into the results (e.g. G¨ockede et al., 2007). The performance of footprint models is further compromised by complex topographical conditions and step changes in sur-face properties (e.g. Schmid and Oke, 1988; Klaassen et al., 2002; Leclerc et al., 2003; Foken and Leclerc, 2004), which alter the atmospheric flow conditions. Consequently, the ap-plied method may introduce additional uncertainty especially at sites with fine scale heterogeneities in land cover structure, and frequent transitions from e.g. arable land to tall forest. Overall, the uncertainty introduced by the footprint modeling basically affects quantitative results like the percentage flux contributions from different types of land cover. Effects of footprint uncertainty on the predicted flux contributions de-pend on the relative position of heterogeneities to the tower location and on the local wind climatology, so that it is not possible to provide a general error estimate.
Releasing particles only close to the ground in the setup of the Lagrangian stochastic footprint model introduces an additional bias into the footprint computations, since the ver-tical structure of sources and sinks may be different for each of the fluxes (e.g. CO2flux vs. latent heat flux), and may also change over time (e.g. daily course of CO2assimilation in the upper canopy). Sensitivity analyses for the particle release height carried out for the same LS footprint model as applied herein (Markkanen et al., 2003; Rannik et al., 2003) demon-strate that elevated sources result in a shorter fetch and more pronounced peak of the source weight function, as compared to sources on the ground. Therefore, the footprint calcula-tions for this study can be regarded as conservative estimates, i.e. they tend to overestimate the fetch rather than underes-timate. Since for most sites the fraction of the target land cover decreases with increasing fetch distance, this implies that also the results for target area representativeness tend to be conservative. Effects on qualitative findings are expected

![Fig. 1. Quality rating of the momentum flux during stable strat- strat-ification (z/L>0.0625; z: measurement height [m]; L: Obukhov length [m]) at the Wetzstein site (DE-Wet)](https://thumb-eu.123doks.com/thumbv2/123doknet/12975871.377994/6.892.72.431.94.375/quality-rating-momentum-stable-ification-measurement-obukhov-wetzstein.webp)